Possible Levels For SILJ Correction
April 23, 2024
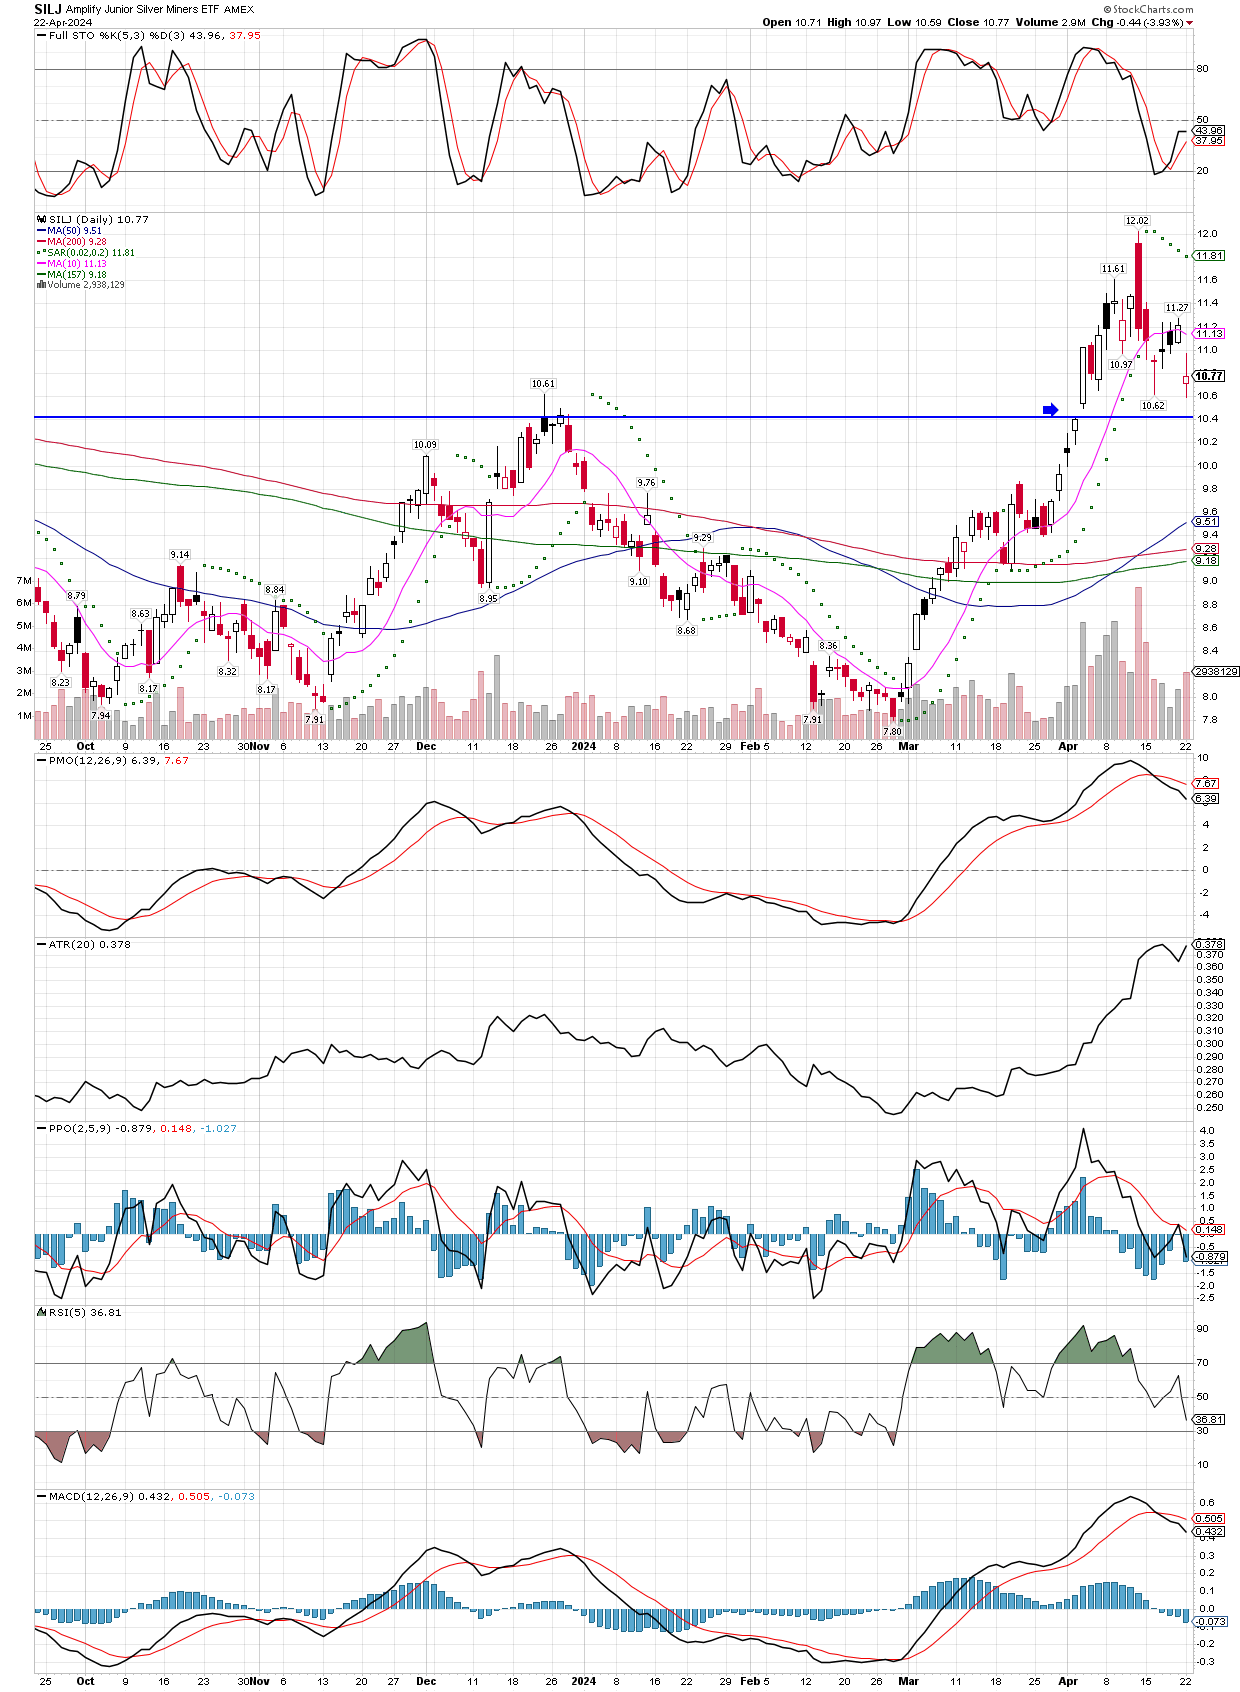
SILJ and the precious metals miners have started a correction. Let’s take a look at possible support zones, where it might hold, then begin to bounce. The upper horizontal trend line is just an estimate of where the 10 WK MA will be in two weeks, as it is gaining roughly 25 cents per week. The lower horizontal trend line is where SILJ’s 10 WK MA should be one week from today. I point this out because strong uptrends typically respect the 10 WK MA, so both those levels are areas I will look to buy, depending on how much time has passed before each level is visited.

Now let’s take a look at the daily chart, where the $10.40 level looks to potentially be important. That would close the gap created there back on April 3, but it’s also the area of older highs which now could act as support. Since the $10.40 number is relevant to both the daily and weekly charts, that seems like a good place for me to add to my position. If it drops below that quickly, I would expect to see the $10.18 level to be the next area of support, on the weekly chart. If the 10 WK MA will be respected in this strong uptrend, the $10.18 zone, should occur sooner (next week), rather than later (two weeks or more), because the 10 WK MA is rising so quickly now.
We were stopped out of our CT (cotton) futures. They went straight down both before we bought them, and after we got involved, trading down directly to my stop. It happens, and while I don’t like being wrong on trades, a trader and investor must honor his stops or it can turn ugly. We still hold NG (natural gas) futures, and since the price is rising, might soon get the signal to add our second tranche.