GDXJ Monthly Chart Looks Good
April 14, 2024
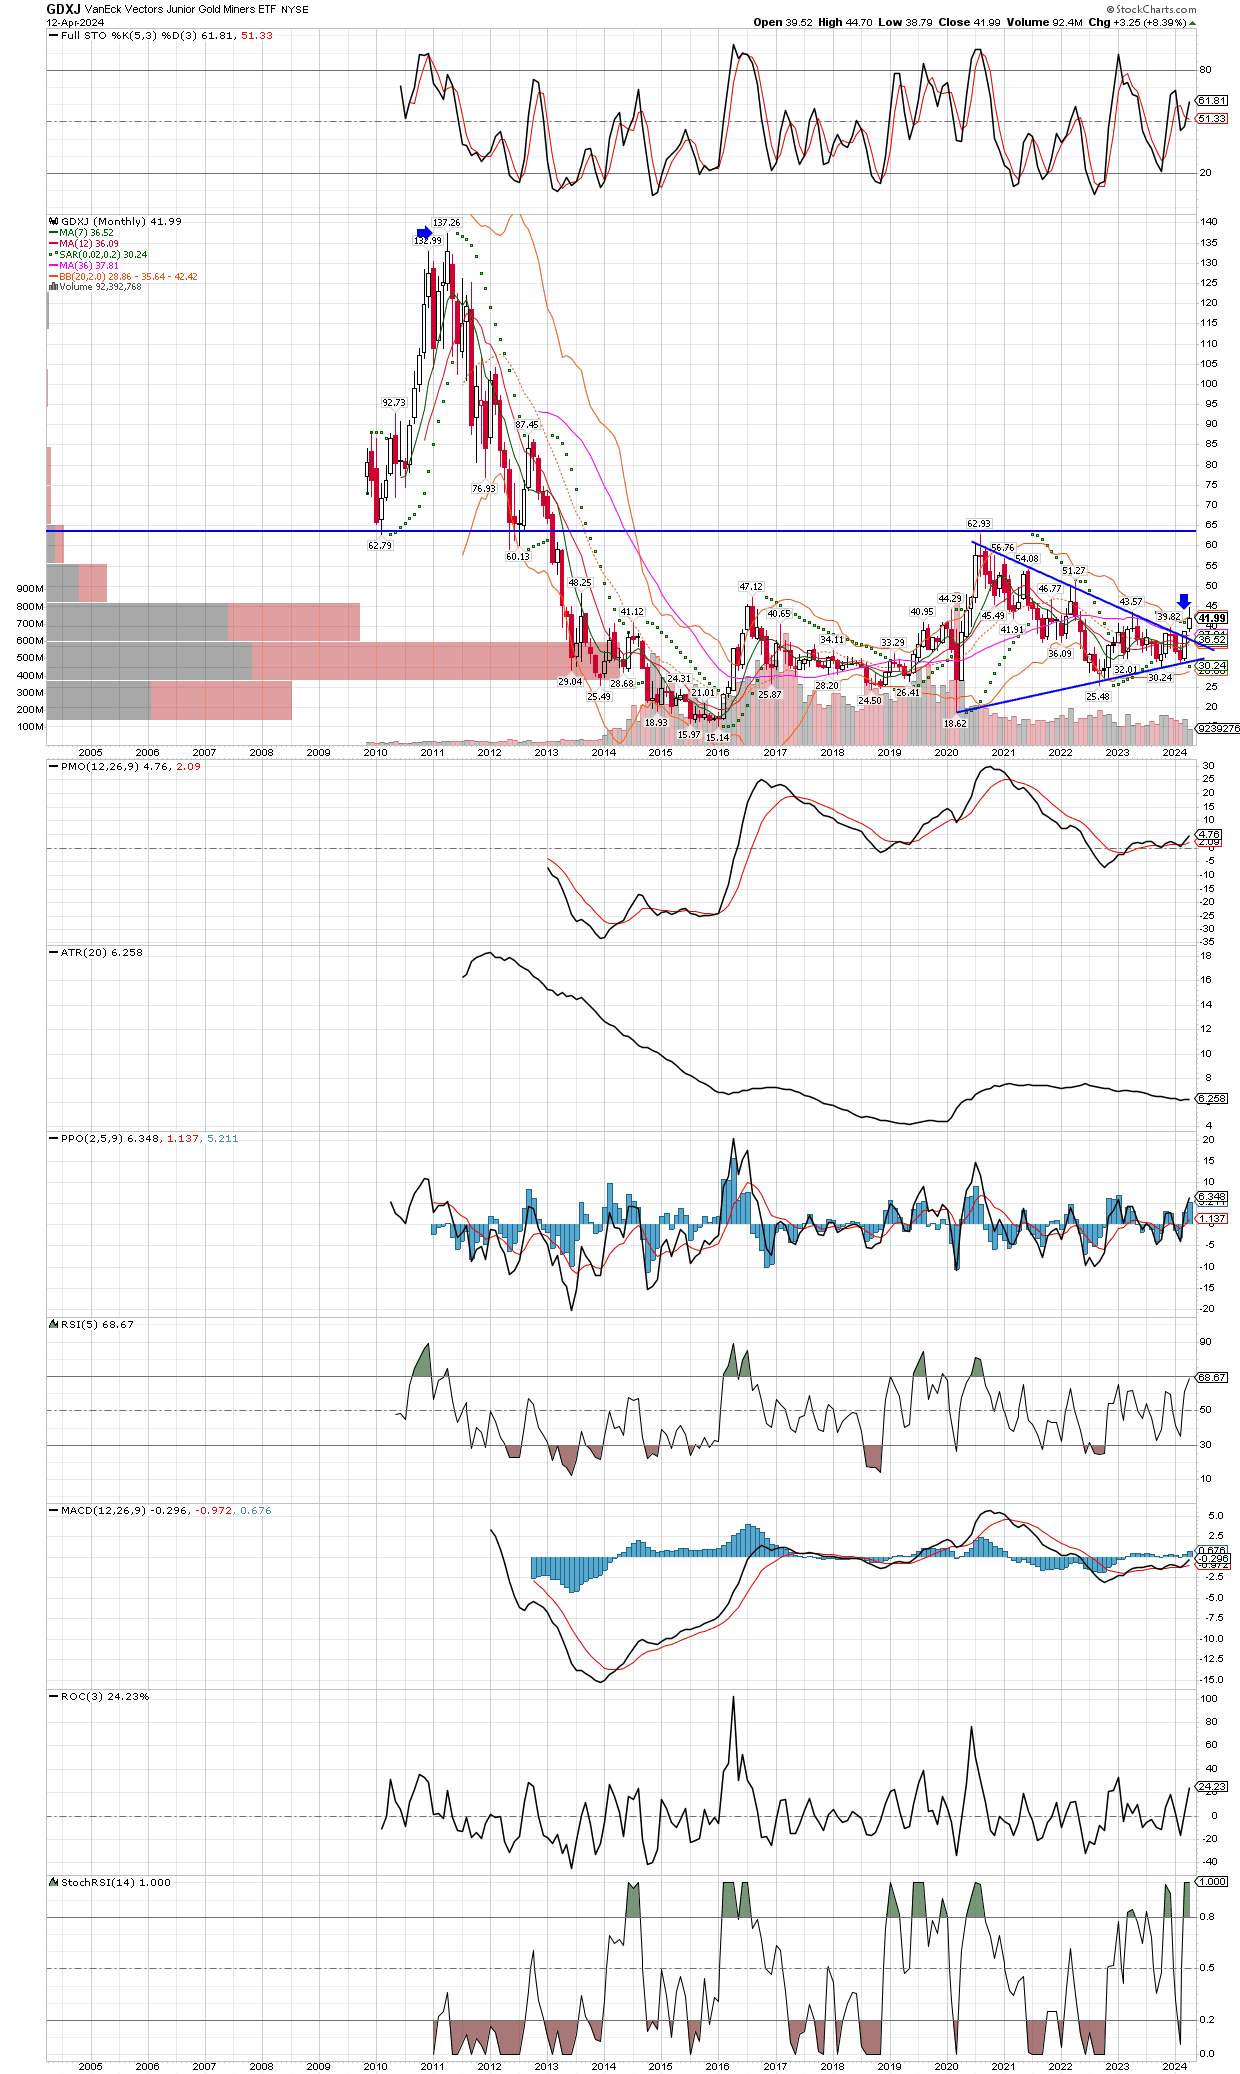
The long term monthly chart of GDXJ (junior miners etf) is shown below. Note the Bollinger Band breakout that just occurred this month, as well as the break above the downtrend line last month. It seems to me the horizontal trend line up around the $63 area should be easily obtainable, and possibly very quickly. After that level gets taken out, the Volume by Price bars overlaid on the left side of the chart suggest there is very little resistance on GDXJ’s journey to visit it’s all time high, which I see as highly likely in the next year or two. That would be gain of another 300% from today’s price.