Keeping with ratio charts for another day, it looks as if something big changed back in September of 2022. The weekly chart below shows us that silver (via the SLV etf) is now outperforming the Bloomberg commodities index (via the BCD etf), after a couple years trending lower vs. the commodity complex, its now taking the lead and establishing an uptrend since last September. I expect silver to outperform going forward, whether the commodity group goes up or corrects further. If SLV outperforms and the group is rising, its just rocket fuel for the white metal! I am looking to add in all accounts into this 3-5 dip, as we near Wednesdays FOMC announcement.
I am aware that I’m not the best at drawing trend line, but I have also learned that it hardly matters on the time frames I am trading. They are always subjective at best, and I prefer to step back and try to see the bigger picture, which clearly shows something has indeed changed. It’s time to buy dips in metals and their miners, with focus on precious metals, though they all could rise together.
SLV should outperform the Bloomberg Commodity Index for awhile.
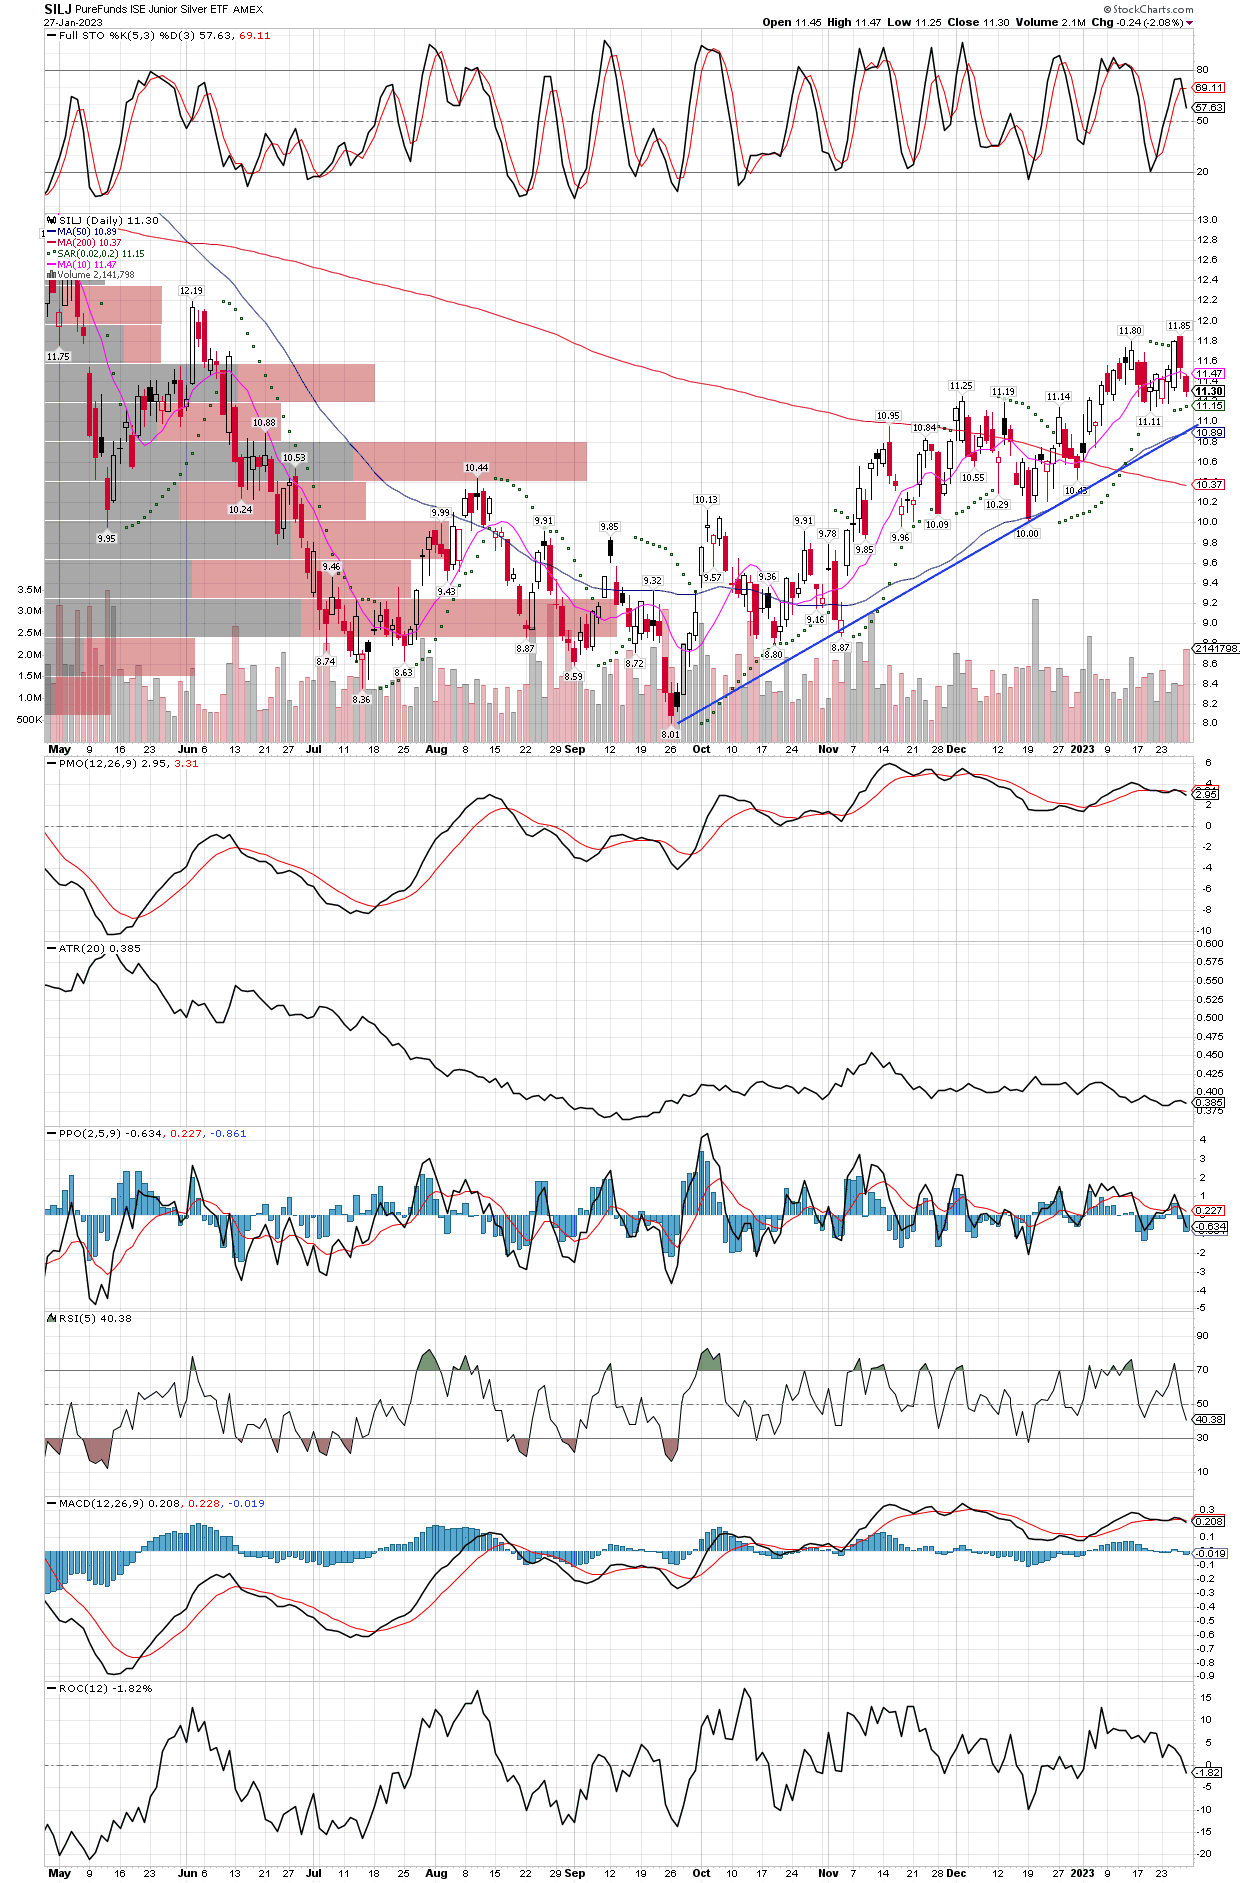
For those looking to add to their position, or initiate at position in the SILJ etf (junior silver miners), they might get a chance this week. The $10.90-$11 level is one area to buy, where both my trend line and the 50 day MA are sitting, below that one could be comfortable buying in the $10.40 area near the 200 day MA. Let’s see if the FOMC announcement on Wednesday Feb. 1 will be a catalyst to push SILJ to one or both buys zones.
If SILJ can pull back to $11 or below, I will happily add to our position. This etf rocketed 389% in 8 months during 2016.
After a secondary offering was announced this week, MAG Silver dropped about 11%. While I will likely wait for two events to pass before I add to my metals and miners, those being the end of the Chinese New Year, and the FOMC announcement, both coming next Wednesday, February 1. I will put MAG on my list of buy candidates, though friends, family, and myself already own some by virtue of being invested in the SILJ etf where the stock is the third largest holding with roughly 7% of the fund’s money invested in MAG. Since its a fairly heavy weighting in the fund, I don’t feel like I have to buy some right this second, though the following chart caught my eye.
MAG is close to both it’s 30 week and 200 day moving averages
I remind readers that my charting skills are not perfect, and creating trend lines can be highly subjective. Nevertheless, I like the chart and have no problem buying it in this general area. I am only waiting because I already am involved via the 7% weighting in SILJ, and we have two potential catalysts between now and next Wednesday that could keep pressure on the metals and miners. The group has had a substantial run, so it will not surprise me if people use the next few days as a reason to do some selling, as I did with various holdings earlier in the week. I trimmed roughly 15% of my holdings already, but have no plans to sell more, in fact I am getting my buy list ready to add back the proceeds into miners, as my long term signals have not given a sell signal yet, they aren’t even close. I believe there is a lot more upside to come.
Readers know I like to use ratio charts to gauge relative strength or weakness. It helps to know how one item is performing against another, not just against price, which can be misleading at times. Today I post the long term monthly chart of the SLV etf vs. the SPY etf, that is silver vs. the S&P 500. After a sharp downtrend, the ratio has basically formed a bottom lasting about 9 years. Also note the last great run to all time highs in silver was back in 2011. Back then the ratio started it’s move up from around the .10 level, and continued rising almost 4 years and gaining momentum into the blow off top in 2011. Could we see something similar play out again? I think so, but first lets see the ratio get through the .08 level, then take out the .10 level, after that the real fireworks begin as a longer term bull is confirmed. As I type this morning, the ratio sits at .054, and is already over it’s 10 month moving average at the .05 level. Just a move to the important resistance line at .10 is a double from today’s level, and if the recent move higher from the lows at .041 are any indication of what silver can do, we should buckle up for big gains ahead. The .041 level corresponds to about $16.20 on SLV, and the etf just recently traded as high as $22.54, a gain of 38.9% while the ratio’s recent peak was only .058! One can only imagine where silver will trade in the next few years as the ratio searches for it’s next spike higher.
The SLV/SPY ratio rising from .041 to just .058 resulted in a 38.9% move in SLV
I believe we are in a commodities bull market, but am not sure of the term used so often lately by others, that we are in a “supercycle” for hard assets. On the one hand, the unmitigated money printing reeks of end of empire, and during economic collapses the only thing to own are tangible products, of which natural gas is one. In addition, the decreasing supply due to restrictions on drilling, cancelled pipelines, etc. should put upward pressure on prices. However, there is a trade off to be considered. Unlike gold and silver which can rise during periods of economic uncertainty, most commodities suffer downward pressure on pricing due to vanishing demand. This makes it a tug of war to determine which way things like energy and base metals prices will go, shortages and more currency units pressure prices higher, as the slowing economy crushes demand. Since I think we are already well into a recession (don’t wait for the government to admit it, by then it could already be on the mend, or a full-fledged depression), I have maintained heavy positions in precious metals and miners, as they should hold up better than everything else, even make good gains forward.
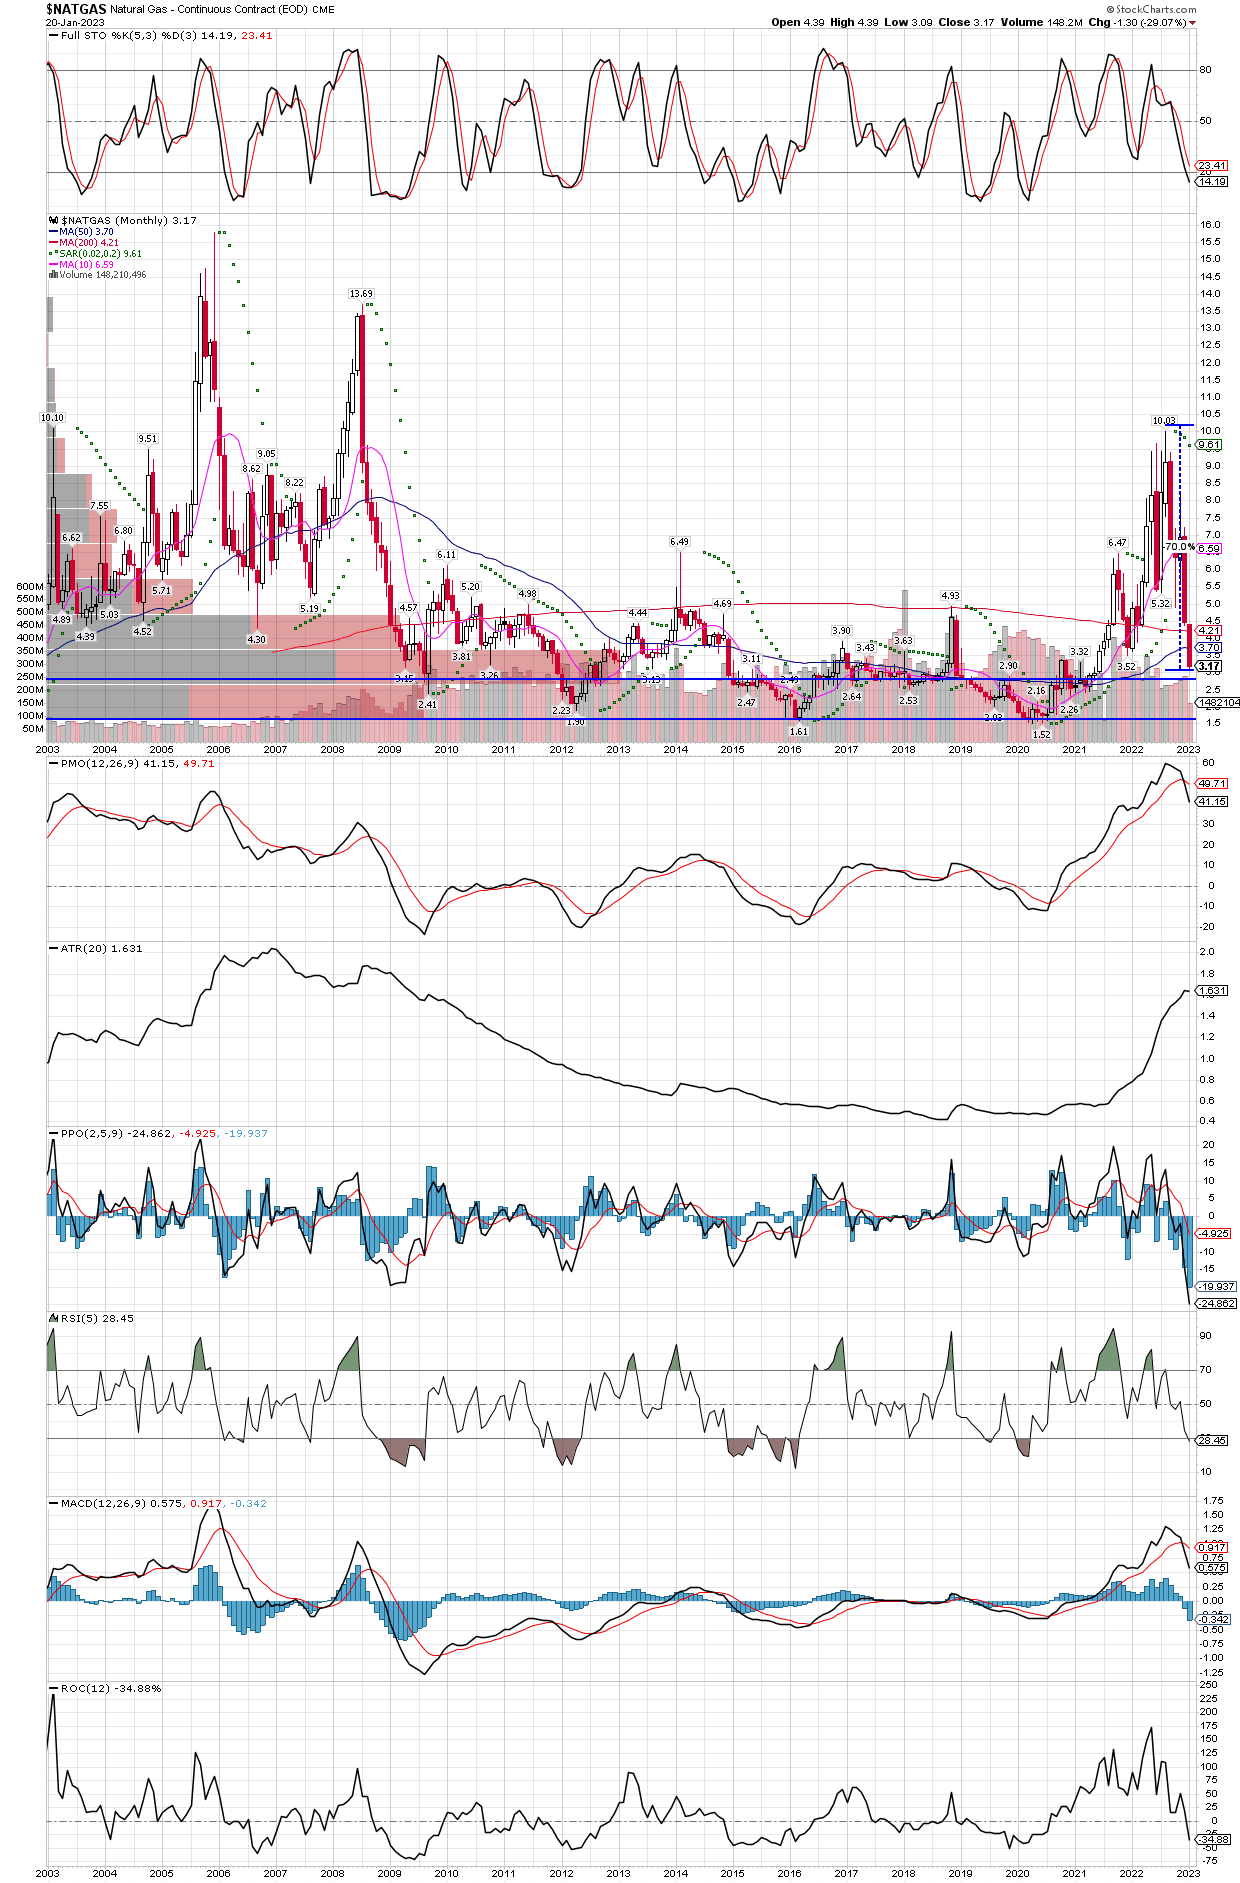
Still, there are opportunities in other commodities when they make outsized moves in one direction or the other, as volatility increases amidst the uncertainty. Natural gas is a perfect example, and we have just recently started a long position. We are looking to add to our holdings until we get to full size, after than we can add at any time if we are still up in the position, meaning we have unrealized gains, and keep overall total risk (TR) fixed. Below, I posted the monthly and weekly charts of $NatGas and UNG respectively, I only switched the weekly chart to the UNG etf since that is the chart I am using to “time into” the trade, and its actually what I bought for myself, friends, and family accounts.
$NATGAS monthly chart, down 29% just this month, and 70% since decline started
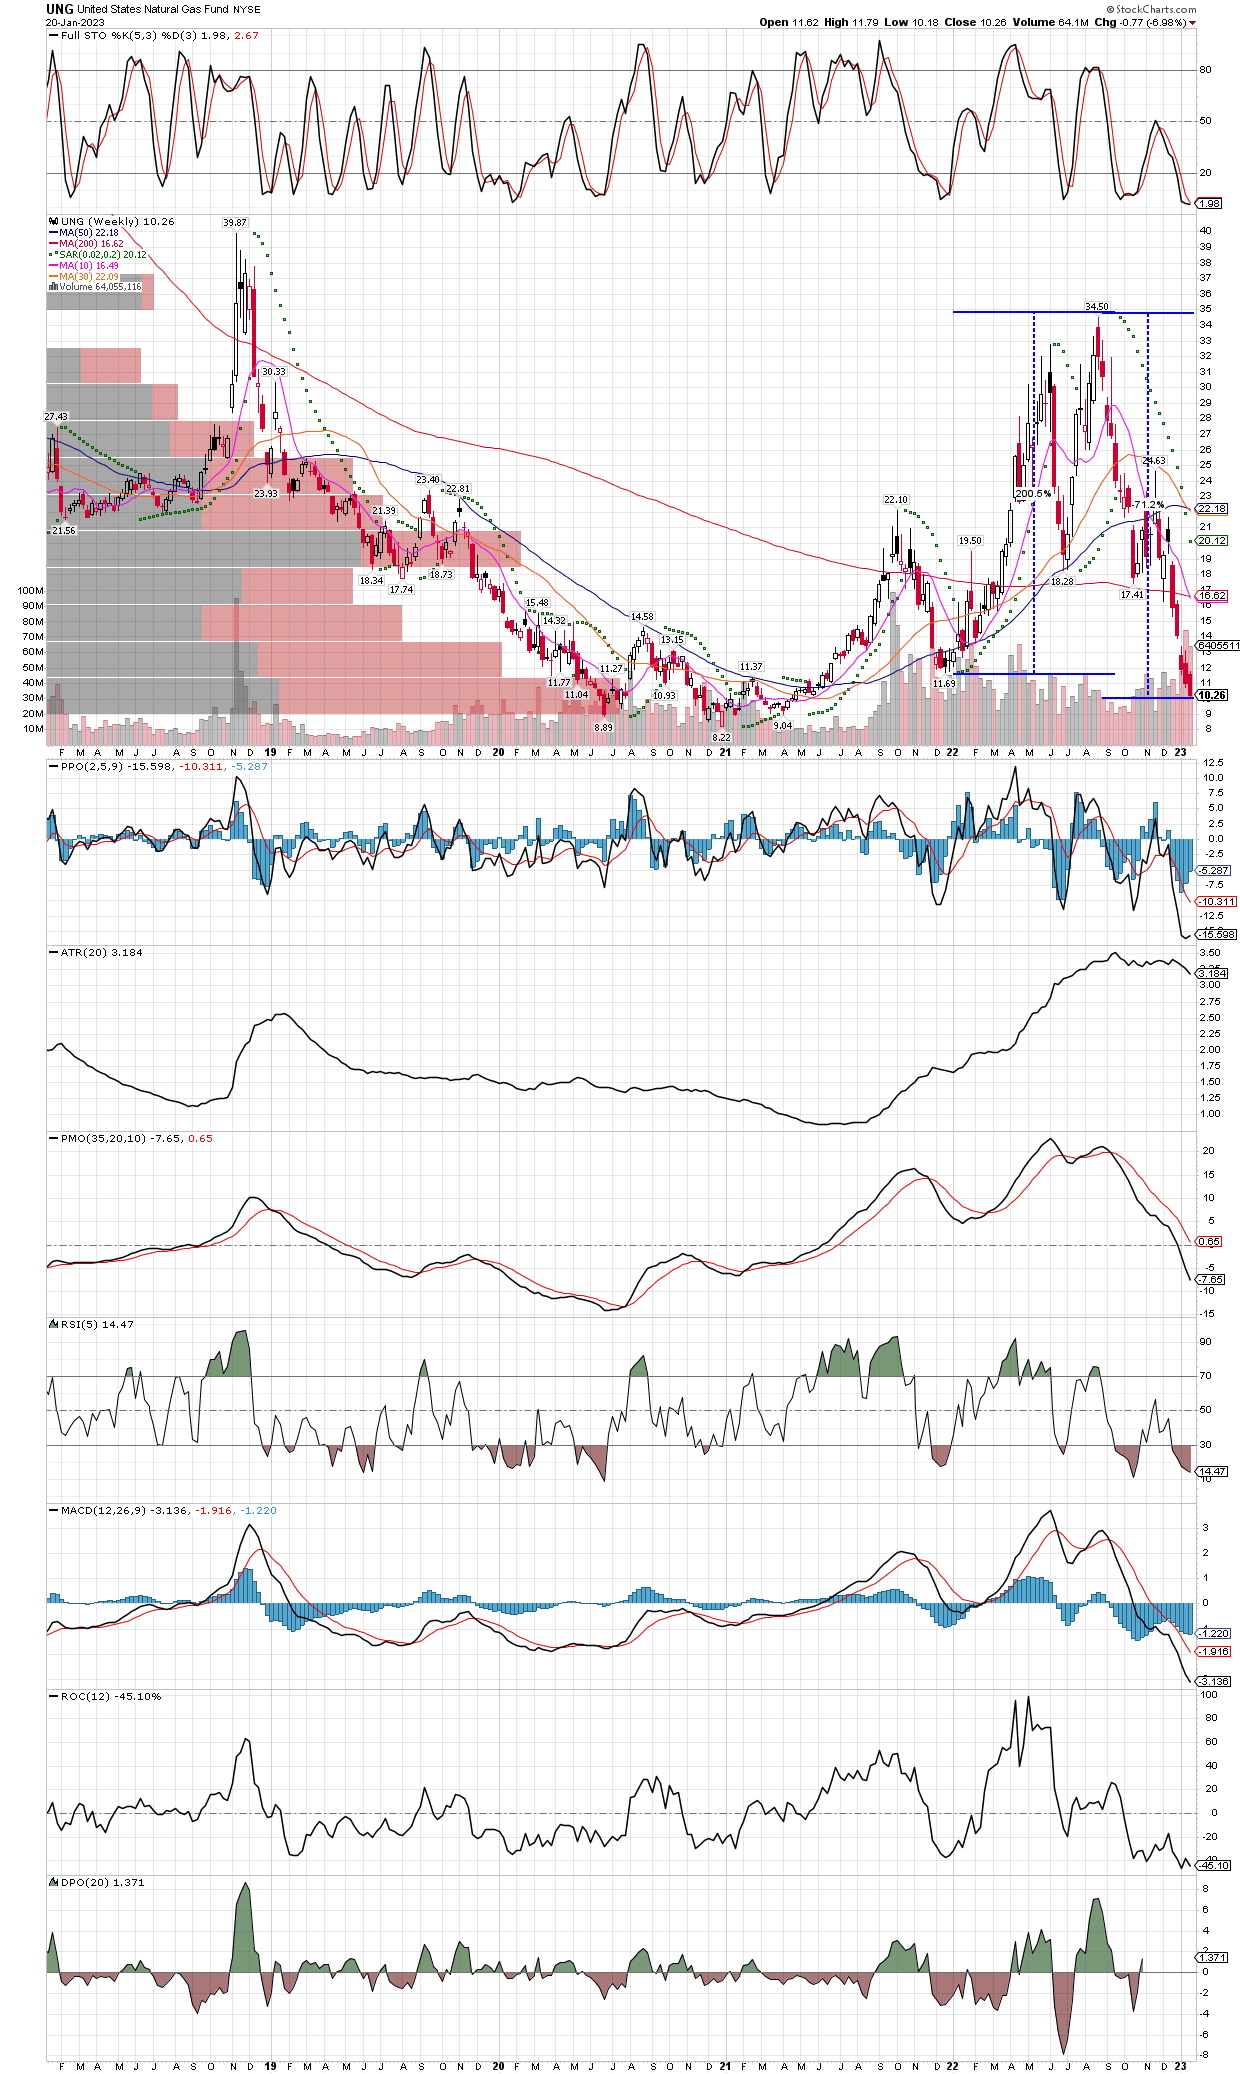
Next, let’s take a look at the weekly chart of the UNG etf, where I have draw two “percentage change lines”. The one of the left that looks like a giant “I” shows the gains from low to high of roughly 200%, while the one on the right measures the total decline from tops to bottom, about 70%. The volatility is absurd, and could present great opportunity if one can get in before a big turn higher, but not so early as to suffer large percentage losses. So why did I choose to start getting invested last week, and looking to add this week? Simple, by any technical measures, natural gas is very oversold, but we also need a catalyst for the next bull run to start. For that, we know that over the last 20 years roughly, seasonal tendencies are for natural gas to bottom into early February, and then experience a nice run higher into late April. In fact, this is typically the best move of the year in the commodity, and while nothing is guaranteed, to me it is well worth taking a shot. I do think a weak economy could keep a lid on energy prices for awhile, but natural gas looks way overdone on the downside, especially considering it was able to rise 200% in such a short time recently, it means that natural gas is in play and plenty of participants making bets. I’m betting it’s more likely to make a big jump from here than a big decline, but as always, I will keep my total risk (TR) to the portfolios fixed.
UNG weekly chart, it took about 6 months to gain 200%, then 6 months to drop 70%
In this post I will show various charts of the progress miners and metal are making thus far in 2023. I will include various ratio charts to illustrate just how well our holdings are performing, but I will save new trade setups and signals for a separate post. First, lets take a look at the SILJ etf WEEKLY chart, now trying to work over the horizontal trend line. I fully expect this fund, which is comprised more of mid-cap producers than actual junior explorers and miners, to make significant all time highs in the next 1-2 years, which would be huge gains from today’s levels. Not only do I expect miners and metals to be the best performing group for the foreseeable future, they might be the ONLY group to own, as just about everything else drops. Simply put, there is not much competition for safe havens any longer, as the 40 year bond bull has rolled over and gotten battered, bitcoin and cryptos even worse, being down over 60% last year (and many cryptos down 90%, while exchanges like FTX vaporized to nothingness), even real estate has turned the corner and while at least its tangible, can still drop sharply at times like in 2008. Meanwhile, everybody should own some miners and metal, and almost nobody does, even long term gold bugs. What an opportunity this is, as money has just begun to flow back into the group.
SILJ WEEKLY chart, notice the 30 WEEK MA has just turned higher
SILJ is working through that area where I have drawn the horizontal trend line. Keep in my trend lines are subjective and can be drawn wherever a person wants, so its best to think of the line more as an area or zone, than a line in the sand. Not only are SILJ and the other miner etfs like GDX and GDXJ trading above their 30 week moving averages, note the moving average itself has just turned higher, which suggests a longer term trend has likely just begun and could last 1-2 years as mentioned above.
Now lets take a quick look at the daily time frame, and since most of the miner etfs are looking more similar than different, we can swap out SILJ for GDX, which is the biggest etf if the group. Personally, I am invested more in SILJ since I think it has the most potential upside of the mining etfs, and I like that while its called the Silver Junior Miners etf, it actually ends up being diversified between gold, silver and base metals, as there are very few, if any pure silver miners. Silver is mostly produced as a by product of other metals mining, and many of the stocks in the SILJ are roughly half gold production and half silver production. IN the chart below, we see GDX, along with most etfs in the group, has just seen the 50 day MA cross above the 200 day MA, also know as a golden cross. also like it is mostly comprised of mid-cap producers that have lots of upside (more than majors), and less risk than junior explorers which have been starved of capital and usually don’t perform best until the latter stages of a bull move. Don’t get me wrong, I like true juniors as well, but only when it’s their time, and we might take some profits off the table at some point and put that money to work in dinky juniors for the last leg, but isn’t imminent because explorers will have to raise cash after a long drought, as soon as their stock prices rise. First the majors move, then the mid-caps, then the more risky little junior explorers.
Daily chart of GDX, several miner etfs have made a gold cross higher in the last few days
Enough for today, in the next posts I will show some new setups and positions we have just begun to nibble on, such as natural gas, and why we bought the commodity instead of the companies that produce it, for the time being, as well as some important ratio charts to illustrate what is happening beneath the surface. If one is not yet invested in the precious metals or the miners, now is an ideal time to do so or as good as it will get since late October was best, with the benefit of hindsight. This bull has a long way to go with much higher prices ahead, more so considering there are not many viable alternative now. I have put my money where my mouth is, and am aggressively long for myself, family and friends.