Miners Following Through on Upside

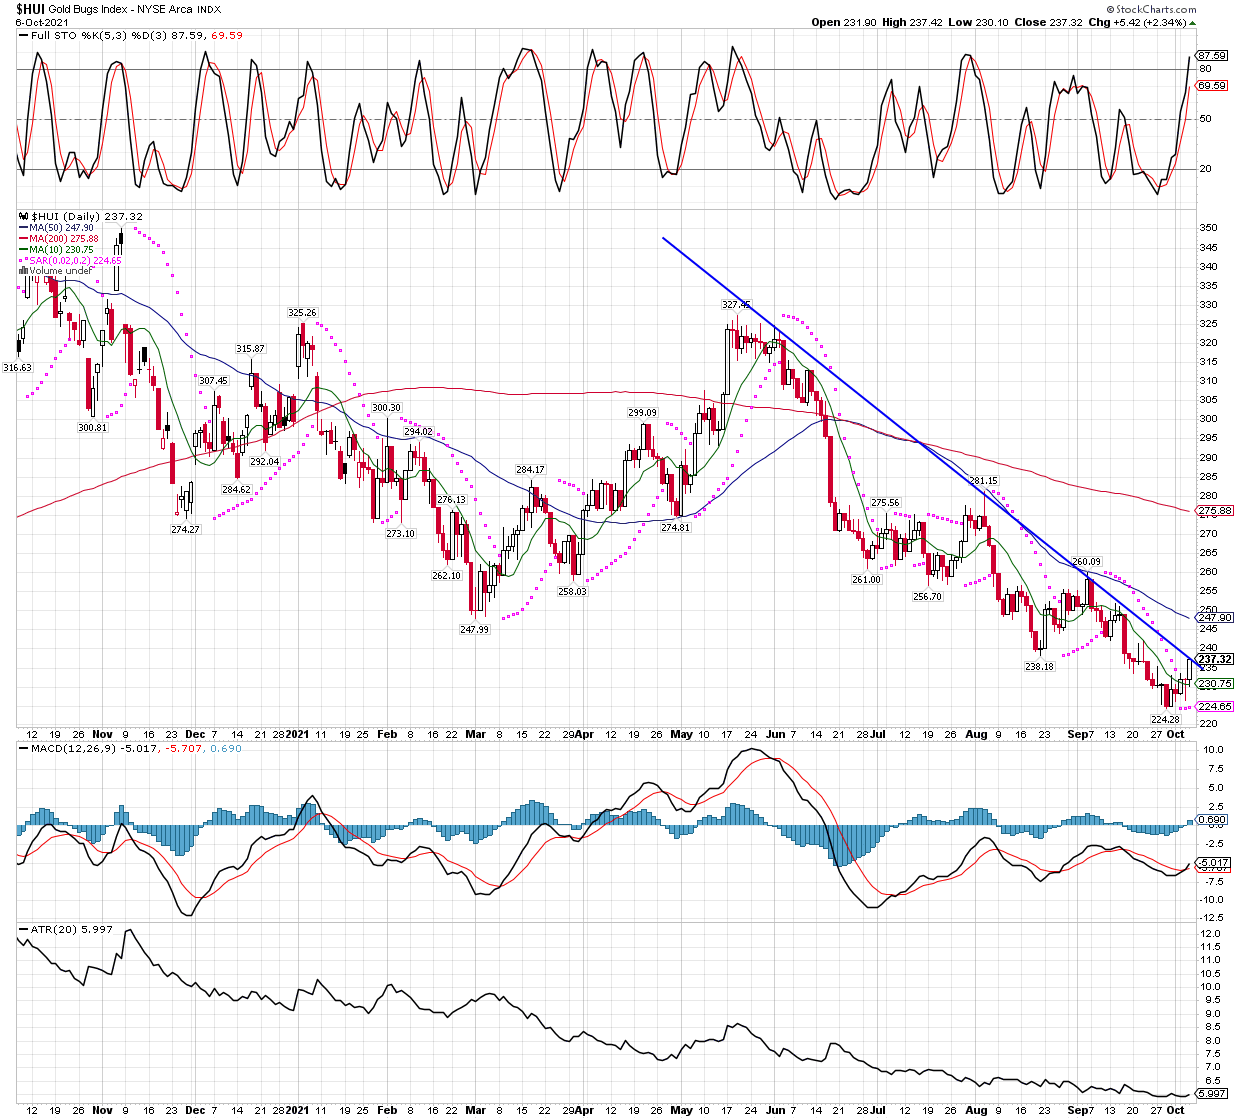
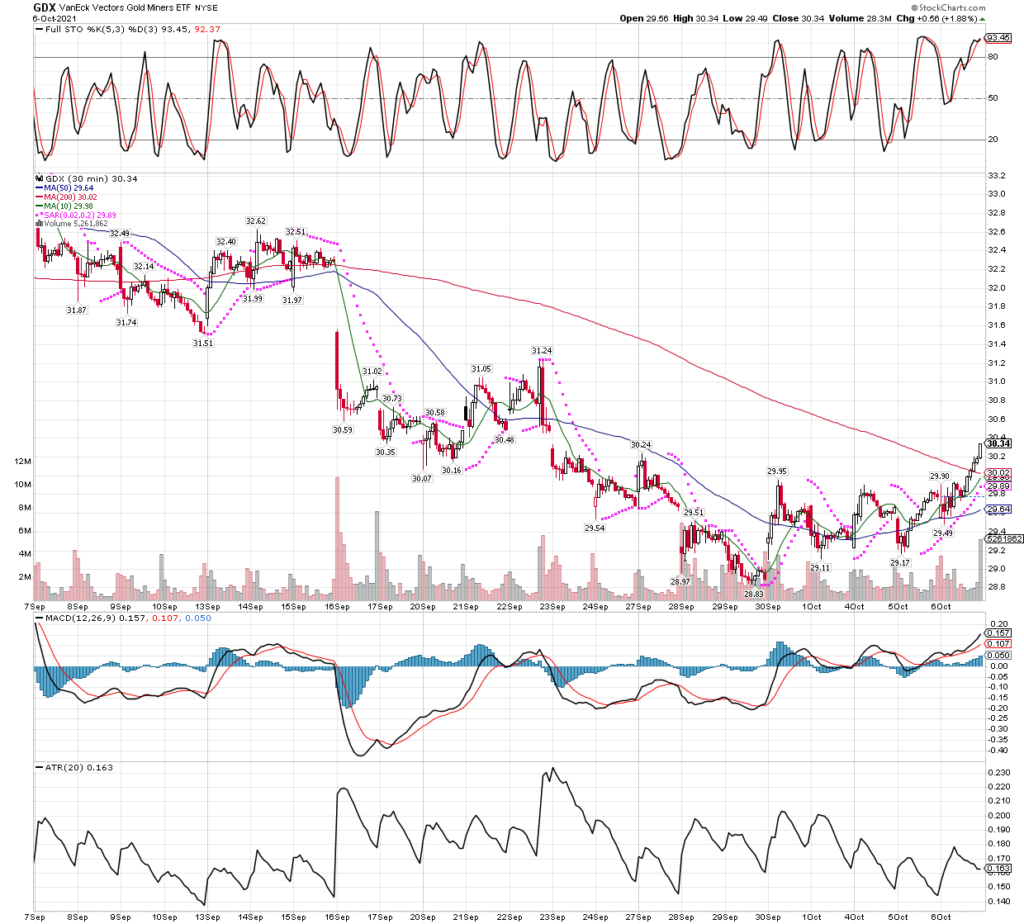
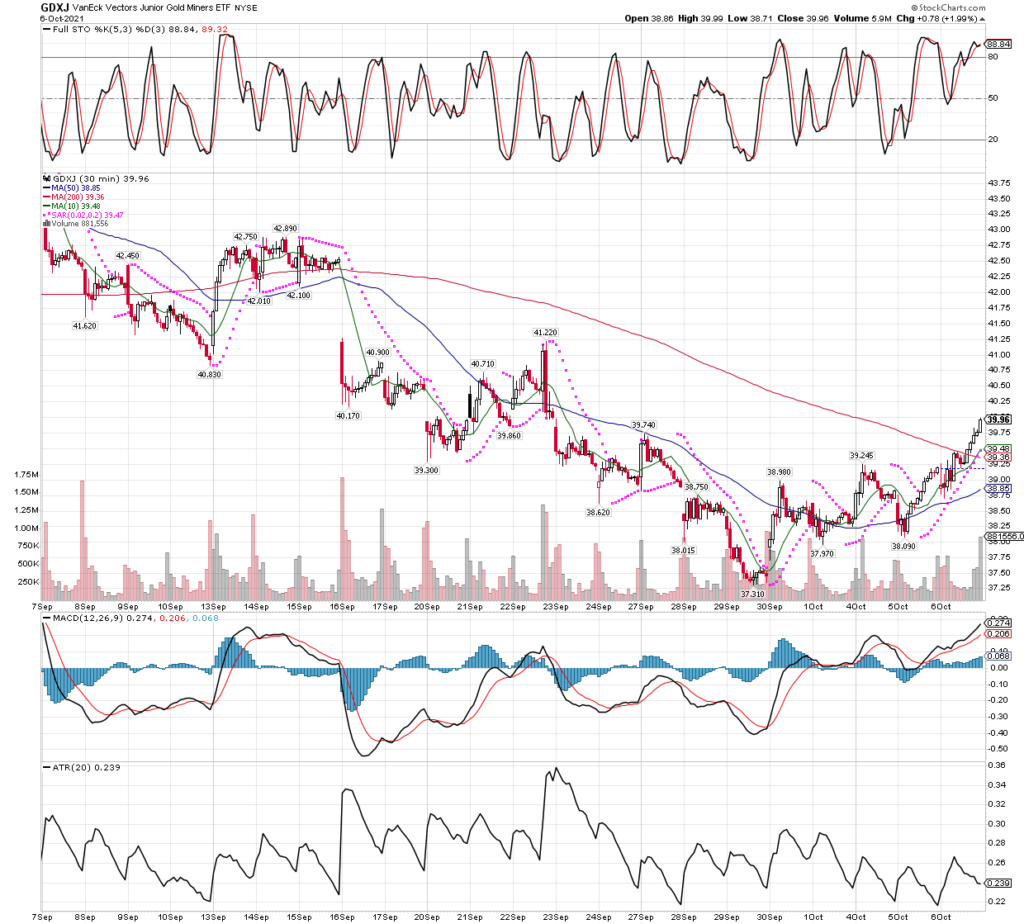
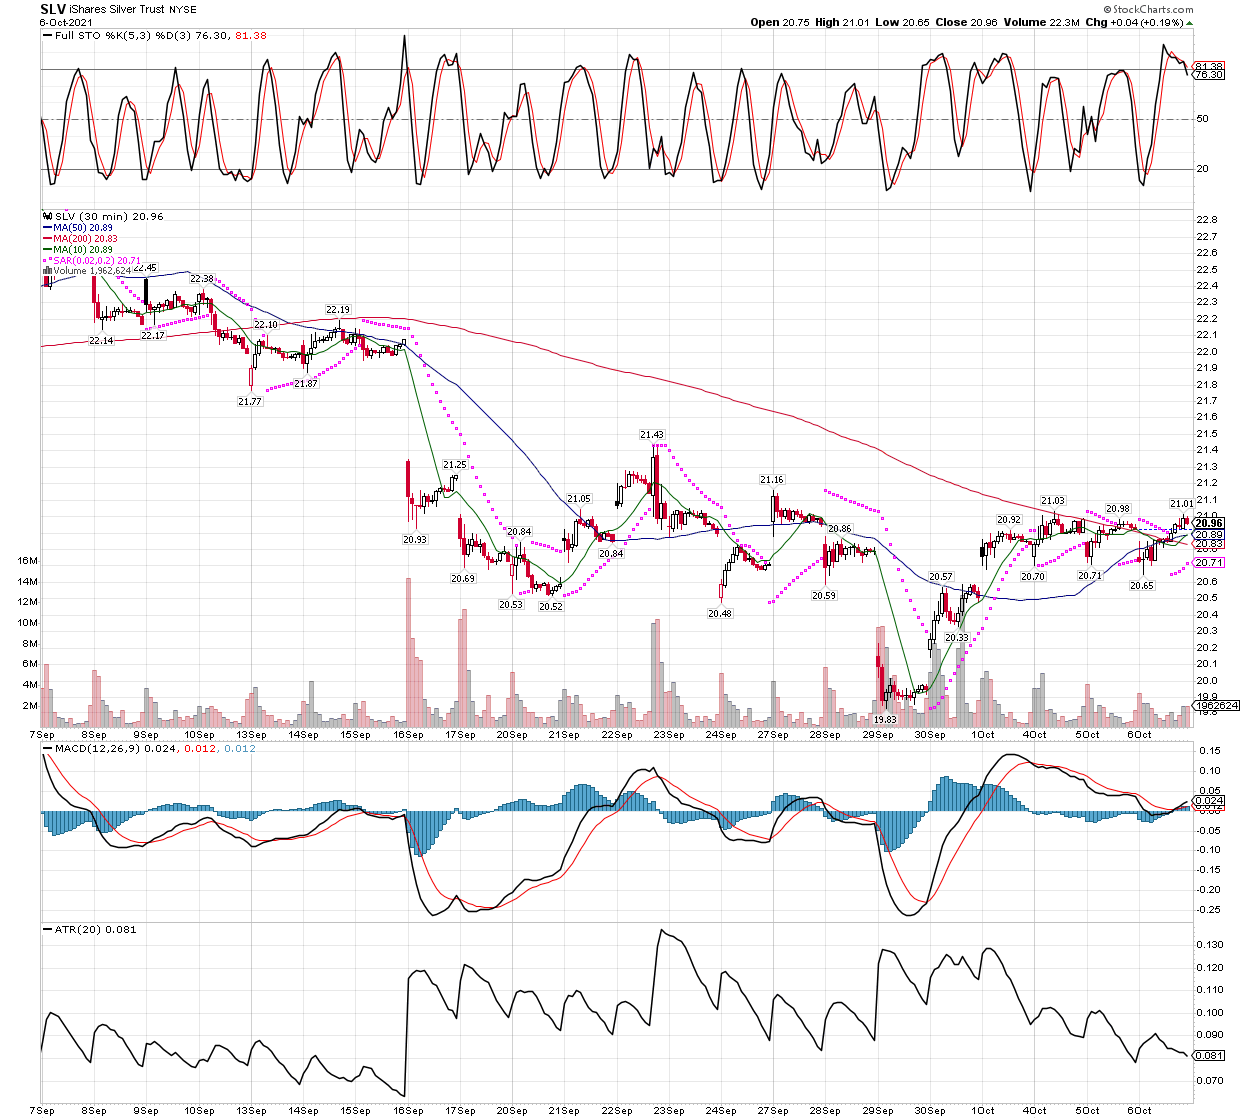
This is a quick Monday morning update since I have several things to mention. First, the precious metals miners are continuing their rebound out of oversold technicals. We remain heavily long for now, and the absolute earliest we might decide to trim some holdings would be when the sector reaches overbought on the WEEKLY technicals, which is at least a week or two away from now. Even then, if we do any selling at all, we will limit it to 20-30% of holdings, and stick to our plan, keeping 70-80% for the much longer term MONTHLY signal, which is still many months away from any sell signal. So far, so good with this sector, as more names each day pop back above their 200 and 50 day moving averages, suggesting the uptrend is back in place. This filter on the Finviz website shows 11 miners are now back above both moving averages, whereas two weeks ago it was zero! The same filter with silver miners shows they are just getting going, with only one miner on the list (MAG Silver).

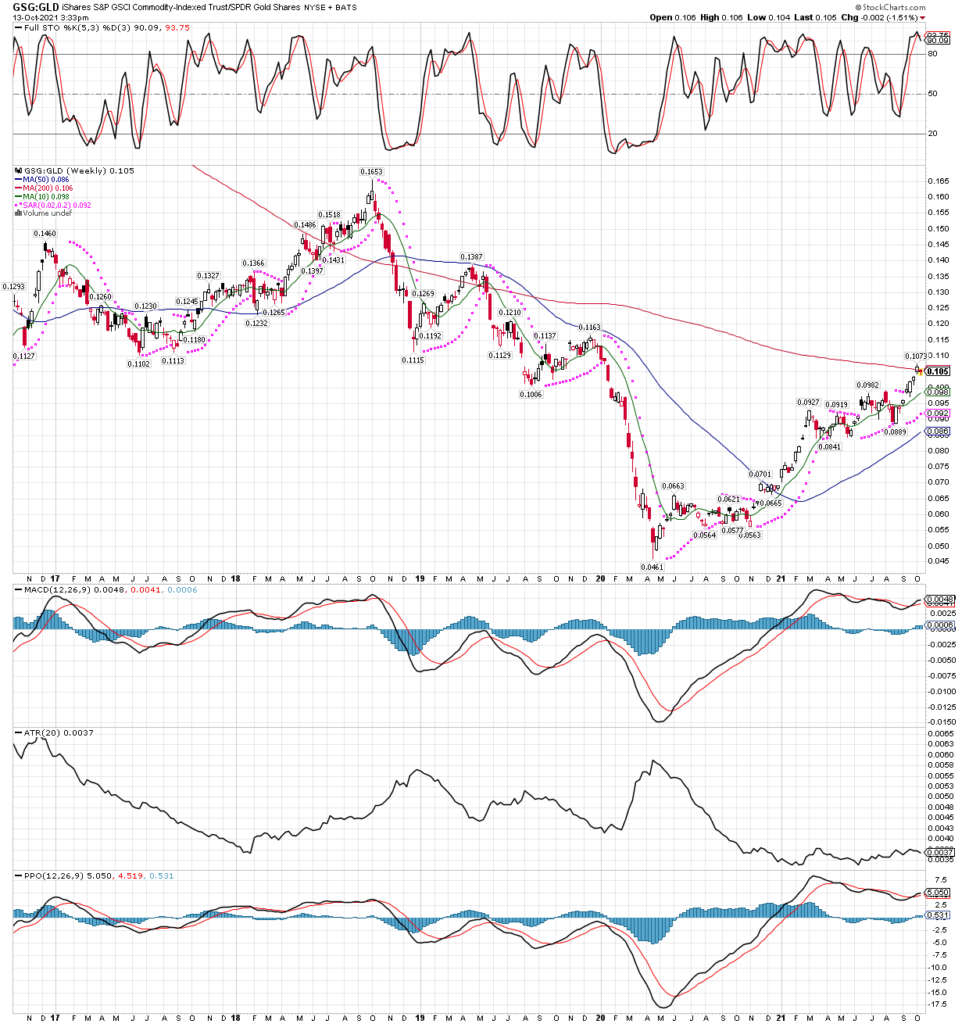
The above is not surprising to see, considering gold futures are now back over their 200 day MA as well…

If gold futures can stay above the 200 day MA, it will bring buyers in and the uptrend will be back in effect.

If one does not yet own gold and silver miners, or at least the metals themselves, it is time to get heavily long. Actually, the best time to do substantial buying was several weeks ago, but for those that like confirmation and realize the commodities bull is nowhere near finished, buying what they can comfortably hold through pullbacks seems like a very wise move right now. We have seen many associates in the trading world get knocked out of their miners this year, but it isn’t often we hear a legend like Pierre Lassonde speak so strongly on the opportunity just in front of us, suggesting we “buy miners until it hurts!”. He also says we are witnessing a perfect 50 year storm in favor of gold, in this interesting podcast over at KingWorldNews. I highly recommend people spend the 12 minutes to hear what he is seeing, in his own words.

I am seeing more and more stocks regain their strength, and just head of earnings reporting season, like EQX for just one example pushing back above its 200 day MA…

EQX is working back above its 200 MA, which is a necessary step to give investors confidence the bull is intact, and bring in more buyers over the next few months. MUX is another miner trying to get back above its 200 MA, and the list is growing by the day, it is time to be heavily long in my opinion.

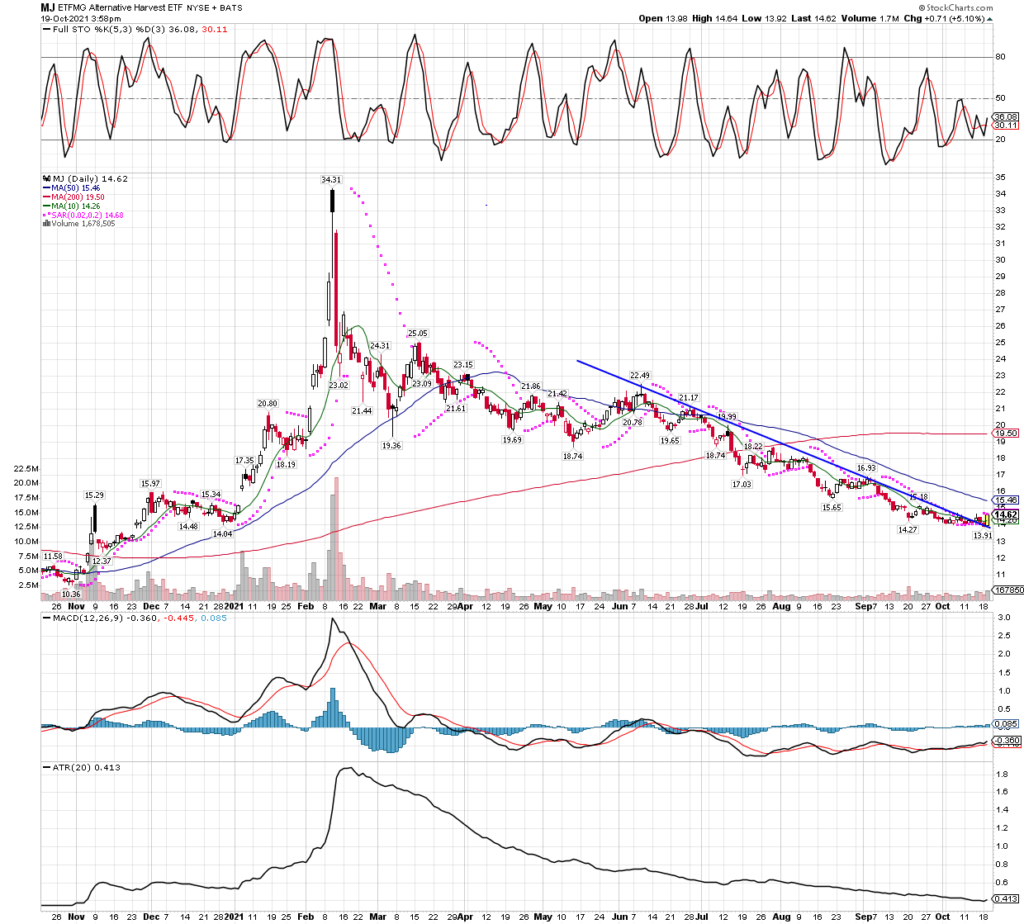
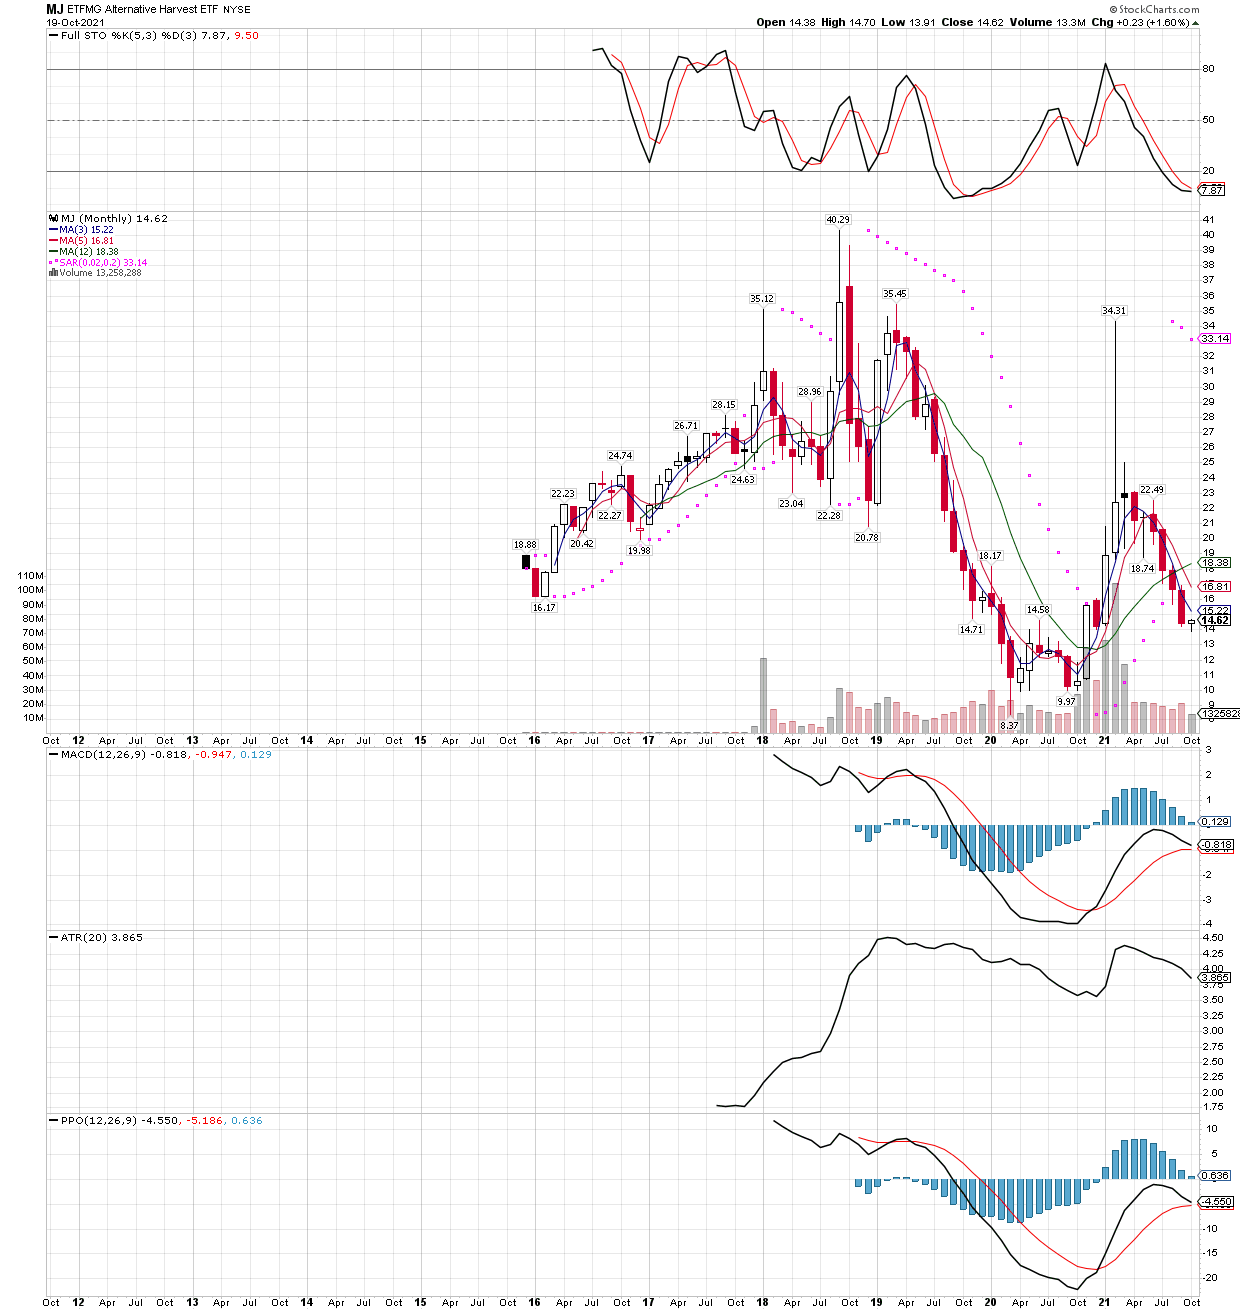
In other areas of the markets, we mentioned last time a possible buy signal in the marijuana stocks, specifically the MJ etf. We have not yet bought, but we might initiate a position here soon. We are also on the lookout for a potential buy signal in the EWZ (Brazil) etf in the next few weeks, but for now our major focus remains on the miners as they are signals already in play. Here is a chart of the EWZ, so you can put it on your watch list for a possible buy opportunity…

EWZ (Brazil) etf is down over 30% since July, and remains entrenched in a downtrend so we are not yet buyers, however we are on the lookout for a possible trend change after a few more weeks of sideways to lower movement. We will not take a daily buy signal on this one, preferring to wait for the larger potential weekly or monthly setups to trigger, which will still take at least a few weeks. Brazil is heavily affected by commodity prices, so it’s odd to see it down so much with commodities doing some well, in general, perhaps that will clear up soon, one way or another?

Tuesday October 19 Update, and New Trade Signal in the MJ etf.

As miners continue to go sideways the last few days up near recent highs, which I like, a new buy signal on the marijuana etf MJ is here. I have not bought any yet, as my major focus continues to be on the precious metals miners, but I will look to acquire some MJ etf (the Alternative Harvest etf) into the next oversold intraday technicals on the 30 minute bar chart. I was tempted to start buying some before the close fo trading today, but the marijuana stocks were closing at the high of the day, after a long, tedious downtrend day after day since the beginning of 2021. Waiting for that longer term downtrend to re-exert itself in the next day or two seems like a better bet to start buying, rather than chase a short-term overbought move, since they always seem to fizzle, at least in 2021 so far. It’s the same way I have been buying my miners, there is no good reason to chase moves up in the context of an overall downtrend, except for the day they make the turn higher permanently. If you can tell me when that is, I will change my buy strategy!

I will keep this post short, and just show you the daily, weekly, and long term monthly charts on the MJ etf, so you can see how oversold the technicals are. Of course, they can stay oversold for awhile, so we don’t want to go in too heavy at the first positive sign like we had today, there have been many other days like this in the last year, and MJ always manages to head lower again rather than turn the trend up. Trading is just a game of probabilities and risk management, not much more to it. Lets take a look at those charts….

MJ’s daily chart shows a downtrend in place since June is no being broken, while oversold stochastics are just turning higher. I am willing to bet the MJ etf gets to the 200 day moving average at some point over the next few months, if not much higher.
The WEEKLY chart for MJ also shows drastically oversold technicals across the board, and the etf is in a triangle that is converging rapidly, suggesting a break out one direction or the other. After an overall downtrend since 2018, my bet will be that once MJ finds some significant buyers, this etf will easily take out that $20-$21.50 area at a minimum.
Long-term MJ MONTHLY chart with very oversold stochastics that are about to cross higher. We need to decide what time frame signal we are going to trade, being all three charts are showing oversold technicals, we can choose whichever we like. I usually buy into the longest term signal available, in this case the monthly setup, in cases where I will be going against a well-entrenched downtrend. This allows me to expect and ride out the bumps until the etf not only turns higher, but goes through several intermediate cycles, which should get us to the next “runaway” phase of the new bull market.

Rocket Ride, Can it Hold?

Heading into the last half hour of trading today, I’m pleased to see the miners still up close to the highs today, and after a stellar day. This is the first day in a long time the miners made gains all throughout the day, and managed to hang onto them, so its a very encouraging sign. I wonder if the market is going to start treating the stagflationary possibility more seriously, and if so, precious metals and their miners should be a great place to be invested.

On top of that, its looks like the USD index might be topping out, or at least due for a break. I don’t put too much weight on the USD index when trading gold and silver, as it’s just a measure of one fiat trash paper vs the others, in my opinion meant to confuse investors and get them to take their eyes off the ball. Below is the daily dollar chart via the UUP etf, I won’t argue whether or not it has seen its 3 years cycle low already, or not, but its clear the dollar could have some downside near term, which should lend support to precious metals.

Daily chart of the UUP (US dollar etf)

Another influence I am considering is that the commodities vs. gold relationship looks to be reversing today, after 15 months or so of gold under-performing the other commodities, that looks like it might be changing, more so because we see resistance and overbought technicals on the WEEKLY chart of the GSG:GLD ratio (the Goldman commodity etf with 50%+ oil in it, and only 6 or 8% gold vs. the GLD gold etf (100% gold). While I don’t expect any commodities to get too weak in this economic environment, it is time for gold to take the torch once again as world economies start to weaken for various reasons. If you ask me, the economies never fully recovered from the fiasco that was rearing its head BEFORE the covid event occurred, but now even with all the money printing, we are heading back to the realization of broken supply chains, most small businesses still closed down, not many people traveling, while many are losing their jobs for the now wise decision to NOT get injected with an experimental drug that looks like it makes one MORE vulnerable to the virus than if they did nothing, among other things. All this occurring in the face of central banks starting to tighten monetary policy, which is almost laughable but happening nonetheless. After all, they have to appear as if they are responsible! So while I would not short commodities in a zero interest rate world that is very likely to stay that way for some time, I still would bet on what I see will be the strongest commodities for the next year or so, gold and silver. Everything else has rocketed, while silver is still less than half its 1980 high price! Below is the WEEKLY GSG:GLD ratio chart, if this turns in earnest, we might be on the cusp of the final and strongest run in the gold bull yet. If the stock market starts lower, that will only add fuel to the fire. Get your miners, or get your metals, or some of both.

GSG:GLD shows commodities overbought vs. gold on the technicals while sitting right at the 200 week resistance.

As I type I see that the intraday technicals have now pulled lower into oversold territory, so I will look to add to positions before the close, or tomorrow morning not long after markets open. I won’t be making large buys as we’re already loaded up for the ride, but I still like to remind myself what one should be looking to do, so they don’t make the mistake of taking profits way too soon or some other error. It’s time to BUY or HOLD, but nowhere near time to sell, despite most miner etfs being up 8 or so days out of the last 10.

So Far, So Good

Today we saw some follow through on the miners to the upside. This post will be short because nothing has changed, other than we added to our GDXJ etf position. We will look to do some more buying tomorrow if we can get the intraday technicals into oversold territory, which seems likely being they are already close to oversold intraday, and they are getting overbought on the daily chart. When markets put in bottoms, and especially after such extreme moves lower like we have witnessed in this sector the last 15 months or so, it gets difficult to buy the exact bottom. For example, today I noticed many amateur traders on various blogs stepping into miners with the hopes they have caught the bottom. Well, they might have bought the low, but it doesn’t matter the least, if they sell out after small gains, or on the first sign of weakness. They will just tell themselves they are being prudent, or managing risk, which sounds great except they are also guaranteeing they never make a big score, its that latter part that never gets mentioned or addressed!

So today we saw the HUI index finally break through the daily downtrend, which implies we have more upside soon, though does not guarantee it continues tomorrow. If the amateurs can get shaken out in the morning, enough to push the technicals to oversold on the 30 min bar charts intraday, we should be happy to but their stocks from them. Let them try again after miners rise another 5%, only to get scared out and give us their shares cheap once again….rinse and repeat. Its been a tough ride, but its just part of the game. If one has made it this far, now is definitely not the time to get out, its time to buy or add, or sit on our hands, but don’t give your shares away to a guy that has bigger nuts than you, it never pays! Here is the HUI gold bugs index, nice and simple….

Changes

Well let’s hope I have more to talk about soon, and today is a good example of some changes that are finally starting to occur. It has been one tough ride, I won’t deny it! Today we see a few things happening that always precede a trend change, for example the short term charts start to flip to positive before the long term charts show the strength.

While I didn’t make any changes today, thus have no trades to report, I want to show you what i noticed today. On top of the early weakness which was again reversed during the day to close positive, let me show you some charts. GDX, GDXJ, and SLV among others, all turned higher on the half-hour bar charts, in fact some are already showing a “golden cross” higher, basically confirming an uptrend on this very short term basis. We want to see more strength, and start turning the daily, weekly, then monthly charts higher again, but its a start!

GDX intraday chart with half-hour bars breaking decisively above the 200 period moving average, a golden cross is soon to occur if the strength can hold, and will confirm a short term uptrend, the first key to turning around a long term trend. The other intraday charts will show similar action, also good to see because it’s a group effort!
The junior miners and explorers via GDXJ are showing the same action.
Silver is even better, in that it already has a golden cross in place, SLV should go higher in the near term.

Lastly, let’s back out and look at the daily GDX chart, which shows a PSAR buy signal triggered today. It’s the sole pink diamond on the far right side of the chart, and GDXJ again is similar with it’s own PSAR buy triggered today. I will also not that Bob Moriarty from 321gold.com wrote today in his article that he thinks the bottom is here. I respect his opinions and while nobody is right all the time, he gets darn close and should not be ignored. Keep in mind the miners have started weak in the mornings the last couple days, only to finish much stronger. Lots of bulls are out of positions right now, sitting on the sidelines and waiting for miners to turn higher. If this is the turn, they can gain upside momentum very quickly, so if I did not own miners yet, I would be making big buys tomorrow!

I won’t just run out and buy first thing tomorrow, but I will be ready to add to positions in strong names like Equinox Gold (EQX) once the stochastics reach oversold on the intraday charts. That could happen tomorrow later in the morning (at the soonest) or if not by the close tomorrow, then I should get a chance on Friday at some point, but I will wait until miners get oversold no matter what.

SLV False Breakdown Confirmed

While it could still change in the future, sure enough my post yesterday suggesting the best bet is to always assume support and resistance will hold, was right on track. I will re-post the chart today, not to toot my own horn because lately there has been nothing to celebrate, but to show in real time how that rule comes into play. Today we are now back above the “breakdown”, proving its best to consider support and resistance as areas, rather than definitive lines in the sand.

Before I post the WEEKLY SLV chart again, I have a couple items of interest. First, over at KingWorldNews we have a short article directly addressing the silver miners and their recent beatings that you should consider. Can it get much worse, and if not, then what is the proper bet? I say higher, especially when we are seeing “historic” selling. We should ask ourselves WHO is doing all this selling, considering most investors have been running scared and selling for over a year now? Could they be pushing SILJ as low as possible to cover the shorts they use to steer prices lower, just before they do heavy buying to cover the shorts and go long the etf at the same time? My guess is YES, that is probably what is happening and we will know soon enough if I am correct. I did buy some more SILJ this morning with these thoughts in mind.

Another interesting occurrence is that the WallStreetSilver thread over at Reddit has caught fire with the number of new members joining each day now. We are seeing 2-3K new subs each day this week, after months of only 50 new members per day, if that. I will let you draw your own conclusion, but I can’t see how this is bad for silver!

Now, let’s go check on that SLV chart, we are looking at the hammer that formed on the last bar, which is this week…

Turns out the breakdown so far has turned into a reversal back higher, because the best bet is support and resistance will hold.

SIGN UP FOR UPDATES

NO SPAM, EVER!