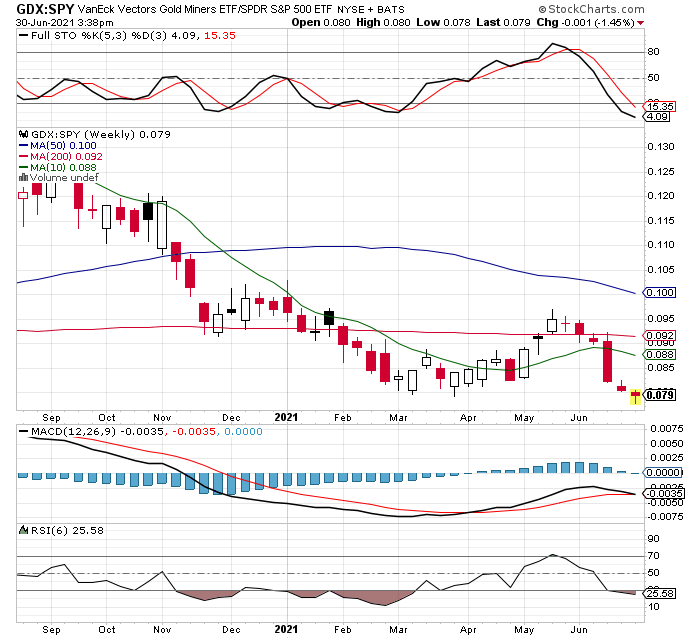
I like to take a step back and examine ratio charts on occasion. They can give us a broad sense of what to expect with one group of stocks vs another. Let’s take a look at the GDX big-cap miner etf vs. the S&P 500 etf (SPY). Here is a weekly chart, suggesting that for at least the next 6-10 weeks, GDX should outperform the SPY etf on a relative basis.
GDX about to outperform the SPY soon?
Of course, nothing is guaranteed, but I like to have charts like this on my side. It might not play out like this, but it looks as if the GDX is going to do better than the SPY, and the only thing I don’t like is the MACD is turning negative. So what does that mean and how to I factor it into my trading? I temper my expectations when some indicators are in conflict with others, so while I think GDX will do better overall for the next couple months, I also realize the outperformance might be tempered somewhat, since the MACD is just starting to probe the downside. Note the RSI is also into oversold territory now as well, so Im thinking the GDX won’t likely go down much more than the S&P500 in the near term, and the GDX might go up much more than the SPY. If I wanted to trim some holdings after the FOMC announcement recently that crushed the metals and miners, as many people are looking to do, I would still be waiting for a setup like we see in the chart above. There is usually a better time to exit than in panic mode caused by news events, and now we are getting that window of opportunity to sell something soon, if that was out intention (it’s not mine, but many are now afraid the fundamentals have changed so want to sell some). I don’t think the fundamentals have changed at all, I also don’t think the story from the FOMC is changing at all, other than to manage expectations, pushing on this side for a moment, then pushing on the other side a little, in order to try and sail straight!
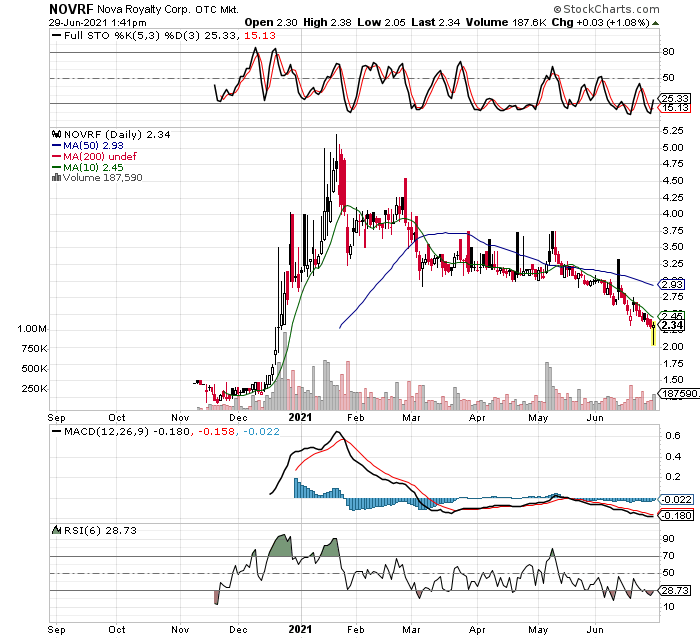
Yesterday I posted that I was looking to add to NOVRF (Nova Royalty Corp) and UROY (Uranium Royalty Corp). I intended to add to NOVRF before the close of trading, but had internet problems in the afternoon and wasn’t able to access my accounts, charts, or other tools I use, so I just packed it in for the day. Turns out it was good luck, as the NOVRF shares I’m buying are about 4% cheaper today. I like discounts, so maybe I got lucky, but we won’t know until we see where the stock is next week! lol
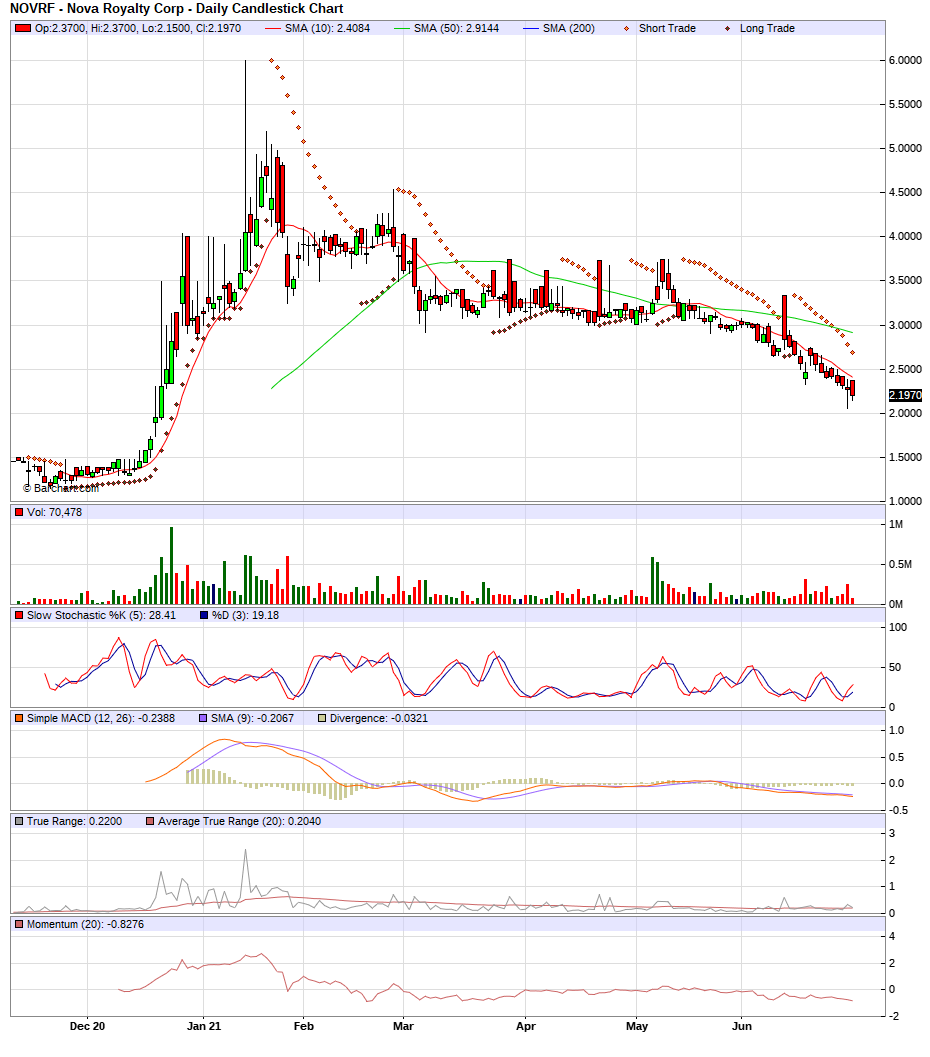
To know my overall position sizes, buy prices, and unrealized gains and losses, just check the link in the side bar. Not many will post their real numbers, and I shouldn’t have to tell you why that is the case, when all they want is to prove they are credible. Its simple, if you expect somebody to believe your claims, and have a simple way to prove your claims, such as account and activity statements, there is no reason at all that these “gurus” should not post their statements! Forget crying about privacy, a newsletter writer is asking for your trust and has an easy way to justify it by posting their transactions, so there is no justifiable excuse to do otherwise. Here is the latest daily chart on NOVRF, and yes, it looks ugly. I am not sure I will make money on this trade or not, but it really doesn’t matter, all that matters is my accounts make gains overall, over longer periods of time. This attitude and sentiment allows me to have room, while I wait for a trade to do its thing, and hopefully put some money in my accounts!
Added to NOVRF position today, funny how it looked better yesterday!
In my prior post I addressed the Uranium stocks and the URNM etf. I now see that UROY (Uranium Royalty Corp) is up 7% on the day, and NOVRF (Nova Royalty Corp), the copper and nickel royalty has turned positive, now up 2% on the day after being heavily red this morning. NOVRF has been in a strong downtrend after a phenomenal debut and run when the stock came public. I often look for reversal days like today to show some interest coming into the stock, a potential floor and turning point, which would be an ideal place to add to my position if that turns out to be the case. Until now I have only had a small starter position to keep me focused on the upcoming opportunity, which appears might now be close at hand. Lets look at the chart of NOVRF, we already talked about UROY in recent posts.
Turning point for NOVRF, note today´s candlestick and hammer
Note the reversal on today´s candle, from weak to strong all in a few hours. Also see the MACD about to turn positive, as the RSI is just coming out of oversold. I prefer the COPX etf(copper miners) looked more similar to NOVRF, which would lend even more credibility to this setup, but NOVRF being a relatively new issue is excused from some scrutiny as it can march to its own tune for awhile until it gets more seasoned. In this case, its own oversold technicals in stochastics and RSI, combined with the strong reversal candle, are enough to step into more shares of this copper royalty play. Bonus, NOVRF is also oversold on the weekly stochastics.
Verify my buys and sells, prices, position sizes etc in the link on the side. There you will also find total position sizes, not just the recent size of buys or sells, and unrealized gains and losses and totals invested.
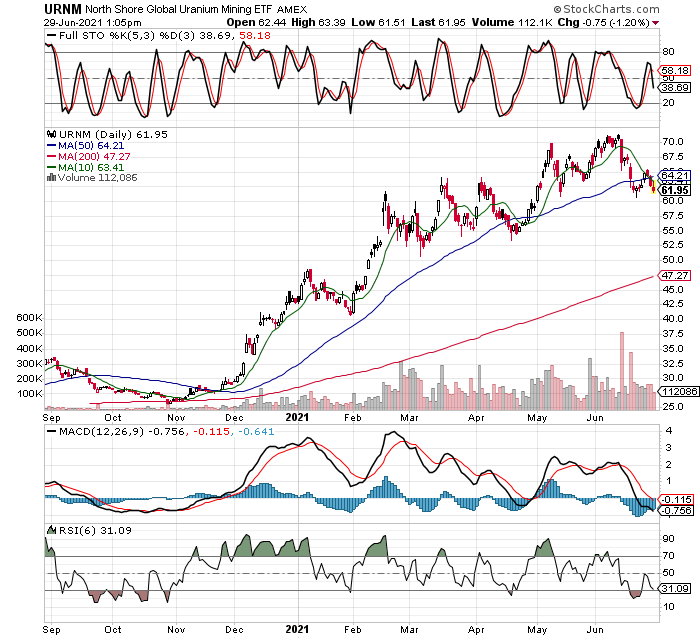
I still need to be patient for a few days at least, but the uranium stocks vs the URNM etf are coming down nicely to an area I’d like to start buying some new ones, and possibly adding to my UROY (Uranium Royalty Corporation). I’m willing to buy URNM, and CCJ (Cameco), DNN (Dennison Mines), URG (UR Energy), and possibly a few juniors as well. The stochastics on the daily chart I posted are not quite oversold yet, but getting there. I prefer to see the stocks “wash out” in a one or two day drop, in order to get some good fill prices.
URNM etf pulling back into buy area soon
I already was long CCJ LEAP calls for a nice profit that we realized, so am looking to get back on the bull again with that one and a few others, now that its a confirmed longer term bullish uptrend.
On a further decline, I stepped in and added more LEAP call options on the SILJ Silver Junior Miners eff. I like adding to winning positions when they pull back, I already have a lot of SILJ, so check the link on side bar for total holdings and average buy prices. The LEAPS I chose are the $15 strike price that expire in Jan 2023, so lots of time left on these. I will explain my position sizing methods in future posts, but I am always aware of my total risk (TR). Here is the chart, not much change from yesterday, but you will notice SILJ opened and went lower, before turning nd rallying to slightly positive on the day, now backing off a bit again. With the stochastics getting oversold on the weekly, I am expecting a turn higher soon, who knows, maybe today will mark the turn if the miners can build on this strength and close higher today?
Added to SILJ Jan 2023 expiry LEAP calls.
Also, I note Uraniums stocks are weak again today. I’ve mentioned I’m on the hunt for a few uranium miners into a pullback, they still have a little more to drop into my buy zone, but there are getting closer. I will put the URNM (Uranium stock etf) chart in its own post next.
Here is the daily chart on the Silver Junior Miner etf SILJ.
Added to the SILJ Jan 2023 LEAPs with strike price of $15
As always, check the side bar for account positions, sizes, and buy prices. Today I added to the SILJ LEAP calls, thinking this could be a false breakdown on the daily chart, being the etf is well oversold on the weekly charts now.
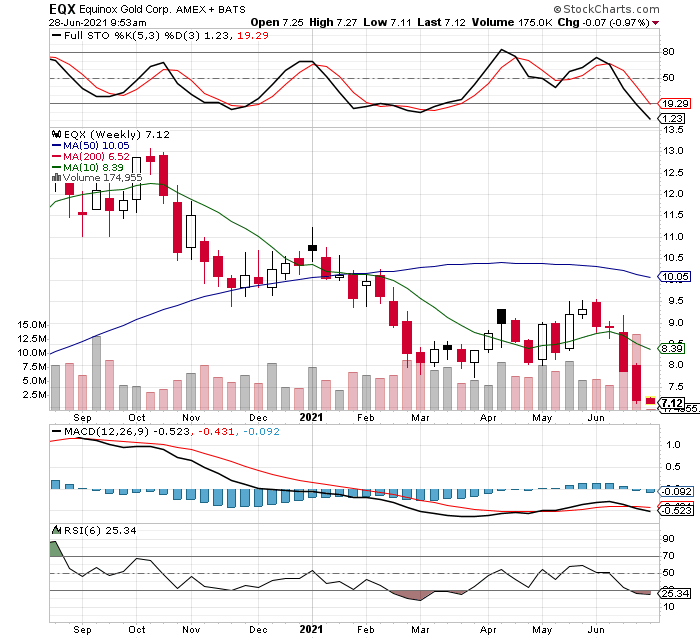
I posted the daily chart a few days ago, but here is the weekly chart of Equinox Gold (EQX). Note the stochastics getting oversold, it should only be another week or two before a rally starts, though keep in mind this one is news driven at the moment. I’m not worried, I think the superb fundamentals will outweigh the short term negative news of a blockade of one of their Mexican mines. I added to the my LEAP call options that expire in Jan 2023, with a strike price of $7.50.
Going through my charts this weekend, I noticed that the KWEB etf is shaping up nicely on various time frames now. Even better, its the longer time frames that are showing the best opportunity. I am drawn to this because its the long term plays that often give us an opportunity to add to winners and really press for larger gains. At times we get lucky and can stay in something over a year, dropping our taxes to the long term capital gains rate, far less than regular income tax, however we should never make a trading decision to stay in something on that alone. Its just a bonus when it happens!
So let’s re-visit KWEB, but this time use the weekly and monthly charts. Suffice to say, this is one I will look to add to my position, and as always, I will let subscribers know each step as i take it. First, the weekly chart.
KWEB WEEKLY pulled back to old resistance, now support
Nice chart, just wait until that MACD crosses higher, we could be off to the races, though we must have patience and let it do its thing until then. The gains can come quick once they start, lets be content to know we could be in the driver’s seat on this one. Now, let’s check the monthly chart.
KWEB MONTHLY, note the stochastics
On the monthly, we see the stochastics already well oversold, and possibly getting ready to cross higher and out of the oversold zone. These setups are never guaranteed, just like anything in trading, but our job is to take the trades as they present, with limited, fixed total risk. I have a starter position in KWEB LEAPS that expire in Jan 2023 (70 strike price), that could pay out multiples of my purchase price (check my accounts in the side bar), so this is something I will certainly be looking to add to in the future. I prefer to add into pullbacks, but will even add into strength if the pullbacks dont occur, just with less size. Keep in mind I will keep my overall total risk fixed, so the more I add, the less room I can give it on pullbacks. This is why I prefer to see it make some more gains before I get very aggressive.
While I’m already loaded up in precious metals miners, I decided to take a stake in one that is being driven lower on news of a blockade on one of their Mexican properties. It could be risky, but Equinox Gold (EQX) has several excellent properties and was one of the best performing miners in the recent bull, until the news of these illegal blockades by the indigenous tribes took hold. Its always tough to gauge the overall effect of such events, it could blow over relatively quick, in which case this decline turned out to be a gift, or if it blows up into something more serious, I will just have to stop out with my fixed, pre-defined risk. Because I expect this stock to be more news driven in the short term, I’m playing it through LEAP call options that don’t expire until Jan 2023 (7.5 strike price), rather than tying up too much capital in a more speculative idea.
Let’s take quick look at EQX, it sure looks ugly! But with fixed risk we can afford to try and capture what could be spectacular upside if anything other than the worst possible outcome occurs. As always, check the link on the side to see actual purchase dates and prices.
EQX bought this week
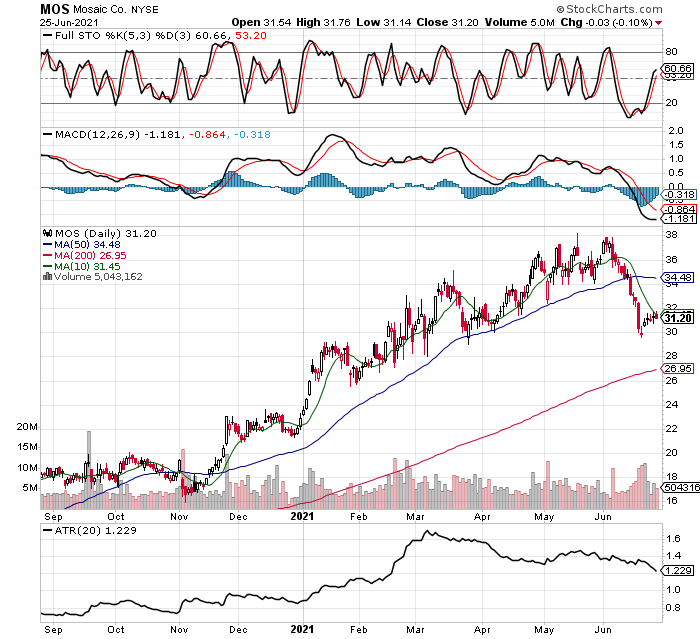
There are some other ideas approaching zones of action where I plan to buy, like some fertilizer stocks. Below I will show you Mosaic (MOS), but there are several others in the same group that might trigger a buy as well. I will let readers know when I buy, and what I buy, when I make my move. Agriculture stocks have had a nice run along with the whole commodity complex, and now many are pulling back, just what we are looking to buy into. There is almost always an opportunity setting up, if we keep our eyes open, and a level head. Here is MOS, I would love to pick it up down by its 200 day MA, but that might be wishful thinking, so lets keep it mind and see if sets up sooner for a good buy.
To get back into the habit of posting my transactions, I am updating my current holdings. Most readers know I have been focused on precious metals and their miners for the great macro-economic backdrop they have, with all the money-printing going on the last several years. However, I am always active and willing to take any trade signal in just about any group that presents one. Today I want to show a few charts of other holdings I have outside of the mining sector.
Let’s start with the big Chinese internet companies, like Baidu, Alibaba, Tencent, etc. These are basically the Google, Amazon, and Whatsapp of China, the biggest and the best in Asia, well-represented in the KWEB etf. From the chart below, you will see it’s already had a huge correction, something I want to buy as long as the fundamentals are still positive. Short term concerns of government crackdowns and controls aside, the fundamentals for these companies remain quite strong, so the question is when to buy?
About the only thing I don’t like on this chart is the breakdown below the 200 day moving average, and the “death cross” where the 50 day MA has crossed below the 200 MA, considered a negative sign. In trading, we rarely get everything to line up perfectly, and the fact KWEB has pulled back a substantial 33% is enough for me to go ahead and take a trade with limited size and total risk, as always. This is a daily chart, but as the trade is just starting to work out, in future posts I will cover longer term charts (monthly bars) and the potential hold time I expect for this position. For now, I’ve only purchased LEAP call options on this one to limit my total risk, and as its just starting to head higher, I will look for areas to add to the position as I don’t expect to close this position for at least several months if it continues to work in my favor.
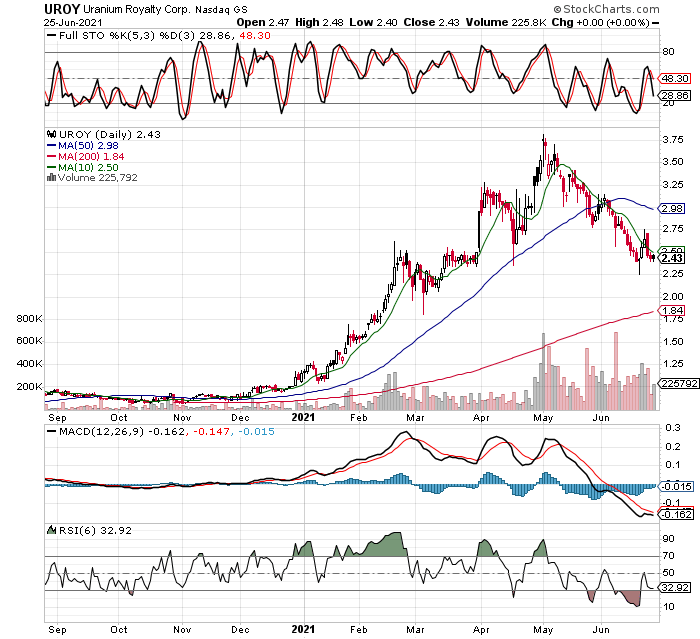
Now, let’s take a look at another newer holding, Uranium Royalty Corp., symbol UROY. The stock and its group of uranium miners has been on fire this year, and like KWEB above, has had a nice correction of around 35% off the all time high just reached in early May. I have taken a larger position in UROY already, since the stock is in a firm uptrend, the 50 MA is above the 200 MA, and the stock is still above the 200 MA, all signs of strength. Also note the MACD is about to cross higher on the daily chart, and while I have not shown the weekly chart here, the stochastics are well oversold and also about to cross higher. I really like this simple setup, all one has to do is size their position correctly and let the stock go where it wants. As this trade starts to work i my favor, I am prepared to buy heavier while keeping my overall risk on the position fixed. This can only be done by having the stock rise and showing me a cushion of unrealized gains, in short it often pays to push winners for what they are worth. Of course, there are fundamental factors I consider in any trade, but I will save those discussions for future posts.
There are many others I have to post, and other reasons for owning these positions besides just the chart setups, but I cover those in future posts, as my intention is to be more active here and report my trading decisions consistently. Its better for readers, but most importantly, its better for my trading. It keeps me accountable, and forces me to review my positions, reasons for owning them, stop levels to limit risk, etc. If a trade is truly justifiable, it should be easy to explain.
I will cover my mining stocks in future posts, and provide updates on some of the trades I have been in for awhile now, usually these will be winners where I am pressing for more gains. I will also cover some precious metals miners I am down on at the moment, including some that are close to my stop out point where I will cut losses if they hit that price. The key is to have our winners much larger than our losers, because we will all have losers at some point in our trading careers. We limit our risk, while opening up our upside, trying to keep it as simple as possible to follow. Please check the link to my current positions, including unrealized profits and losses, something most letter writers are not comfortable reporting, because most don’t make money from trading. It’s just a fact, if they truly made money, and are asking you for your money to get trade ideas, ethically they should provide you with copies of their account statements!