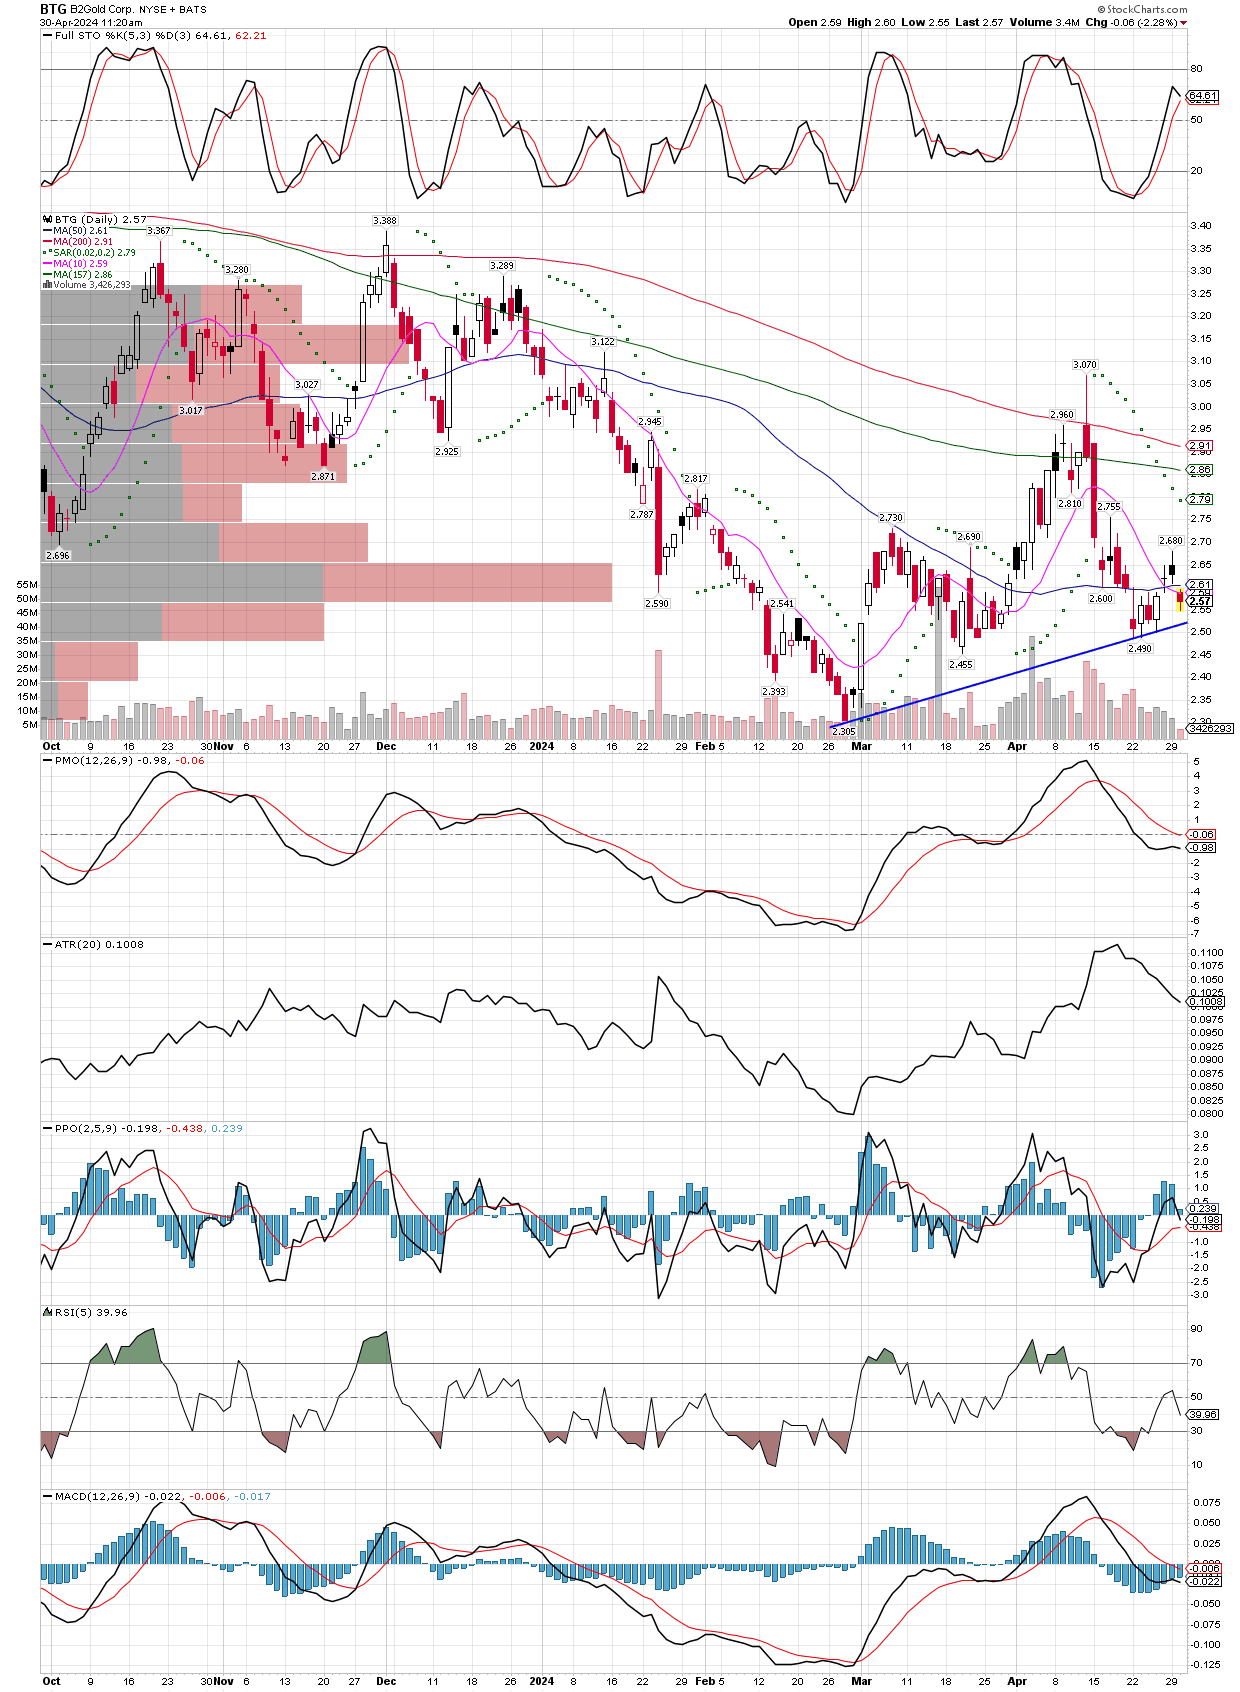
BTG is an example of a miner I will add to, I would have liked to see it bounce harder with the group when they were flying, but I think the 6.22% dividend is safe (and will grow), and the stock holds up better in big down days for the group, like we are seeing today. I likely will wait until tomorrow to add to our positions, as weakness like this can often extend into the next trading day.
Being metals and miners are in a bull market, as by the weekly charts’ (not shown here) week moving averages trending higher, I will look to add to positions as they pull back to their 10 WK MAs. Below is a daily chart with the zone between the two horizontal trend lines showing where I will be ready to add to PSLV (the Sprott physical silver etf), while the 10 WK MA is also in that range at $8.72 this week. PSLV and the miners have been rising so quickly that the 10 WK MAs are trending steeply higher, so next week I will adjust my entry prices to higher levels, likely in the area of $8.84 or so. Until then, we sit tight and watch how well metals and miners hold up overall, its been a fantastic run and there is a lot more to come.
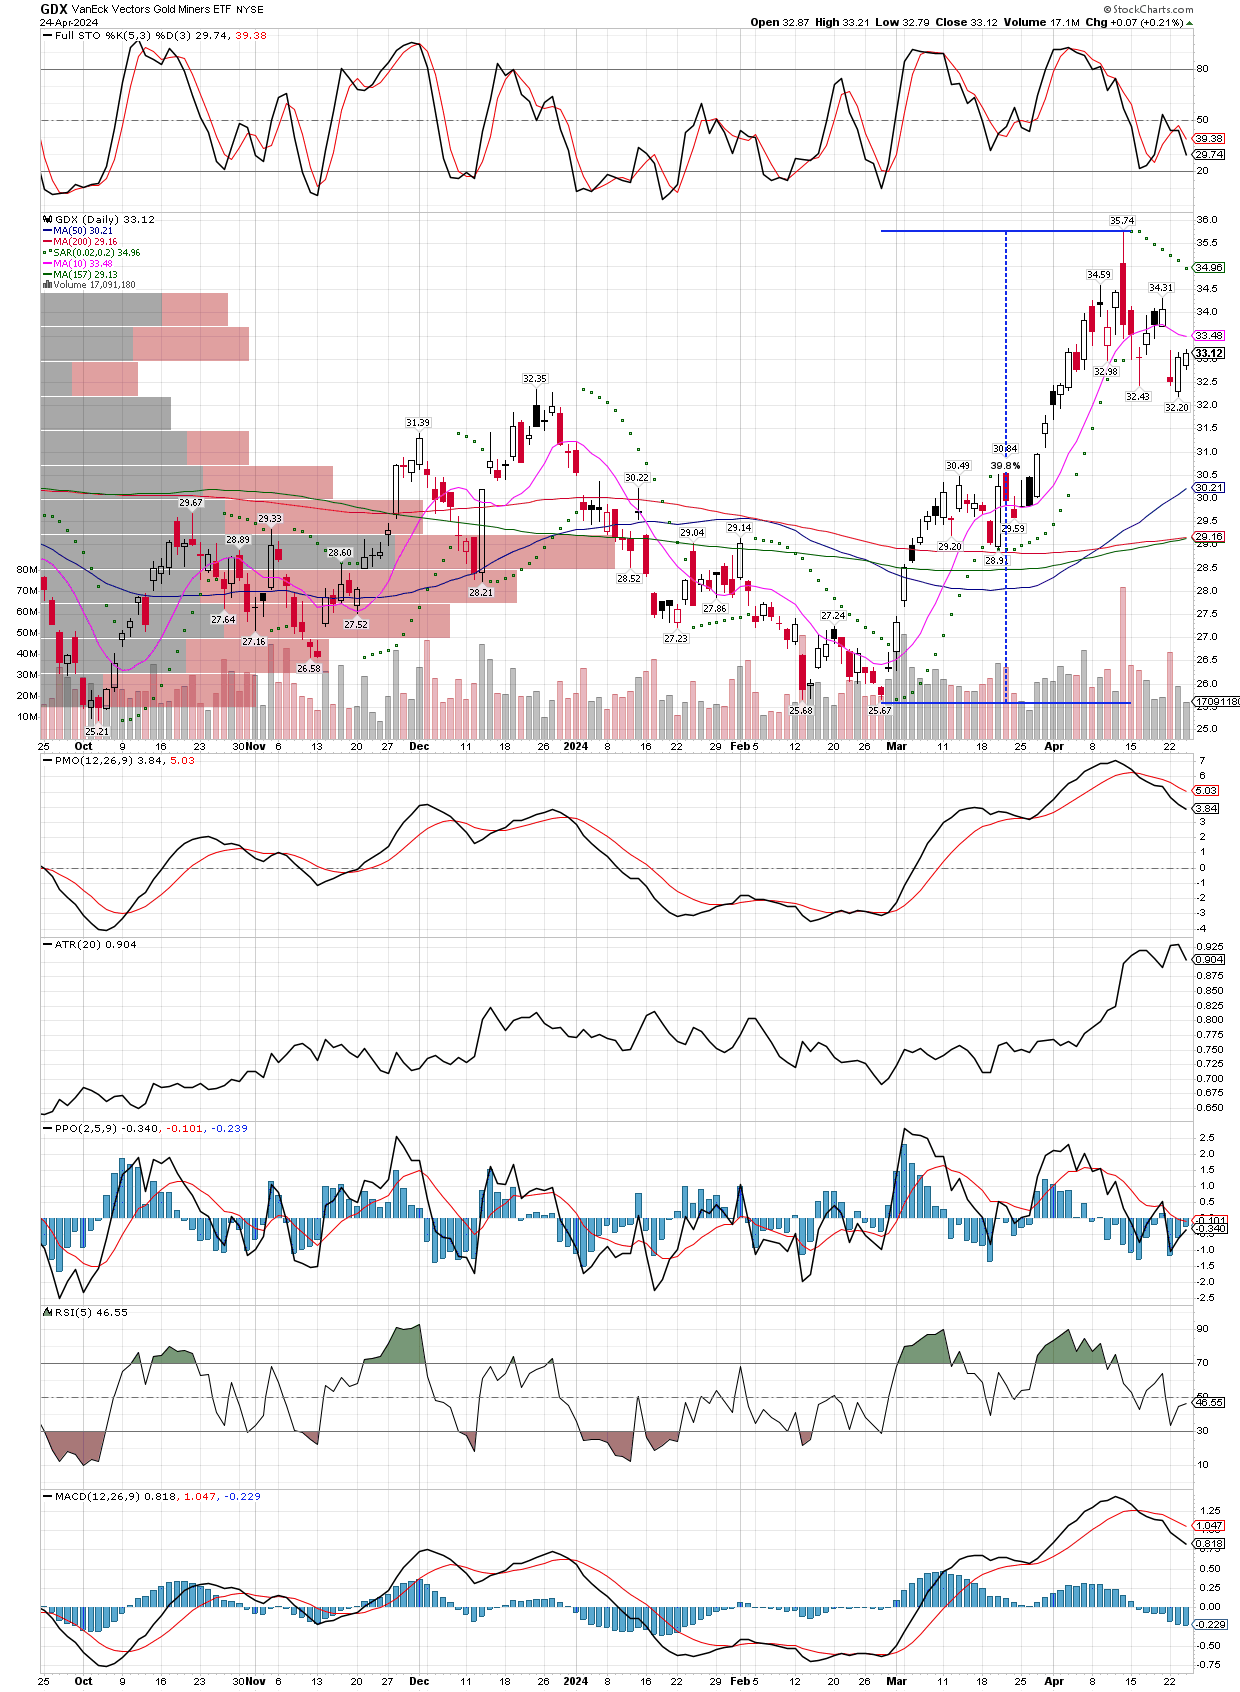
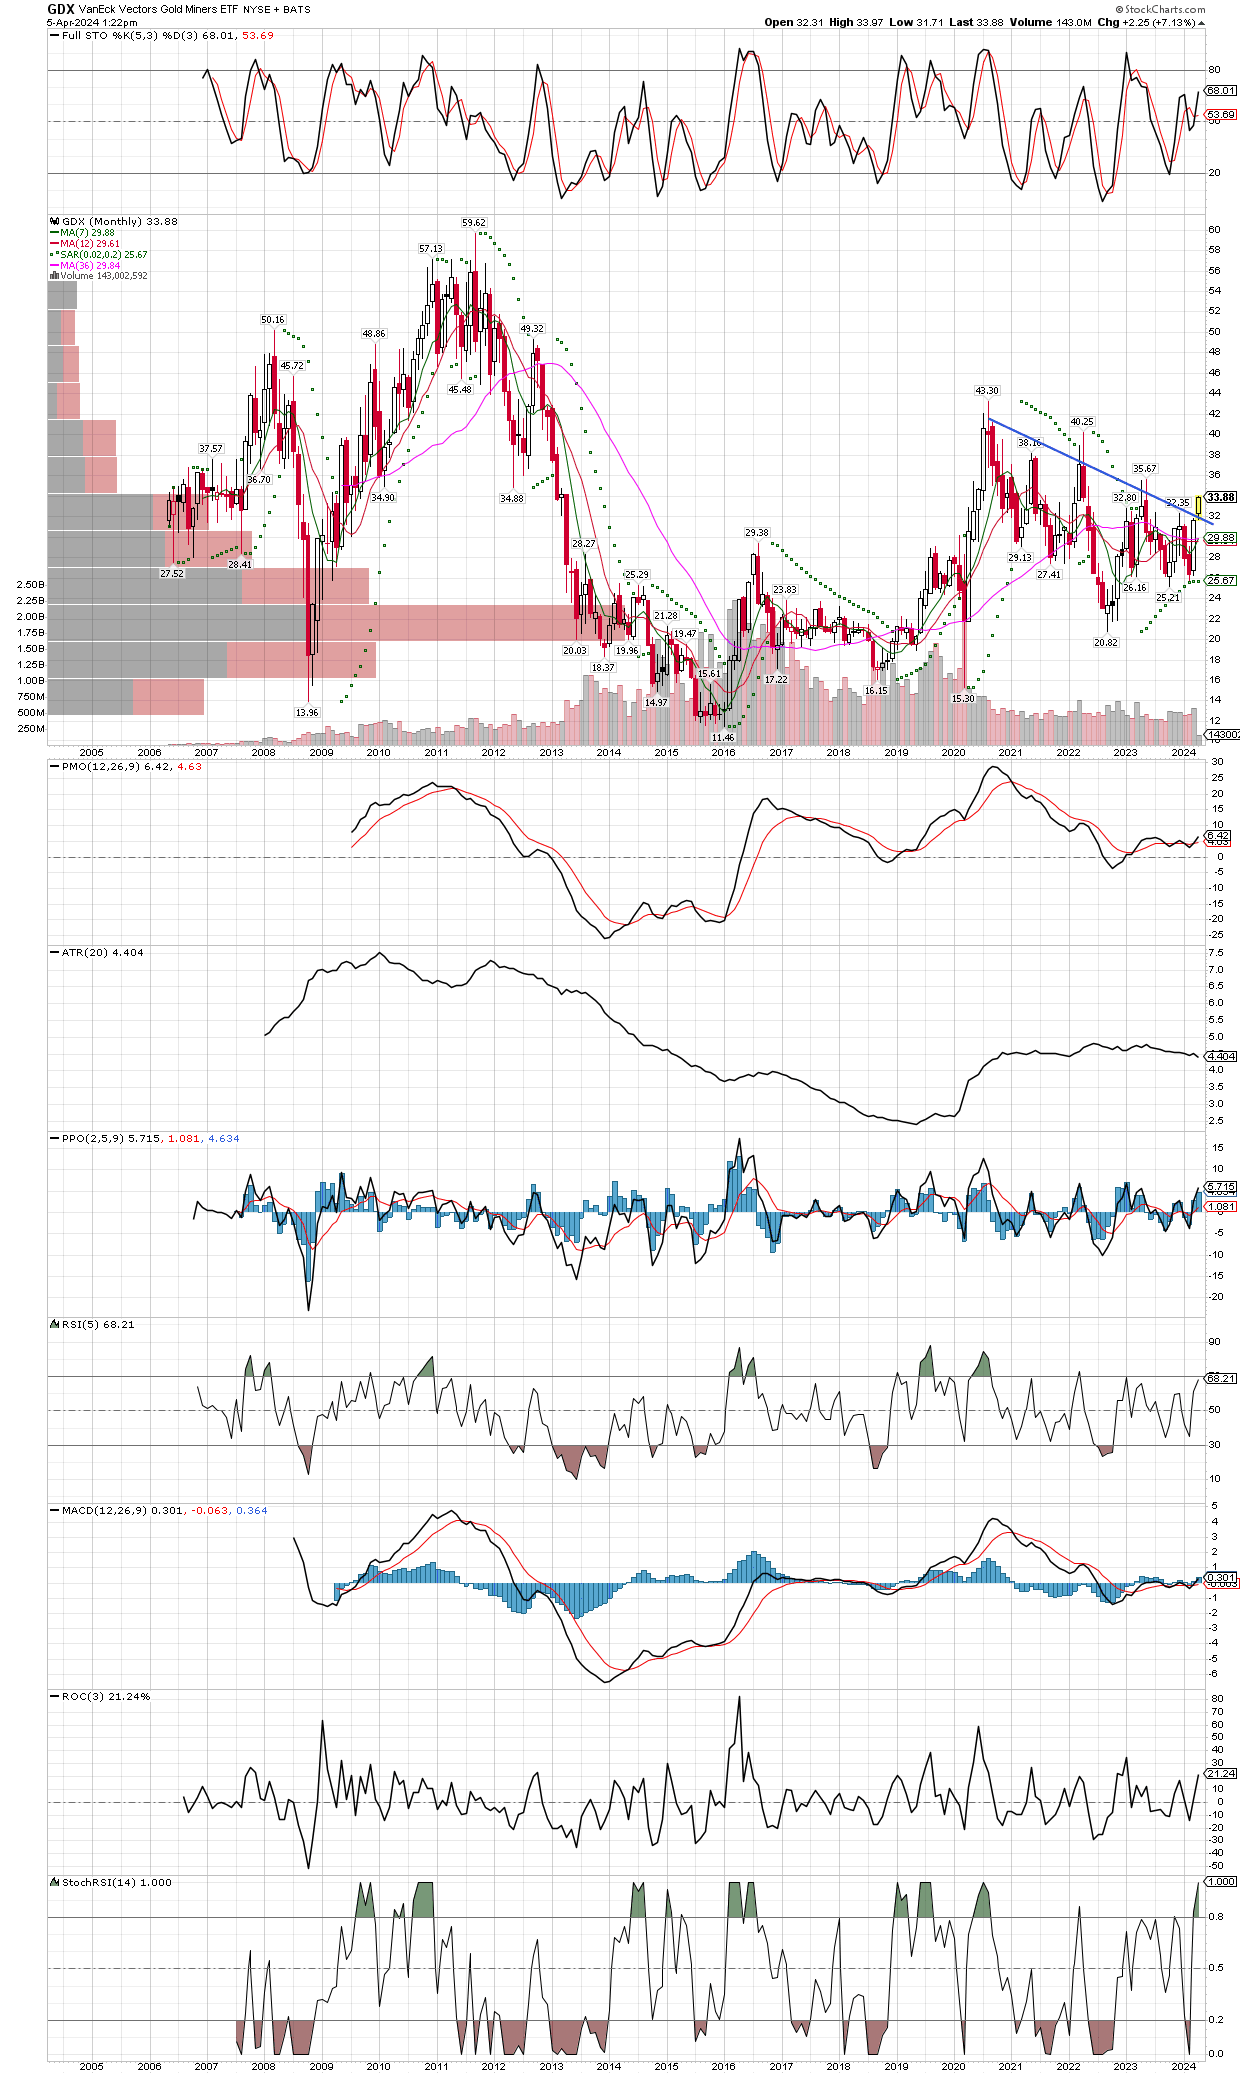
I keep hearing the same incorrect propaganda being parroted all over the mainstream media, and often by “professionals” that should know better. They drone on about how the miners aren’t going up while gold is rising, but I prefer to know the facts. Here is a chart of the GDX etf, large-cap miners that move the least/slowest with gold prices. Seems to me the etf is up 40% is seven weeks or so, since since the beginning of March. Gold isn’t up 40%, even though its performing well, too. Be careful what and who you believe in, look for the facts if you want to take money from the markets.
Keep in mind this chart is only the GDX, many mid-tier and juniors are up over 100% in the same time period. Somehow, this isn’t enough for those that only regurgitate what they have been told. They will wait until miners gain another 300% and prove they handily outperform the metals they mine, before they start to buy!
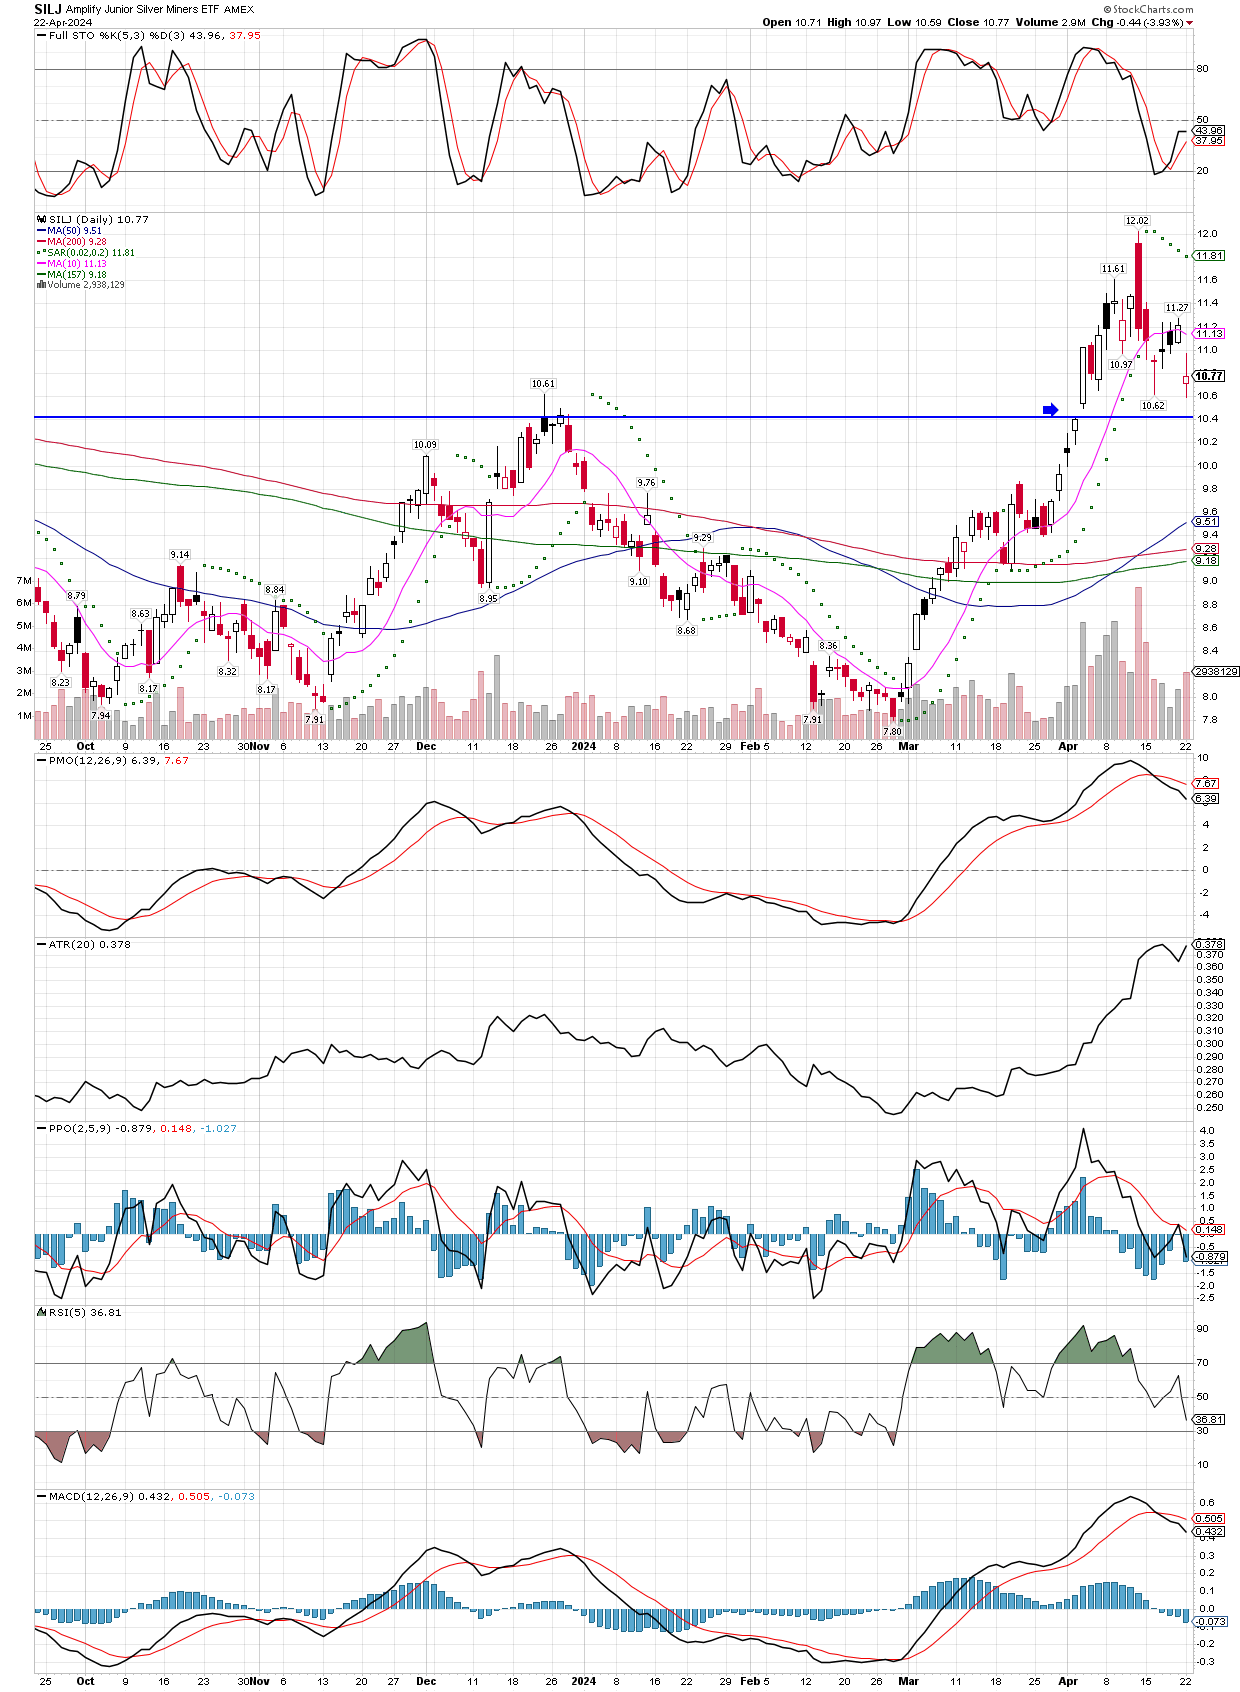
SILJ and the precious metals miners have started a correction. Let’s take a look at possible support zones, where it might hold, then begin to bounce. The upper horizontal trend line is just an estimate of where the 10 WK MA will be in two weeks, as it is gaining roughly 25 cents per week. The lower horizontal trend line is where SILJ’s 10 WK MA should be one week from today. I point this out because strong uptrends typically respect the 10 WK MA, so both those levels are areas I will look to buy, depending on how much time has passed before each level is visited.
Now let’s take a look at the daily chart, where the $10.40 level looks to potentially be important. That would close the gap created there back on April 3, but it’s also the area of older highs which now could act as support. Since the $10.40 number is relevant to both the daily and weekly charts, that seems like a good place for me to add to my position. If it drops below that quickly, I would expect to see the $10.18 level to be the next area of support, on the weekly chart. If the 10 WK MA will be respected in this strong uptrend, the $10.18 zone, should occur sooner (next week), rather than later (two weeks or more), because the 10 WK MA is rising so quickly now.
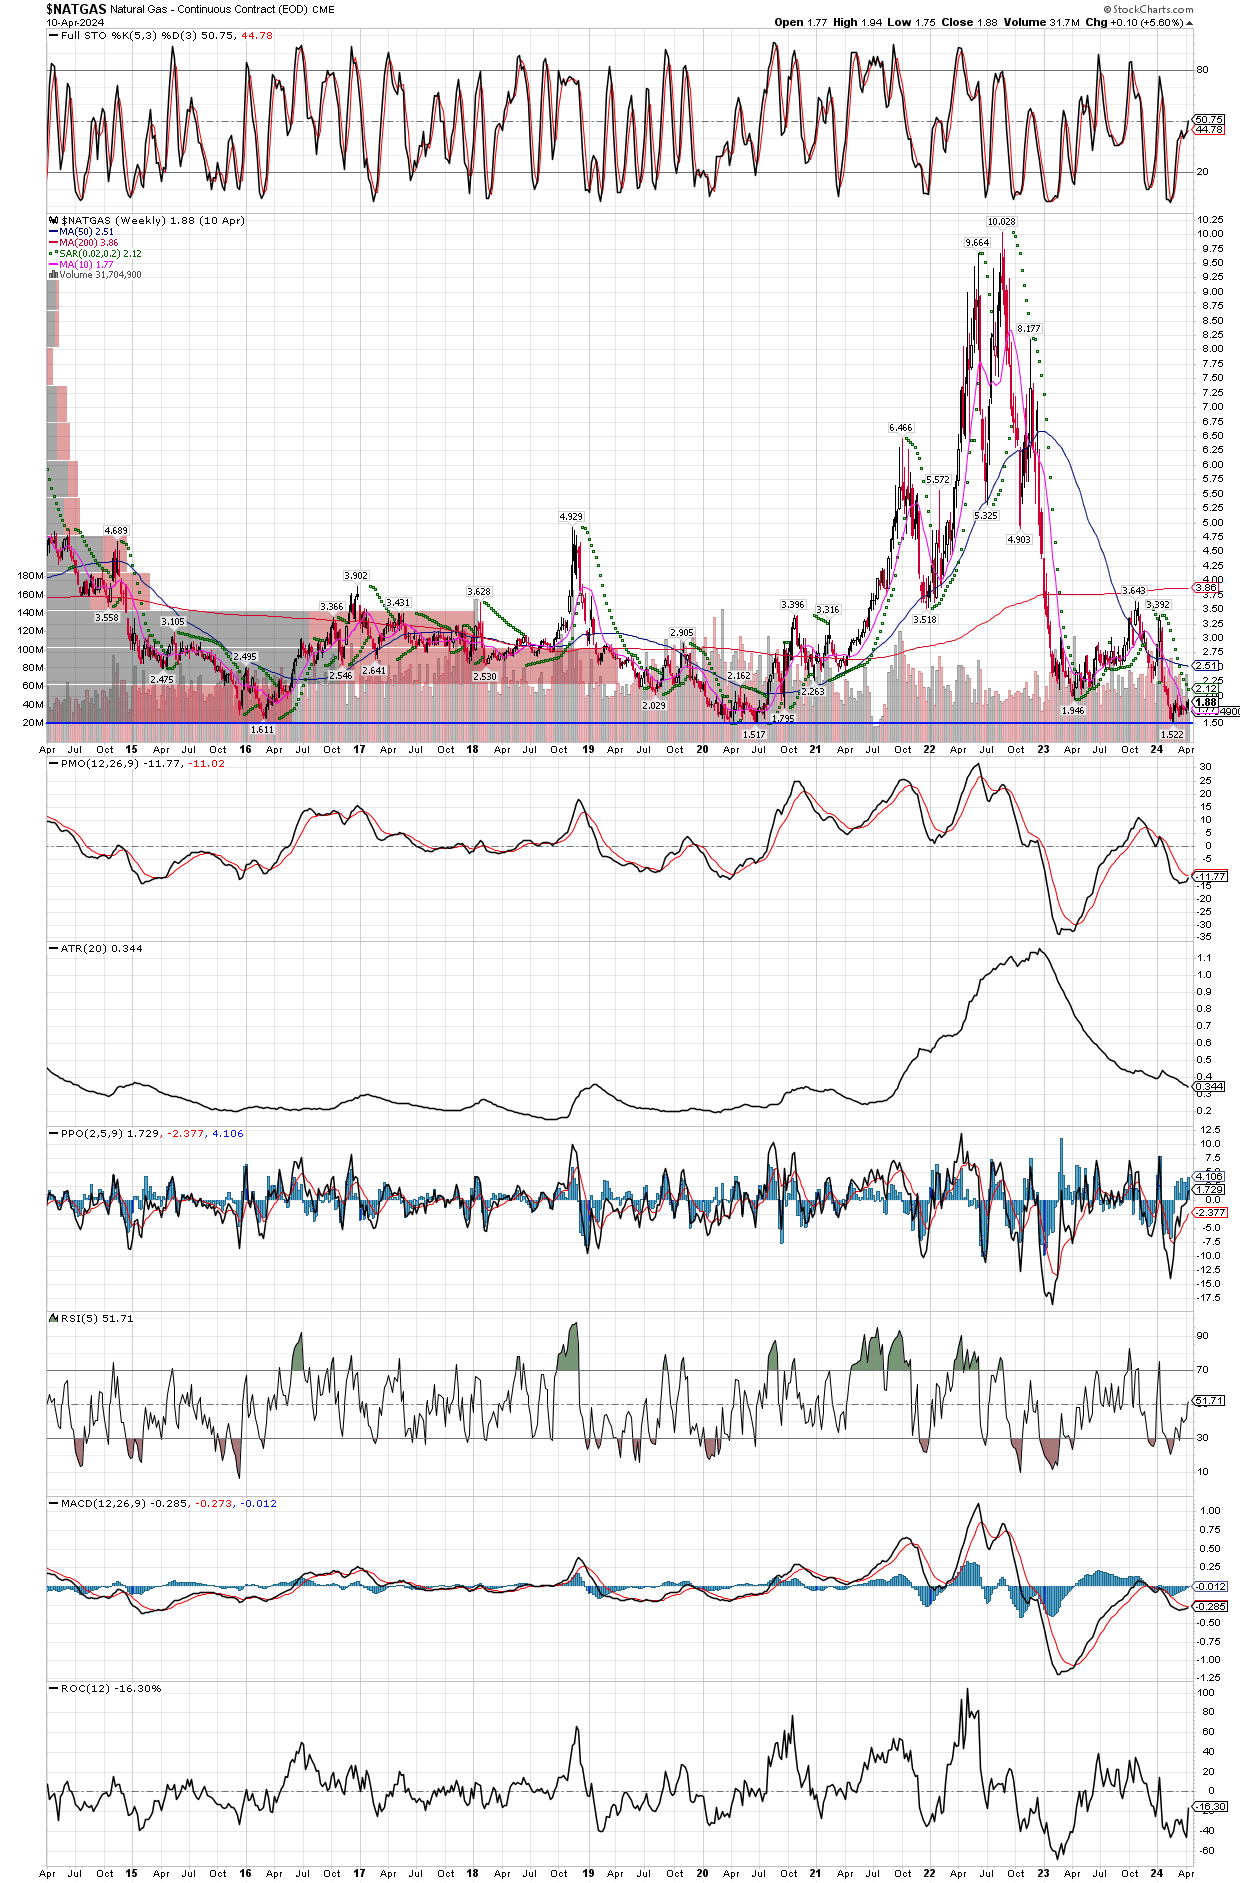
We were stopped out of our CT (cotton) futures. They went straight down both before we bought them, and after we got involved, trading down directly to my stop. It happens, and while I don’t like being wrong on trades, a trader and investor must honor his stops or it can turn ugly. We still hold NG (natural gas) futures, and since the price is rising, might soon get the signal to add our second tranche.
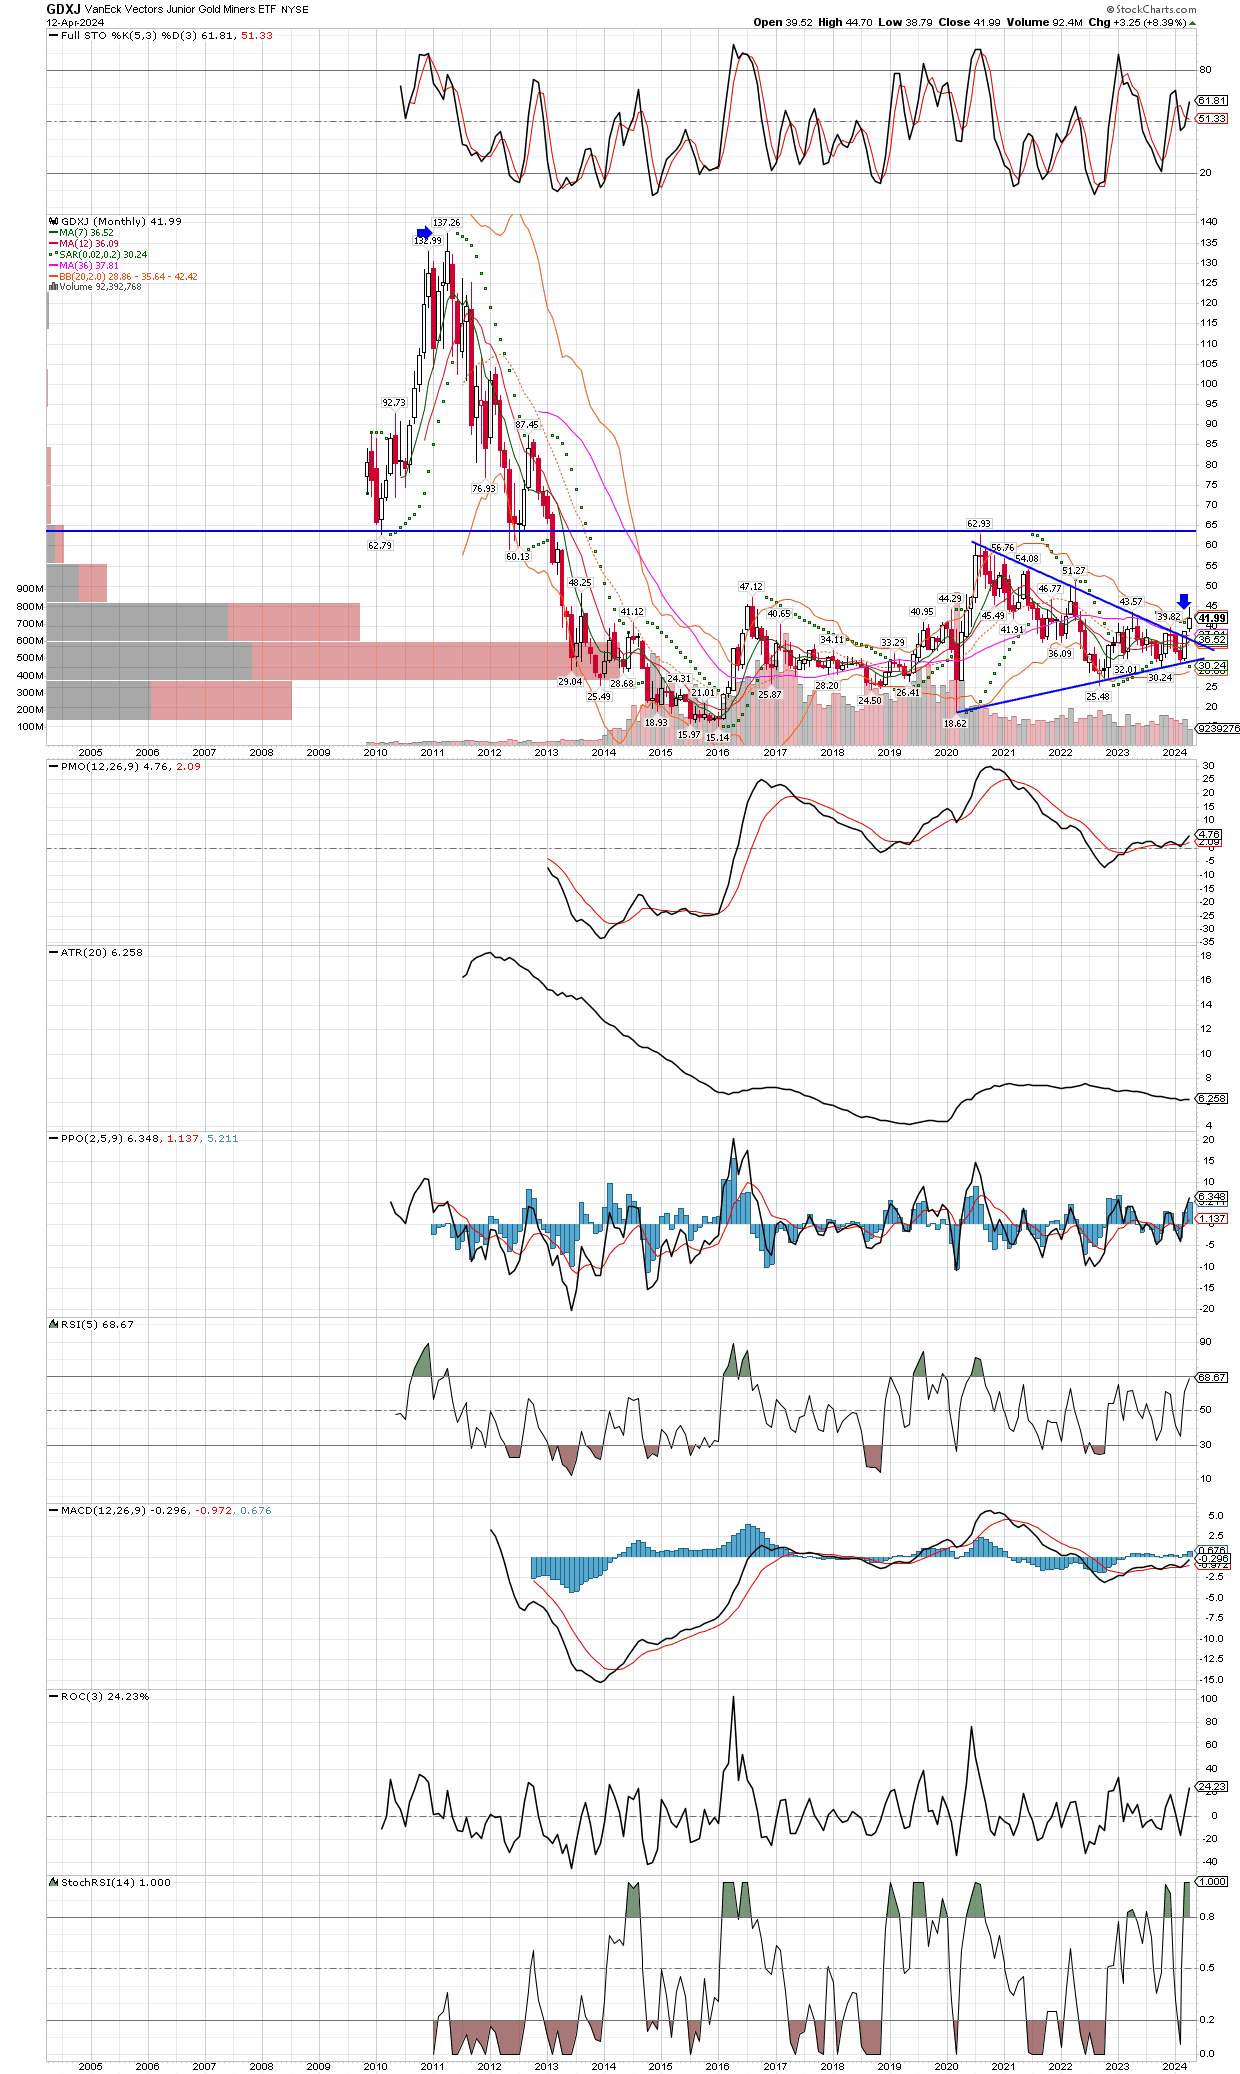
The long term monthly chart of GDXJ (junior miners etf) is shown below. Note the Bollinger Band breakout that just occurred this month, as well as the break above the downtrend line last month. It seems to me the horizontal trend line up around the $63 area should be easily obtainable, and possibly very quickly. After that level gets taken out, the Volume by Price bars overlaid on the left side of the chart suggest there is very little resistance on GDXJ’s journey to visit it’s all time high, which I see as highly likely in the next year or two. That would be gain of another 300% from today’s price.
Both commodities have been hammered lately, and natural gas not just lately but for the last couple years. Both also exhibit seasonal tendencies to rally from early April until end of May for CT futures (cotton), and late March until early June for NG futures (natural gas). Being inflation is running hot and the commodities bull taking another upswing in various products, combined with the lower levels of risk entering a position after such massive bear mauling as seen in the natgas chart below, I am comfortable starting position here in both natgas and cotton, and will look to add if they can turn higher, while keeping Total Risk (TR) fixed. These trades will likely be ones I take profits on after an intermediate term rally, rather than hold on and pushing the gains like I am doing with the metals and miners, bc right now its the metals’ turn to shine, while the energy and softs I think should rally but it will be capped due to the weakening economy. However, that could change and I push longer for larger gains, if something like the $USD starts to weaken and exert a downtrend.
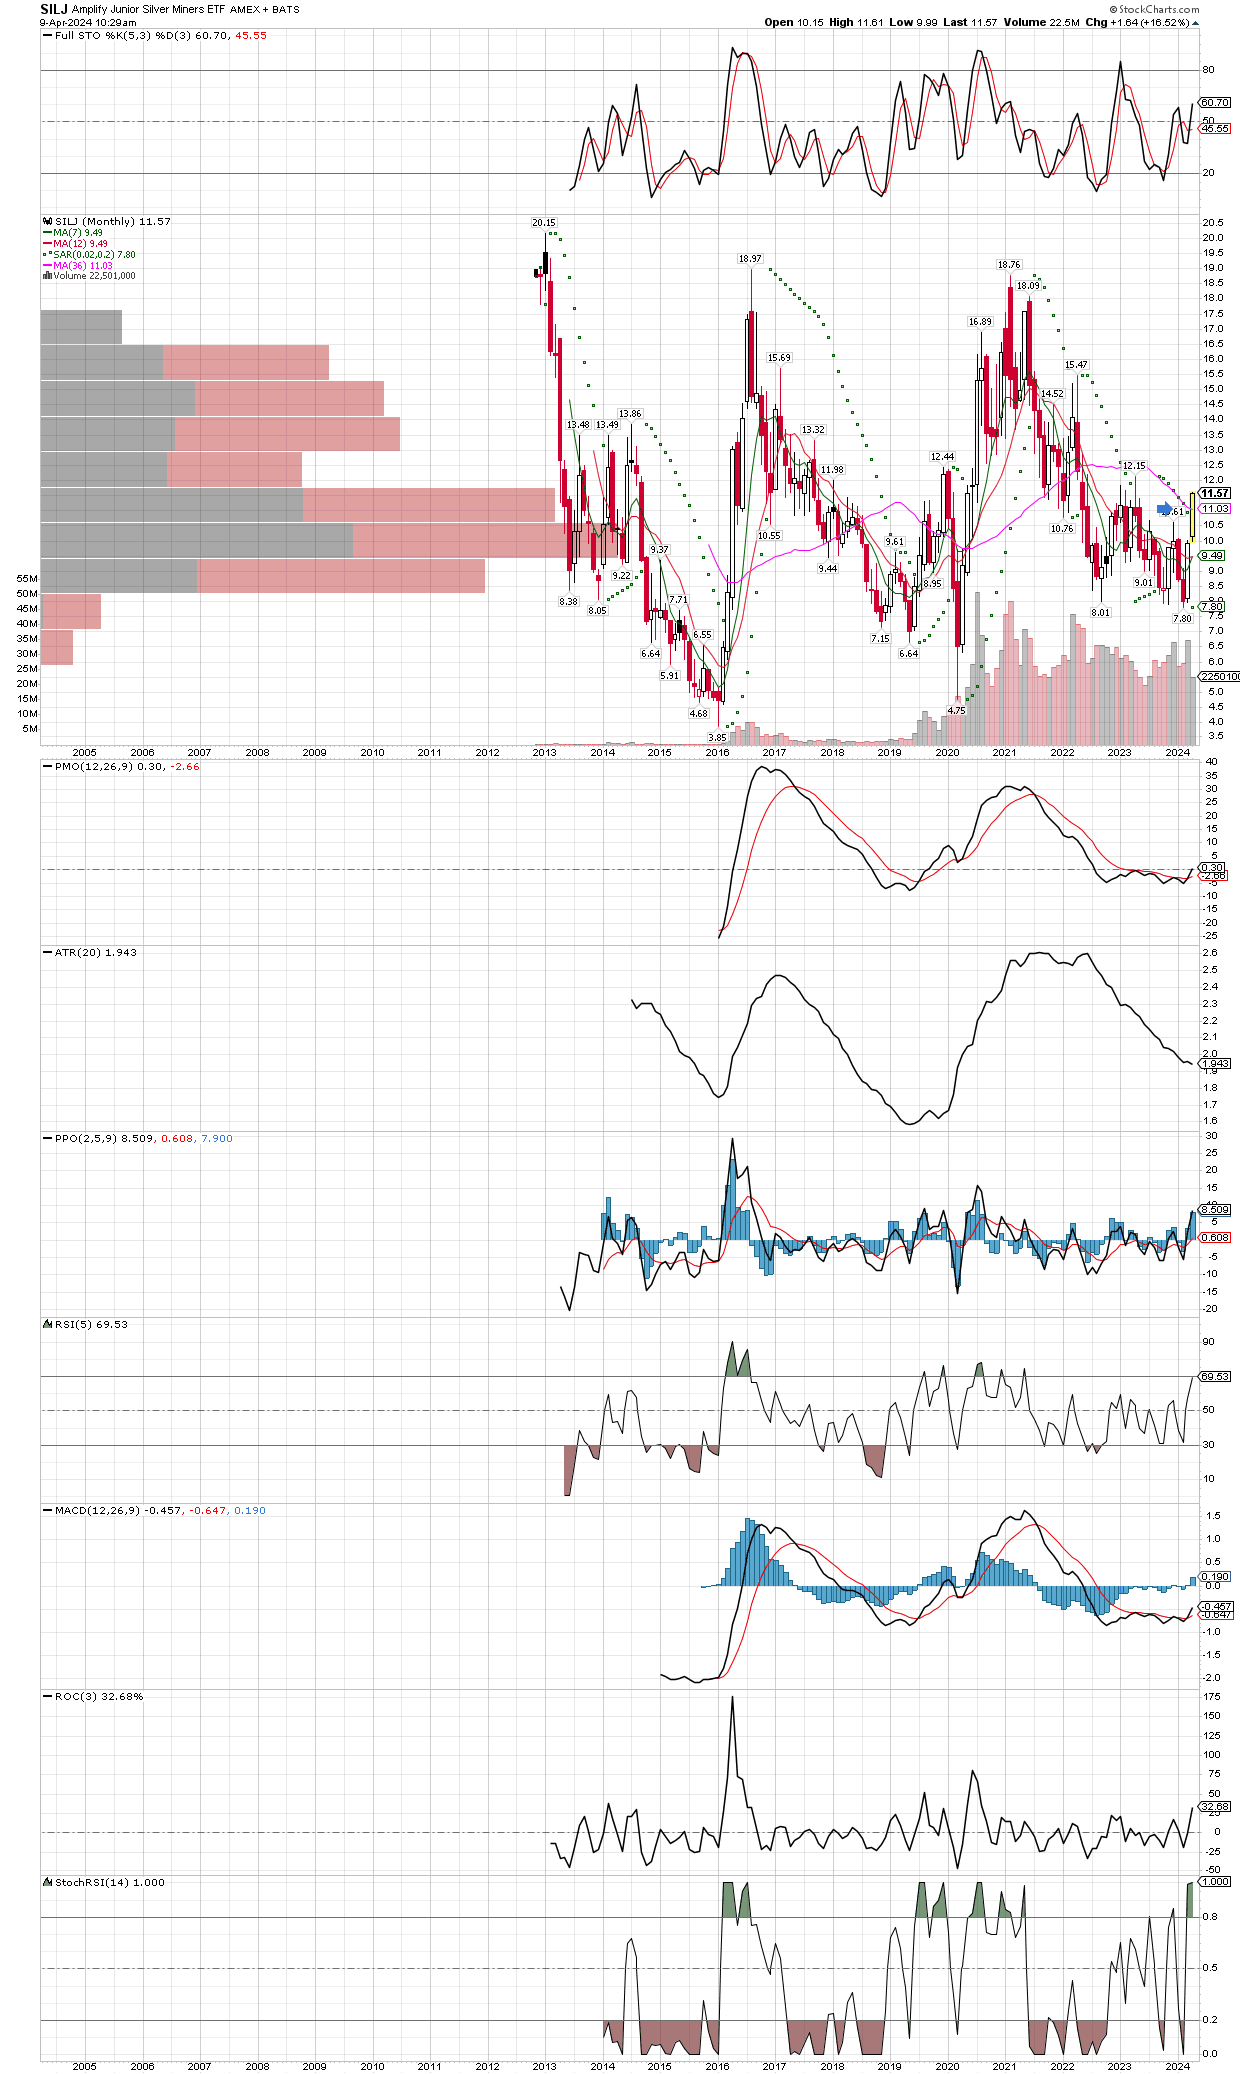
SILJ, the metals, and miners are all on fire again today. We are making huge gains near 4% on our portfolios nearly every day the last 6 weeks, often more than that. I am not surprised, and even added to MXROF, Max Resources is a junior explorer in Colombia with a potentially very large silver/copper/zinc deposit. Here is what the SILJ looks on the monthly chart, now trading above all the moving averages, still with plenty of upside potential! The miners make it difficult for late buyers to get in, as they wait on the sidelines for a dip that never comes, or when it does, it doesn’t last more than a day or two. Go back to my previous post on the rally that occurred in 2016, to refresh your memory.
In this chart I examine the sharp 2016 rally in miners, specifically the SILJ etf, so that we might know what to expect in a similar bull market move. The blue arrows are the rallies, measured as how far SILJ rose above it’s 200 day MA, while the red arrows mark the corrections that took place after the sharp moves higher. It seems that in 2016, SILJ would rally 105%-120%, before selling set in and it dropped between 20%-25%. Also of note, the worst corrections occurred near the end of that bull run, so maybe that will be the tipoff this time around as well. Notice the red correction zone that lasted about the entire month of May, and brought prices down about 24%, but only after SILJ rallied 120% above it’s 200 day MA, maybe something else we should be prepared for in this new bull market?
With SILJ currently sitting just 22% above its 200 day MA, the takeaway is that there is still lots of upside potential in this rally. Also notice how many times SILJ stretched over 100% above the 200 day MA, over the course of the 8 month bull run. I would encourage people not to take profits too soon, the miners rally so sharply at times that it’s almost impossible to get back in!
GDX has decisively broken the down trend established in 2021, and depending on how loosely one draws the trend line, it could be argued it started back in 2011 when metals and miners peaked. Either way, our accounts are up another 4%-6.4% today, as many miners make new bull move highs along with both silver and gold. On a side note, I started a position in Cotton futures yesterday that I will look to add to, if it can start rallying.
Just read his latest post on Twitter, so will add his updated take on gold and his projections. Make sure to bookmark his site and visit often, very useful and I have no affiliation or relationship with him in any way, I just genuinely like his charts for long term perspectives.