Recap for July 30, 2021

Today was the last trading day for July, 2021, and while not eventful, I always look forward to seeing the new month’s charts the following week, since longer-term investors use the monthly (and quarterly) charts to make new investment decisions. Professionals and big money will also try to “paint the charts” near month end, in order to influence the trading decisions of others. July is now in the books and done, let’s see how the longer-term charts look next week when they print. Silver was close to “make or break” time according to many analysts, while I don’t think the $25.50 level is a definitive line in the sand, to me we closed close enough to confirm the long-term bull market remains intact.

Today didn’t have anything outstanding to focus on, it was a pullback day after a strong day for our accounts yesterday. I did take advantage of the weakness to add to a few names, and if one wants to check the intraday charts, they will see we got lucky on some of our buys today. We bought the afternoon pullback which turned out to be good timing, as miners turned higher not long after our buy orders were filled. The hourly action is not overly important to traders focusing on our time frames (usually weekly and monthly signals), but it’s always a welcome edge to find our accounts heading higher not long after we get out buy orders filled. 🙂

Looking to next week, I will focus on opportunities to add to miners since it appears the group is trying to turn higher. We also have some seasonal tendencies that should start to support the sector near term. I’m expecting to see a move higher lasting several weeks at least, so it’s important not to sell too early into the move up, since we cannot know yet how strong or far the stocks will run. I will look to add to anything I have added to recently, and focus more on things like the GDXJ etf LEAPS, or my most recent additions being stocks like HL (Hecla Mining), and the junior copper/gold explorer Freegold Ventures. I will also look to get heavier is my biggest winners like MGMLF (Maple Gold Mines), now bouncing off it’s 200 day moving average. Rather than drown you in charts, know that many look similar and therefor we can trade the miners as a group right now, however I will still try to add to the best in the group. How do I know which will be the best? I don’t, that is just being honest, but I will judge by the charts, or in the case of a news driven stock like EQX (Equinox Gold), the fundamentals and how they are changing in my favor. In short, when we get a strong move in a group it often hardly matters which stock we buy!

Just a few charts to keep in the back of your mind over the weekend. If one gets overwhelmed by how many stocks look like good buys, one can always look to a popular etf. This can hurt out upside, but also eliminates lots of company specific risk, like unexpected secondary offerings which dilute shareholders. I will try to add to GDXJ and maybe some of my newest buys as well, since I am not yet up to full-risk positions in stocks like EQX (Equinox Gold) and HL (Hecla Mining). I look forward to the new MONTHLY charts that will print on Monday, but the weekly charts for the mining sector continue to suggest they go higher for several weeks at least.

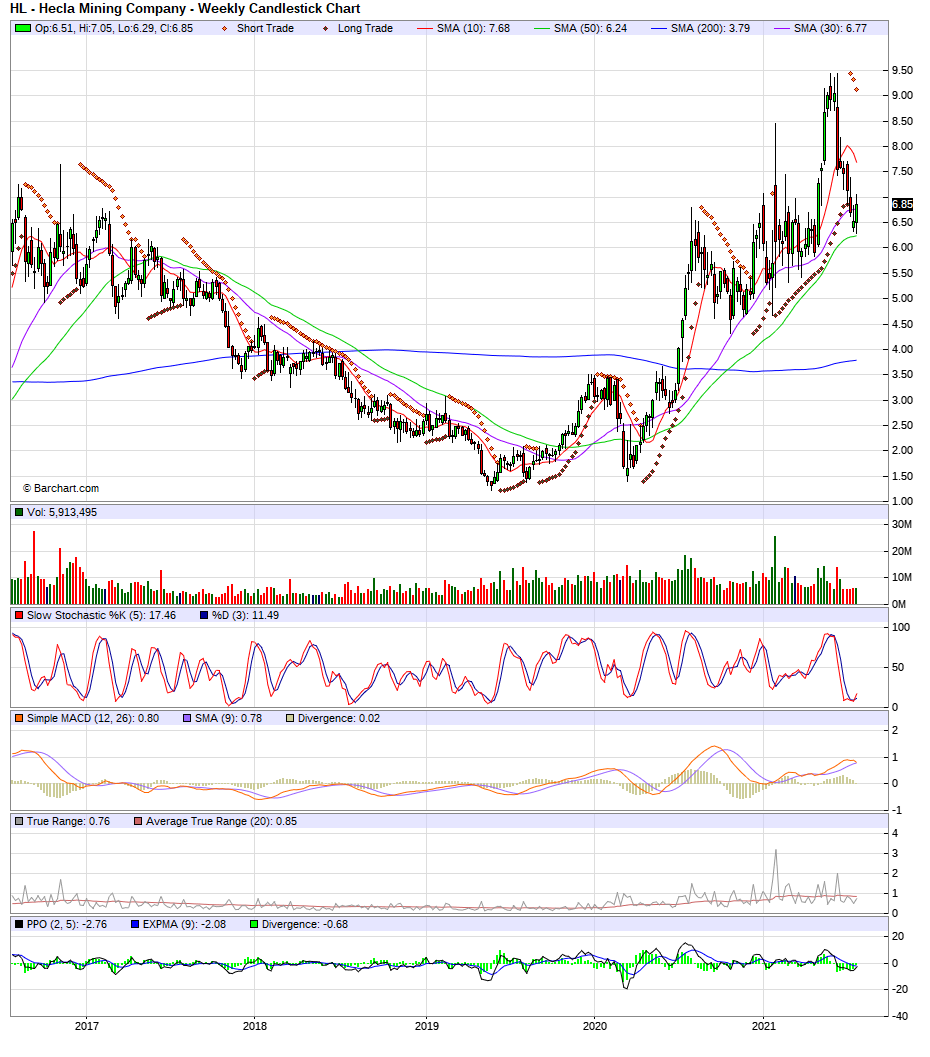
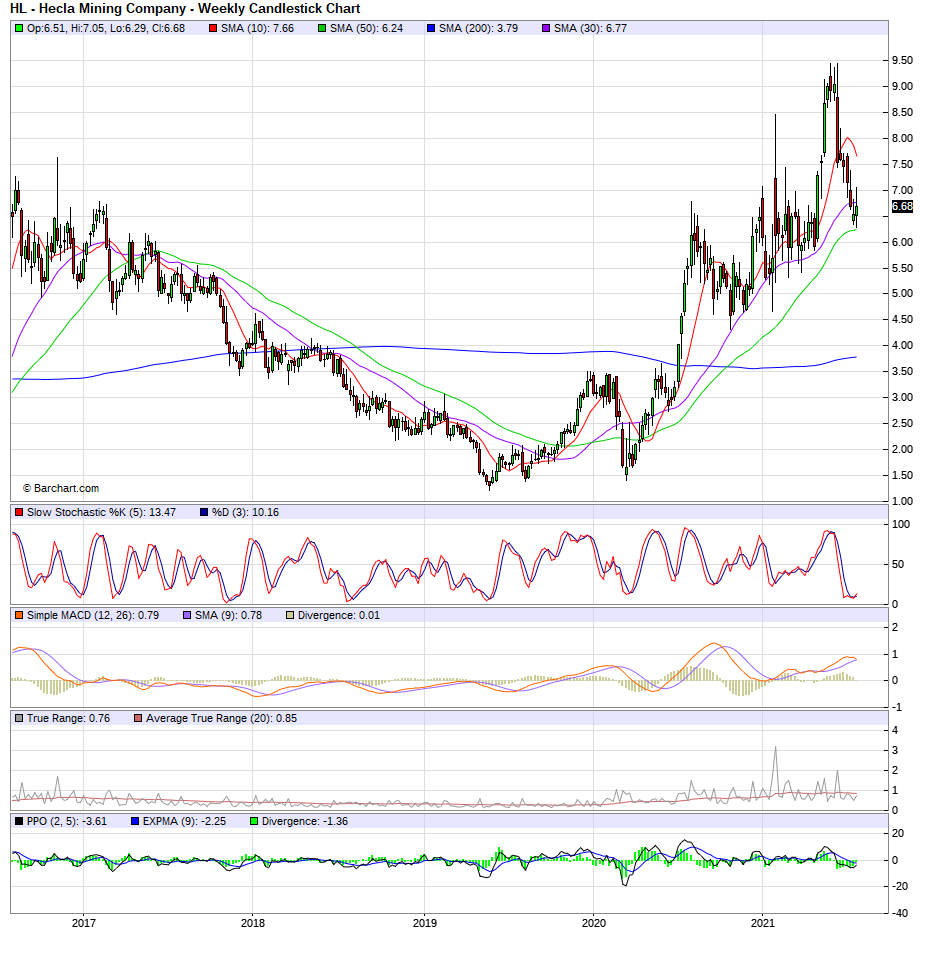
I added to HL (Hecla Mining) today, still looking to increase position up to full-risk. Here is the WEEKLY chart, nice and simple, oversold and at support.

Hecla Mining has oversold weekly stochastics as it sits on support going back to 2017

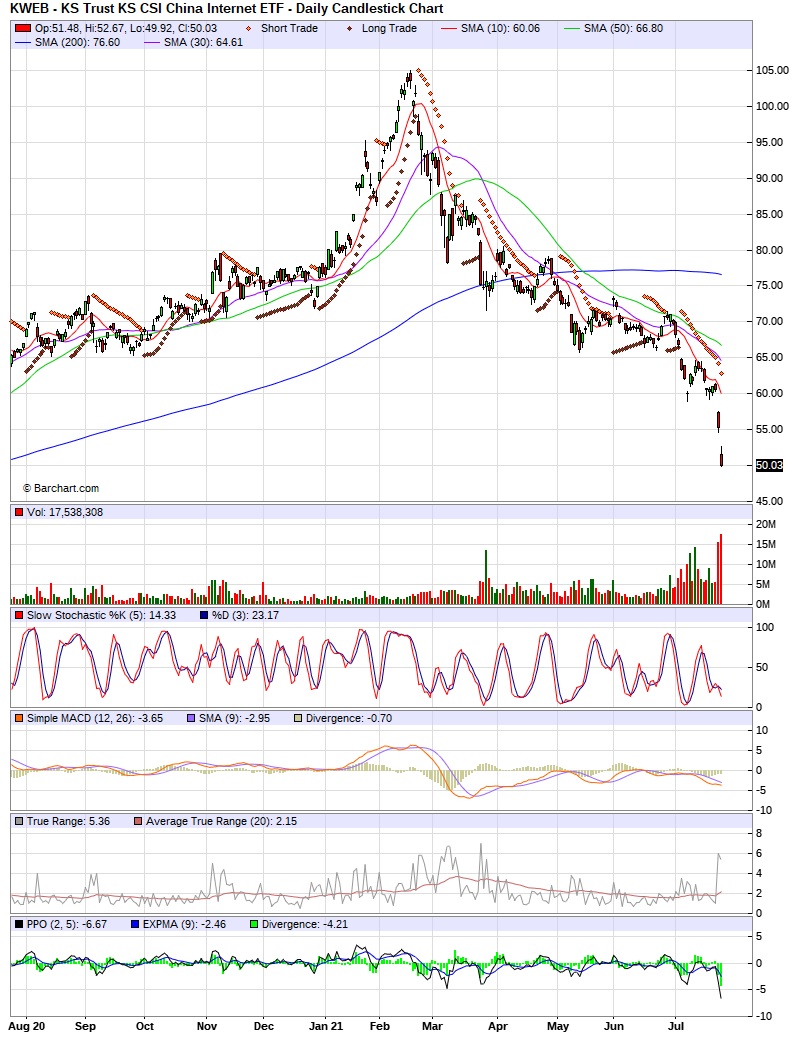
And the DAILY chart looks similar as far as sitting on support (200 day MA), though the stochastics are no longer oversold. In a situation like this, I’m often asked which is more important, the daily not being oversold or the weekly being oversold? I will always defer to the longer term charts as they have more history, more action that has created the longer term chart, however, I will respect the fact that the daily has already moved out of oversold and could be due to turn lower for a few days. I’m not predicting it goes lower, but when looking to buy or add to my position, I take this fact into account and try to buy with limit orders only, and maybe below the current market price. Basically, I am more patient with my buy orders when the time frames don’t match up perfectly. Here is the HL DAILY

HL DAILY- also sitting on support, but no longer oversold on stochastics. Still, I will patiently look to add to holdings.

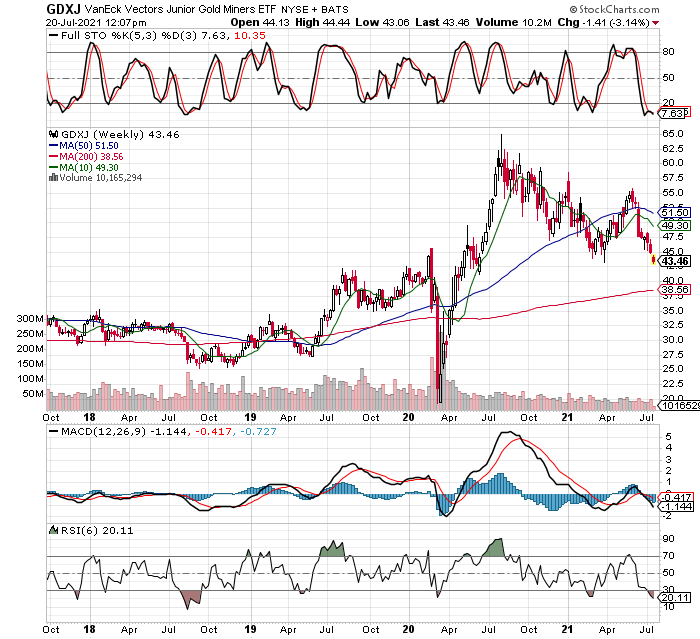
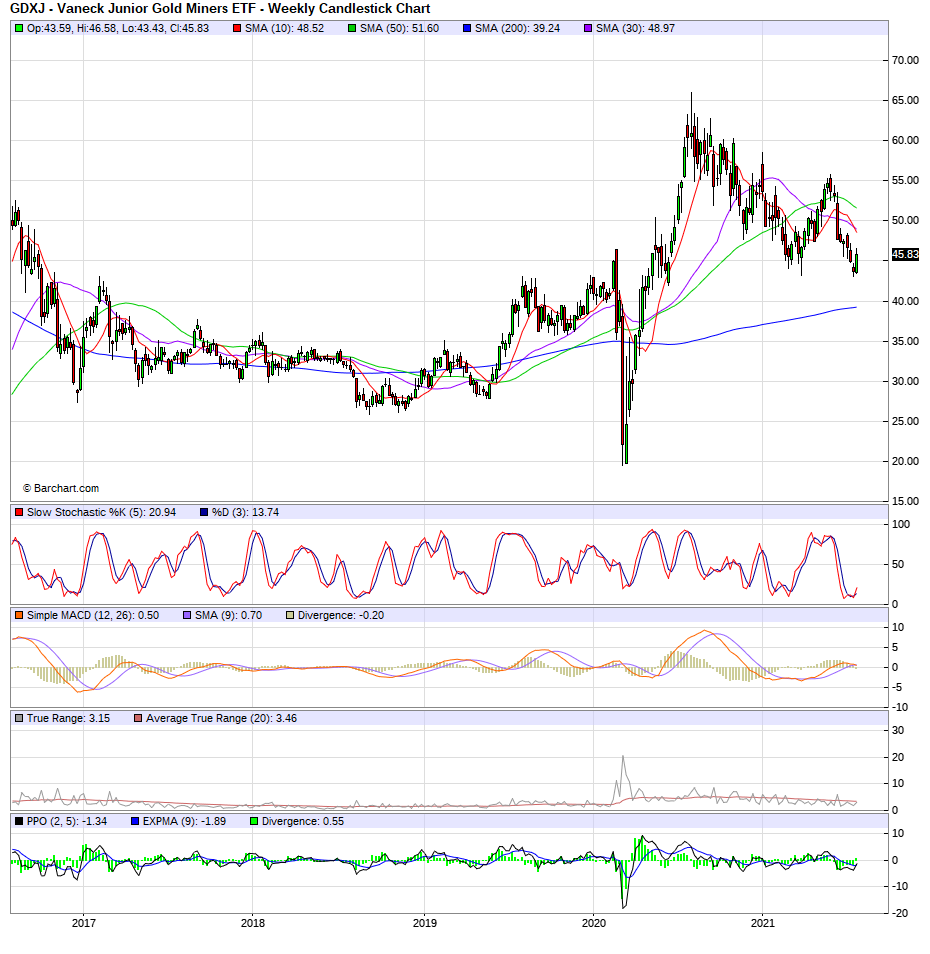
Let’s look at GDXJ’s WEEKLY chart again, I will likely add to this one next week…

GDXJ WEEKLY- as mentioned recently, it’s had a 50% fibonacci retracement and has very oversold stochastics

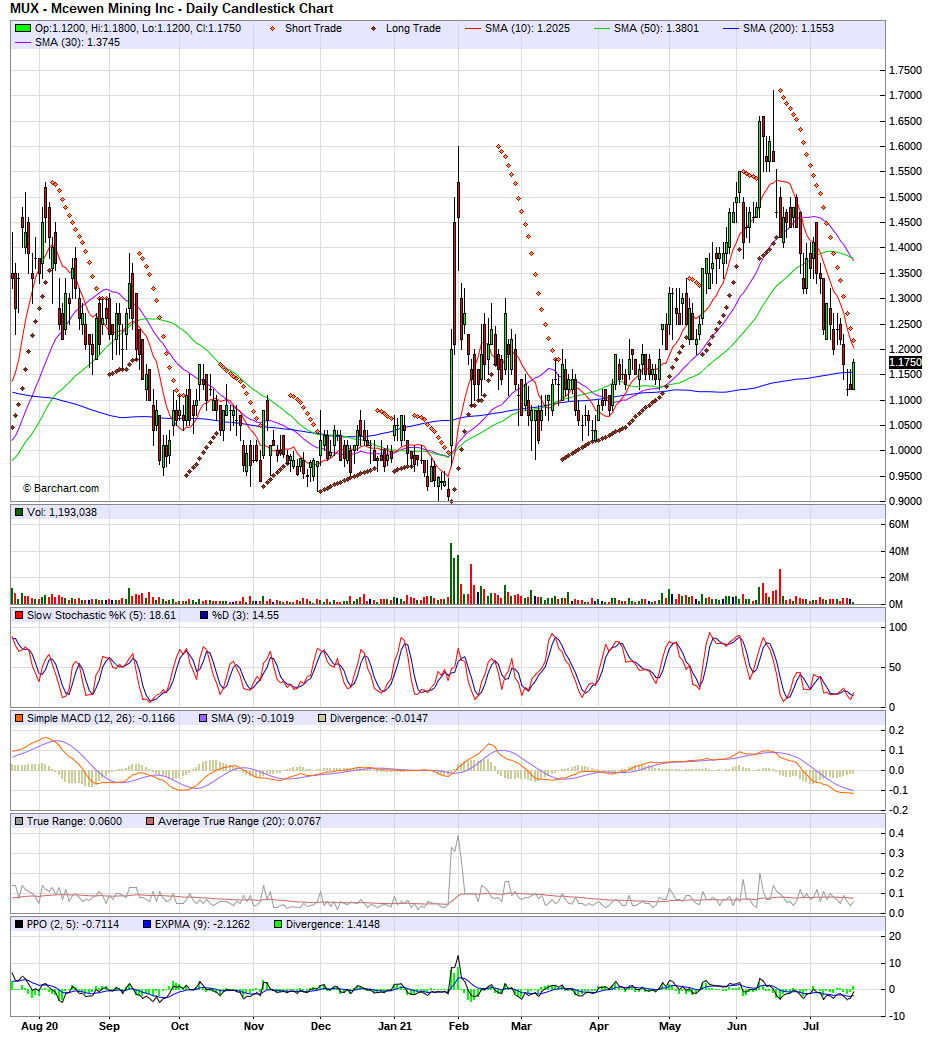
MUX was weaker than most miners today, but has been stronger than most lately, so the daily chart had me buying comfortably as I was adding to a winning position, and the stock sits on it’s 200 day moving average (not shown here, as this is a weekly chart). Using the very short term 30 minute bar charts of intraday action, allowed me to get nice fills near the day’s low prices, not long before the stock rebounded and climbed into the close of trading. More importantly, the WEEKLY stochastics are very oversold like most stocks in the group. Stop levels have been updated, members can check the revised numbers, and should review the daily account screenshots for pertinent information like average costs per share, unrealized gains and losses, etc.

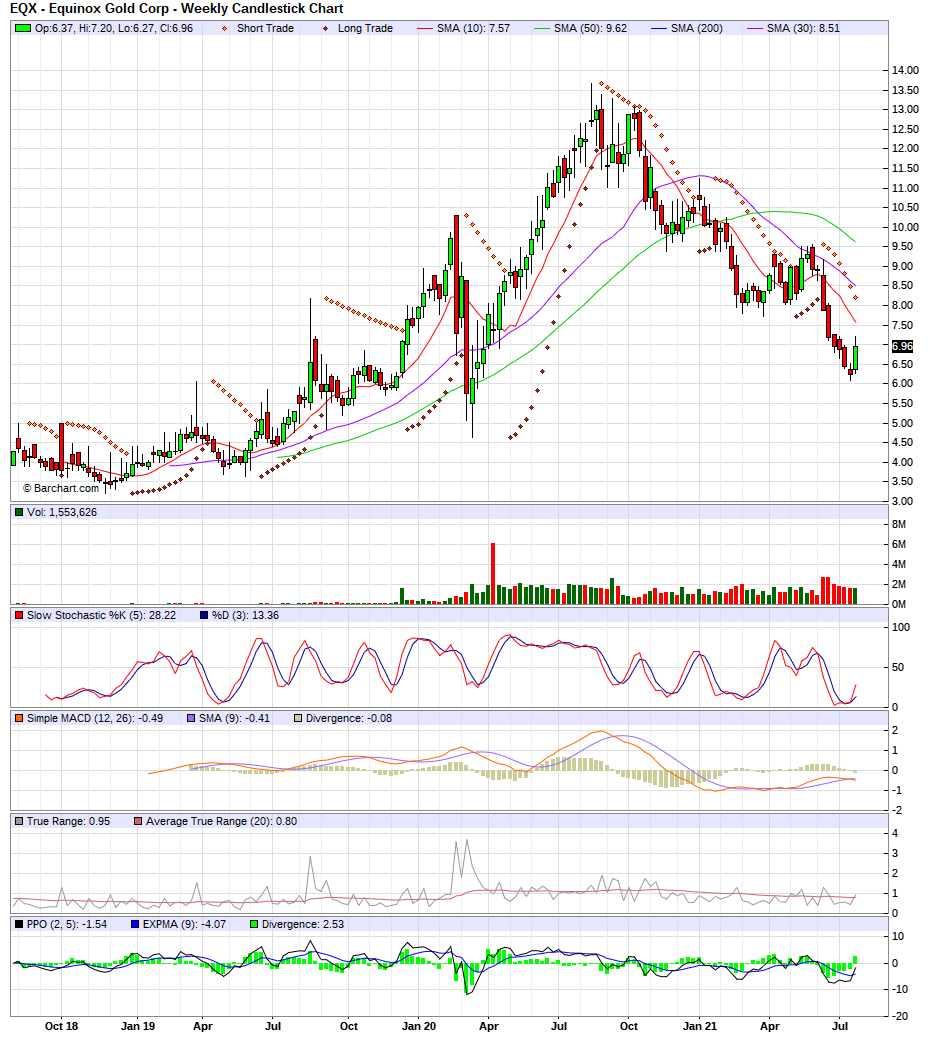
Too many miners look similar, so that we don’t need to go through them all, but let’s check on EQX (Equinox Gold) via it’s WEEKLY chart, again quite similar to others in the group, so why did I pick this stock to talk about? For one, it has been pushed much lower than most of the group, being it had unfavorable news in the form of blockades on it’s Mexican property, which temporarily shut down the mine (it was re-opened this week, so this issue should be getting behind us soon). Also, EQX was a sector leader in the earlier stage of the bull market in metals and miners, a result of great production numbers, and increasing reserves. In short, Equinox was firing on all cylinders before the blockade, which hit at the same time as the sector pullback resulting from the FOMC news they might tighten rates sooner than the market anticipated. I mostly ignore the FOMC, but the market does react to their lies and double-talk, so I take that into account. In any case, EQX was one of the best and still is, so I bet the market re-discovers this in the next leg up for the precious metals bull market. I don’t want to limit the upside, but a double on this one would not surprise me at all, nor would it shock me to see it occur quickly once the group move starts. It might be happening now, but if not, I expect a move higher sooner rather than later. Here is the WEEKLY chart of Equinox

EQX finally has a green bar moving higher, after 8 weeks dropping in a row! Stochastics are just starting higher, too.

That’s enough for this afternoon, you get the picture. If I uncover anything worth noting over the weekend, I will try to make a post here, but members can get all the details and account information, changes to stop levels and portfolio in the tabs above. The news and analysis are good to know, but the numbers and risk-control are what matter most. Keep it simple and let’s see what next week offers.

Recap for July 29, 2021

We saw some follow-through today on yesterday’s strength in most of our positions, I think only KWEB weakened and closed lower on the day, after it opened strong (up 2-3%) before selling off. It’s been a good few days and I expect more upside over the next weeks, while we could retrace for a day or two at any time, I think the tide has turned and miners will outperform most groups heading into September. At least, that is what history suggests.

Today we saw the GC (August gold) futures contract get right up against resistance at the 200 and 50 day moving averages. It’s a tough call to guess what might happen the next two or three days, not much would surprise me, but I think looking out a few weeks we should be well on our way with higher prices for gold, silver, and their miners. About $1832-1833 is the area gold needs to clear before it can search for new resistance at higher levels. I will point out that many recently beaten down miners were up double-digit percentages today, even some stocks I have stopped out of have jumped over 10% a few days in a row! It’s ok, it’s part of the game and we need to focus on the next opportunity, knowing we also still own many positions that are running higher now with the sector.

Let me also point out that tomorrow is the last trading day of the month. It’s important, as longer term investors use monthly or quarterly charts to make their investment decisions, since these eliminate a lot of the “noise” in daily or hourly charts. We will get our final price data for July at tomorrow’s close. Silver cleared a level today, that if it holds, some long term bulls say the big bull market is still in force. I think that is in the $25.50 area, but as you know, I don’t treat support and resistance as lines in the sand, I treat them as general areas. In any case, silver made a nice push higher into the end of the month, more upside tomorrow would be even better!

I added to a winner in MUX, a loser in FVL.TO (which I don’t think will be sitting on unrealized losses much longer), and started a new position in Hecla Mining (HL) LEAPS. Members can see total position sizes, stop-out levels, average cost per position, and unrealized gains and losses in the tabs above. All this data is real and the statements are actual screenshots of daily account statements, not just a reporting by somebody that might or might not have experience or trade profitably. The truth is all that matters!

I’m only going to post two charts this afternoon, the first is the GC (gold) futures contract mentioned above, the second is my new position in HL (Hecla Mining). There are several reasons to own HL, but the most important to a precious metals bull like me at the moment is that the company’s free cash flow is exploding higher the last few earnings reports. I think HL might even have the fastest growing free cash flow from operations of any mining stock in the GDX or GDXJ (can’t recall which at the moment), making it one of the better miners to own in this cycle in my opinion. The charts would support my idea, as HL just made new 10 YEAR highs in June. In this world oppressive governments and local indigenous people protesting for more freebies from miners all the time, it’s nice to have a company whose operations are primarily in the US and Canada, it’s a perceived extra layer of protection for investors as the risk of nationalization is lessened (though not eliminated). Here is the WEEKLY chart of Hecla Mining (HL), and the DAILY chart of the August Gold futures contract

HL WEEKLY chart- now has pulled back to support area formed by tops in 2017, 2020, and 2021, with oversold stochastics

Now, onto the gold chart…

August Gold futures contract (GC)- running up to resistance in the 50 and 200 day moving averages

If the gold futures can clear the double resistance at those moving averages, I think the price is heading significantly higher. I will also say I think gold will indeed clear that resistance, it’s only a matter of time, and I don’t think it will take long, in fact I bet it’s soon. I say this because Silver also put in a good performance today, as we near the month end the closing prices dictate what longer term investors will do with their positions. If Silver can hold up here or gain on the last trading day of the month, the long term charts will remain very bullish.

Members receive real-time trade alerts, as well as access to our stop levels, total position sizes, and unrealized gains and losses, the way it should be, when somebody is asking you to trust their claims. Why don’t more newsletter writers just show you their results? I don’t mean just tell you, or type it, the easiest and most honest thing to do is to post their actual account statements like we do here!

Rebound starting?

Today was the central bank’s FOMC announcement on interest rates, usually its very quiet a day or two leading up to the meeting, then investors step back into the markets and take positions, causing the volatility to come back into the markets. Personally, I typically do not try to sidestep these meetings as many traders do when they are nervous about the news event. I understand as the volatility can shake people up, but in my experience I have found more often than not, whatever trades I had on are still valid after the FOMC news. Yes, prices get crazy and can make one seasick if they haven’t seen it a million times before, but I’m used to it by now and today was no different. In fact, today was relatively calm after the news release, compared to the last FOMC meeting which kicked off the big decline we have seen in miners! One thing for sure, I never make trading decisions off the news release, as they are known to often reverse the original move. This is why I have found it best to just stick to my plan despite the gyrations, or reacting to how I feel at any particular moment in time. We have a valid plan, all we have to do is stick to it!

Today we saw the government of China step in and essentially ask banks to help them quell their markets after the Hang Seng lost 7% the prior day. While the politicians and regulators initiated the recent collapse, I think seeing their biggest and best Chinese blue-chip technology stocks lose over 50% in just a couple months was enough to begin to scare them as much as investors! So we got a BIG bounce today in the KWEB etf, up about 10%, and strong all day. We cannot know, but this could very well be the turn higher, at least for a little while as the PE ratios of great companies like BIDU got down to 7, while they have earnings of $21!!! It´s certainly worth taking a shot with numbers like that, and then things like the mood can change overnight. Nobody would touch the Chinese internet companies, then buyers come of out the woodwork in force.

https://www.zerohedge.com/markets/dip-buying-retail-army-plows-chinese-stocks-just-plunge-protectors-arrive

We have looked at the KWEB chart so much lately that I hate to bring it up again, but since we finally have a big green bar and it could prove to be a pivotal day, not to mention I was able to bring accounts up to full-risk position sizes yesterday, its worth seeing one more time. Let’s use the weekly chart…

KWEB etf trying to turn up-very nice hammer on the weekly chart

I must say that is one lovely hammer on the far right side of the chart, the handle created by the massive beatdown KWEB took the first two days of this week, now trying to reverse higher. I can’t say if it’s straight up from here, we could muddle around awhile depending on what other markets do, for example if the QQQ´s etf in the US starts to get very weak, I would expect that to drag down KWEB, or at least keep a lid on the upside. In any case, charts this oversold that reverse hard as KWEB has done today, are typically close to a bottom if it isn’t already behind us. This is a good trade for prospective members to watch play out, as it’s rare that a position goes so hard and fast against me right out of the gate. KWEB has required patience, focus, and courage, more than most trades this early into the investment. If it can hold its ground here or gain some, I will certainly look to increase my position size. Let’s let the market tell us what to do, for now we managed to get our full position and it’s heading higher, not bad for a trade that was looking to flush out not long after we started it!

Moving on, I also added to my GDXJ LEAPS on the junior gold mining etf. I am not yet to a full position on this one, so will continue to add when given opportunities for good fills. It’s important when trading LEAPS (options) that we pick our liit prices carefully and stick to them, as spreads can be ¨wide¨on options, especially the farther dated expiries. However, we can use that to our advantage, if we are patient with limit orders we can sit and wait for the markets to come to us and give us some great fills that save us big money over time. Just think of an option that is bid at $5, offered at $5.50, which is quite common. The person that can’t wait has to pay $5.50, a full 10% more than the guy sitting at $5 patiently until he gets filled. Those numbers add up quickly, so its best to learn how to get filled on the bids or at least in the middle of the spread, rather than pay up every time we decide we want something. Of course, we could miss a trade by waiting on the bid, but there are other methods and ¨tricks¨ to help us be sure and get the position, like placing our buy orders only when the stock or option is in down movement, looking to buy from a current holder that might be panicking. Here is the GDXJ WEEKLY chart…

GDXJ WEEKLY- a couple things I like on this chart

There are a couple things I like about this junior gold miners chart on GDXJ, for one, the stochastics are very oversold and just now starting to turn up again. We could get a solid 6-10 weeks of upside before it reaches overbought again. Another thing that excites me, although I have not drawn it on this chart, is the approximate 50% fibonacci retracement (pullback) we have seen, from the substantial March 2020 crash bottom, all the way to the August 2020 high, then back to current prices. Also note the pullback takes us to old resistance which is now new support, in the $45 area. This is as good n area as any to take a position, or add to one as I have done.

I also added to EQX (Equinox Gold), which used to be a darling in the sector, but fell from grace when the natives in Mexico put a blockade on the mine forcing it to shut down. I had already started a position, but chose not to add once that news came out, preferring to see how things shake out. I’m happy to say the mine is back up and running, and as the stock was responding positively today, combined with the fact the sector looks like it might be turning higher for a bit, had me thinking today was a relatively low risk opportunity to add to my EQX LEAPS. I am still not up to a full-risk position, in fact I am at exactly half of my desired position, so will continue to add to my EQX on dips as I am not near stopping out. If EQX can re-start an uptrend, these LEAPS could become big winners, especially now that the negative news has been removed for the time being. As as aside, the mining legend Ross Beatty has Equinox as his major project at the moment, they have 4 producing mines and are executing as well or better than any others. I don’t fall in love with positions, it can get very costly, but there isn’t anything I don’t like about this trade now that the blockade has been removed and mining has resumed, which was only on their Mexican mine anyway. I won’t be surprised if EQX makes new all-time highs again, but let’s take it one step at a time. Here is the WEEKLY EQX chart finally a green bar on the far right side!

Equinox Gold finally sees some green after 8 weeks down in a row!

So there was plenty of action today, and I’m happy to report our accounts had some very nice upside. More importantly is what happens next, and the charts are starting to suggest we could be turning the trend from lower to higher, in all the above positions. There were other trades today, members receive real-time trade alerts with sizes, prices, stops, and even unrealized gains and losses in the Daily Account Screenshot, so be sure to check those out for the details.

July 27, 2021 Update

The destruction of China’s technology stocks continues today again, I linked an article below that gives a brief idea of what is happening over there, but the charts say it all. Today, I’m posting the KWEB WEEKLY chart, since yesterday we already examined the daily and monthly charts. I took today’s decline as my opportunity to bring accounts up to full-sized position in KWEB LEAPS, I welcome the opportunity to put this position on cruise control now, and look at other ideas. The beating has been relentless, I can only say I am glad that just now I am reaching full risk on this one, because went straight down faster than any other etf I have seen in my 25-30 year trading history! Still, I won’t be surprised if we end up making money on this trade, due to proper risk control more than anything else. This helps explain why Chinese stocks are in a tailspin:

https://www.zerohedge.com/markets/tencent-shares-tumble-wechat-removed-chinese-app-stores

And the WEEKLY chart of KWEB:

KWEB WEEKLY-straight down recently, added to get to full-risk position this morning

I also began to nibble again on a junior copper/gold explorer, FreeGold Ventures (FVL.TO), which was adding to a losing position like many miner positions lately. I will continue to look to add to this one and others, as the miners might be getting ready to mount a rally if the general stock market is going to weaken further, like it is today. The Nasdaq was down 2% at one point today, I wager if it can get a red bar (down month) on the monthly charts, it might be the catalyst we need to get miners headed higher again. Here is the DAILY chart for FVL.TO

FVL.TO (FreeGold Ventures) has plenty of upside potential if it can start higher again

China imploding, added to loser KWEB, winner MGMLF, and a little more MUX

I might as well start with the Chinese internet stocks, as they are in the news and continue getting demolished. I don’t often trade off news items, but of course I consider them and how they are affecting prices. The news out of the government in China is nothing short of economic suicide, with over $1 trillion lost already, I think they started this campaign in February or March or 2021. I try not to let headlines force mistakes, so while the KWEB etf has come down enough that I could justify cutting it loose, since I am still not in a full position as defined by my total dollars at risk, I am willing to keep looking for spots to add, in order to bring me up to full size. I choose this route because these can be big winners, after such devastating declines on the charts. Note that my accounts are not devastated by the China events, just the the chinese stocks are, so we should have a big bounce play here soon. One after the other, chinese internet giants are getting taken out back and shot in the head, today saw Tencent Holdings ADR down over 10%, and that sounds bad enough, until you look at the chart of the last few months!

So this is an interesting situation that I might as well address right now, because I am sure to get lots of questions regarding how I handle a stock that drops to my stop out level BEFORE I even have a full position size? It’s pretty simple, if my total dollars lost are not yet at my Total Risk level, I consider the trade still valid and active. In fact, I like to buy at the cheaper prices, however we must keep an eye on such stocks as there is something much bigger happening than what charts typically tell us. That does not necessarily mean it’s a negative, it could be a huge winner depending on the news flow, but we must admit that we cannot know so early, otherwise the KWEB etf and it’s components would not have gotten hammered so hard to begin with. I will continue to build up to a full position, and always keep my total risk amount in the back of my mind. I hope I’m not stopped out of KWEB, being it’s already suffered so much that I think the upside could be very substantial as soon as the bleeding stops. Let’s see if I can stay in it long enough, and without losing too much sleep, before its starts screaming higher as everybody looks for bargains they threw out yesterday! I’ve already posted it many times recently, as my buy orders got filled here and there, but let’s take another look at the daily chart, then the monthly chart to step back and get the bigger picture. Suffice to say, if a trader can be invested in such a terrible looking chart and still make money on the trade, he is adept at risk control and money management. Heck, if they can lose just a little on such a horrendous chart, they are likely a very profitable trader overall. KWEB daily and monthly charts:

KWEB DAILY-looks like no end in sight for the drop, but it will turn before long is my bet

And here we have the MONTHLY KWEB chart, equally as ugly, which is pretty rare in this business!

KWEB MONTHLY, if one can stay invested and not get shaken out, these can become big winners

The final take for today is that I will keep it simple and trade KWEB like I would trade any other setup. This could end up being a huge winner with so much potential, maybe we have bought the leaders in China’s e-commerce at bargain basement prices for many years, or we might be too early and get washed out along with millions of other investors that are hating these stocks at the moment. It’s ok, we don’t care about any one trade more than the next. We want them all to work, but realize that isn’t what will happen, we will win, we will lose, we just want to win a lot more than we lose. Simple! 🙂

I also added to my winner in Maple Gold (MGMLF) on this big pullback in the mining sector. I have a large position already, soo didn’t go overboard, this buy was just to remind myself to keep and eye on MGMLF and be look to add over the next few weeks as opportunities set up. I have watched pullback to its upward sloping 200 day MA, where it sits now, so today was a good time to step up and get my feet wet (again). Member can see my current total holdings, average price per share and unrealized gains and losses on the tabs above. I haven’t adjusted the stop levels on this stock yet, as I’m up a good amount and not near stopping out, so wasn’t pressed to get it done considering all the fireworks happening in China, bitcoin, etc. Take a peek at what I was looking at when I added today.

Maple Gold (MGMLF) pulled back to it’s 200 day MA, so I added to my position

I also nibbled some more on shares of MUX (McEwen Mining), this one has to be reported as added around break-even. I will post the chart again for those interested, there wasn’t any news or catalyst for the buying today, but I like that miners appear to be running out of downside, as a group. I also like that MUX does not seem to want to drop more, it hangs in on days the sector is weak, leading me to believe it’s had enough downside and sellers are getting exhausted. That might change, and that is what stops are for, but for now I like adding to names like this when they hold up, after having already pulled back to support levels, in this case the 200 MA. Yes, I realize that perfectionists will remind me it’s actually sitting below it’s 200 day MA, but to me it’s close enough. Remember that I always assume support and resistance will HOLD UP, rather than get ¨broken¨, but of course breakdowns do occur sometimes. Again, that is why we use stops. I will assume MUX has a higher probability of bouncing soon, than collapsing or especially dropping much further from here, after a substantial pullback. Let’s see if I’m correct, for now here is the chart to contemplate.

McEwen Mining to me has better odds of a bounce than further decline, sitting near it’s 200 day MA

Tomorrow, I will look to buy more KWEB LEAP options, I had other limit orders in today, but only got filled on one order to buy. While the KWEB etf did go lower during the day, the LEAPS held up and didn’t trade as low as my entry price the whole day. Maybe they are signaling it’s done with most of the drop, or tomorrow morning the LEAP options “catch up”and drop some more, giving me some great fills as I get up to a full-sized position. That’s ok, we are not in a rush and we know patience is a virtue!

Added to loser KWEB etf

The big Chinese internet etf is getting clobbered today, down about 9% as soon as US markets opened. Since I am not yet stopped out, and don’t yet have my full desired position, I will view this drop as an opportunity to pick up some LEAP options on sale. As I near the full position size, I will have to be more strict with how much room I give each contract to go against me. KWEB is still intended to be a several month trade, roughly 6-10 month hold time is my best guess, and it’s oversold too on the weekly charts. I will post both below since I have a few extra minutes and am not overly active today in the markets. I still have several buy limit orders in, and will report any fills I get through the email-alerts for members.

First, the monthly KWEB chart. Notice how oversold the stochastics are, nice setup, in fact the only thing I’m not thrilled about is the MACD is only now just turning lower after a huge uptrend the last few years. That might not be too troublesome, the moves in this etf are large enough that we could see great gains before we see too many technicals change on the monthly chart, as a result of the big Average True Range (trading ranges), especially on the longer term charts.

KWEB MONTHLY VERY OVERSOLD

Now, let’s look at the weekly chart. The first thing that jumps out at me is the speed with which this etf has collapsed almost 50%! The second is the stochastics, quite oversold like on the monthly chart, but the weekly also sports a better looking MACD. So in a case like this, I can imagine many traders that take a shot of KWEB will be tempted to cash out after a good bounce, a bounce that shapes the weekly chart more positive like if the stochastics can reach overbought. However, I will try and push for more by sticking with the monthly charts prospective hold time of 6-10 months to turn the technicals positive. I can always change my mind if some new information pops us, but I typically find changing plans mid-trade hurts more often than it helps! I’ve already adjusted the Stops page to reflect the new LEAPS I’ve added, members should check out that tab and also the Daily Account Screenshot, which is an actual account I manage for a family member. I selected this account for the website because it was most representative of the style and size of accounts I managed when I maintained a license and handled retail accounts, whereas now it’s just Friends and Family accounts.

KWEB weekly chart says we should be due for a good bounce, too! Take your pick of what time frame interests you most, because KWEB is lining up on several.

KWEB WEEKLY-oversold stochastics and MACD about to turn up

Only one small trade today, but a few charts of interest to share.

At first glance I thought I didn’t make any trades today, but on review, I was filled on a small buy order to add to MUX today. Other than that, I just have a few observations and charts to share, being some interesting activity occurred in a few of my positions. First, NOVRF (Nova Royalty Corp.) had a nice jump today, gaining 11% and strong all day, while UROY (Uranium Royalty Corp.) outperformed in a generally weak uranium sector, making a late day run to finish up just under 5% on the day. Today’s action puts both of these stocks into the positive with unrealized gains now, so I will look to get more aggressive (heavier positions) in these when opportunities present themselves, preferably into a dip lasting a few days or more. Below, I will post the daily for both NOVRF and UROY, note they both are now above all moving averages now, after today’s strength.

NOVRF closed near the highs and convincingly above all moving averages.
Uranium Royalty Corp. looks similar, now above all moving averages, looking good

So both stocks are sporting similar patterns, when a stock moves above all moving averages it can be a signal that a trend is about to initiate, in this case we should expect and uptrend. If the uptrends materialize, these stocks become great “buy the dip” candidates on most pullbacks, so expect to add to these positions. Here is an intraday chart, just to show how quickly buying can come into a stock. While I don’t often trade off the 5 min bar charts, other than to time entries and exits I had planned from a daily or weekly chart signal, here we can see how quickly the buying came into UROY, after spending most of the day not doing much.

UROY intraday, the move didn’t start until 3:20pm, then marched straight higher

So these are two stocks to keep an eye on, be ready to add. I had buy limit orders in on several names, but no other fills. I didn’t see any reason to pay up or chase things higher, so I will sit and wait patiently for pullbacks in which to add to my positions.

Added to LOSING position in GDXJ

While I normally prefer to add to winners on a pullback, I also like to add to a position I like but that I am down on, especially once it starts showing strength, as the mining sector is doing today. It is more risky than adding to a winning position that has already has a cushion to buffer any downside, but also can give great entry prices or lower our average cost from earlier purchases, assuming the trade is still a good one and will work out. As I type, I am still not up to a full risk position in GDXJ LEAPS but I’m getting close, might even get there before the close of trading today. Members can get all the details in the Stops and Daily Account Screenshots tabs above, but they also receive real-time trade alerts whenever I make a move in the markets, as well as adjustments to stops levels, unrealized P+L, etc.

The other day I posted the WEEKLY GDXJ chart, here I will post the daily chart. Warning: It sure looks ugly, the moving averages are in a death cross and headed lower, the stock price in at the lows, what else could be wrong?! LOL While I enjoy being in a firm uptrend, with momentum at my back, I have also learned that things often look their worst right before they turn great again. Recall my GDXJ buy the other day when I posted the WEEKLY chart, that told a different story, showing well oversold stochastics and the stock near potential support, and since this is a trade with a WEEKLY hold time expectation of 6-10 weeks, I can live with an ugly daily chart. Let’s see if we can hold this one through to see it transform into a winner. If it can, these are the biggest profit potential trades of all, riding something from the trash dump all the way to the pinnacle of every portfolio! 🙂 In any case, I will be taking profits when we get to overbought stochastics on the WEEKLY chart, whether I am up or down on the position. Members get updated stop prices, and overall position sizes and unrealized P+L numbers with their subscription, something I not only think is the most important aspect of trading, but little or no newsletter writers provide. I don’t understand this, as its the single most important aspect of successful trading, just picking a name to buy and sell in the most basic step, and not nearly as important as how much we buy, if and when we stop out, as well as when we sell for profits. GDXJ daily chart:

A chart only his mom could love- GDXJ DAILY is ugly but I added today

I’m not far from getting to a full-risk position, keep up with the position sizes and stops in the member’s section.

After the close update: I was filled on a buy order to add to my NOVRF position just before the close. I have to report this buy as an “adding to a losing position”, as I’m down slightly on this stock so far. Being that copper stocks are turning higher like many commodity stocks today, I don’t expect my Nova Royalty Corp to be a loser for long. For those that want immediate updates and alerts, becoming a member gives them not only real-time trade alerts, but also a real, daily screenshot of the account I am managing for this site (it’s a real account, real money, real time), including total position sizes, average prices paid for positions, buying power, margin amounts, etc. All of the most important details are available to subscribers, and I’m very sure the information is well worth the cost of membership. I don’t know of any service out there that lays the actual and true numbers all out there for their subscribers, instead all I have seen is a constant barrage of buy recommendations, with very little regard to the position sizing and stop placement. These are the most important aspects of a trader’s plan, and ultimately they determine our results, what we decide to buy and sell is secondary to risk control and learning to push winners for all they want to give. Money management and risk control are far more important than what we choose to trade, it’s that simple.

Added to winner MUX- McEwen Mining

Miners look to have turned the corner and are headed higher today. I showed a chart of McEwen Mining recently, but today it looks even better as its nudging back above its 200 day MA. MUX is a live case where where my position size is larger than my original desired position based on my fixed Total Risk (TR). I will still keep the risk close to the original level, just have more shares which means I will give them less room to be wrong. Because MUX looks like it’s about to start higher again and getting over it’s critical 200 MA, I feel the momentum near term has changed in my favor, so I am comfortable with more shares. I will continue to play this one the same way, if I get more chances to add while still sitting on unrealized gains, I will do so. I might add to this post later, as I have open bids on the market for more UROY, NVROF, and GDXJ LEAPS to name a few. Members get real time email alerts whenever I make a move, buying or selling, as well as access to account screenshots daily.

Can MUX stay back above it´s 200 day MA and turn the trend UP again?

I only focus on MUX today because that is one I got some fills on, but the whole sector is acting better and many charts look similar. This afternoon might be a good time to add to some positions, let’s see if they present an opportunity!

Added to losing position in GDXJ

I’m still not up to a full risk position in GDXJ LEAPS, the ones I bought expire in Jan. 2023, and I am about half way to my desired position size. Of course, if the trade starts working out and showing me unrealized gains, I could get quite a bit “heavier” into the position, sometimes as much as double or triple my original planned size. However, I am always trying to keep the Total Risk (TR) near my original amount.

Members can get all the details in the tabs above, including revised protective stop levels, but here is the WEEKLY chart of GDXJ. Once again, we can see GDXJ iw well oversold on the technicals, but it also could be that it wants to come down and the red 200 week MA, in which case I would increase my position size to full risk with full size. Since this is a weekly signal, I expect to be in the trade a minimum of 6 weeks, maybe as much as 10 or 12 weeks depending on how well the trade is working.

GDXJ LEAPS-added today as I work up to a full-sized position as defined by Total Risk (TR)

Late afternoon update, added to my UROY (Uranium Royalty Corp). I used barcharts.com for the larger graphics on something like UROY which is less actively traded, in case readers wonder why I alternate between charting services. I’m still not up to a full position as defined by my Total Risk (TR) levels, but I keep buying until I get there, as long as I am not stopped out.

SIGN UP FOR UPDATES

NO SPAM, EVER!