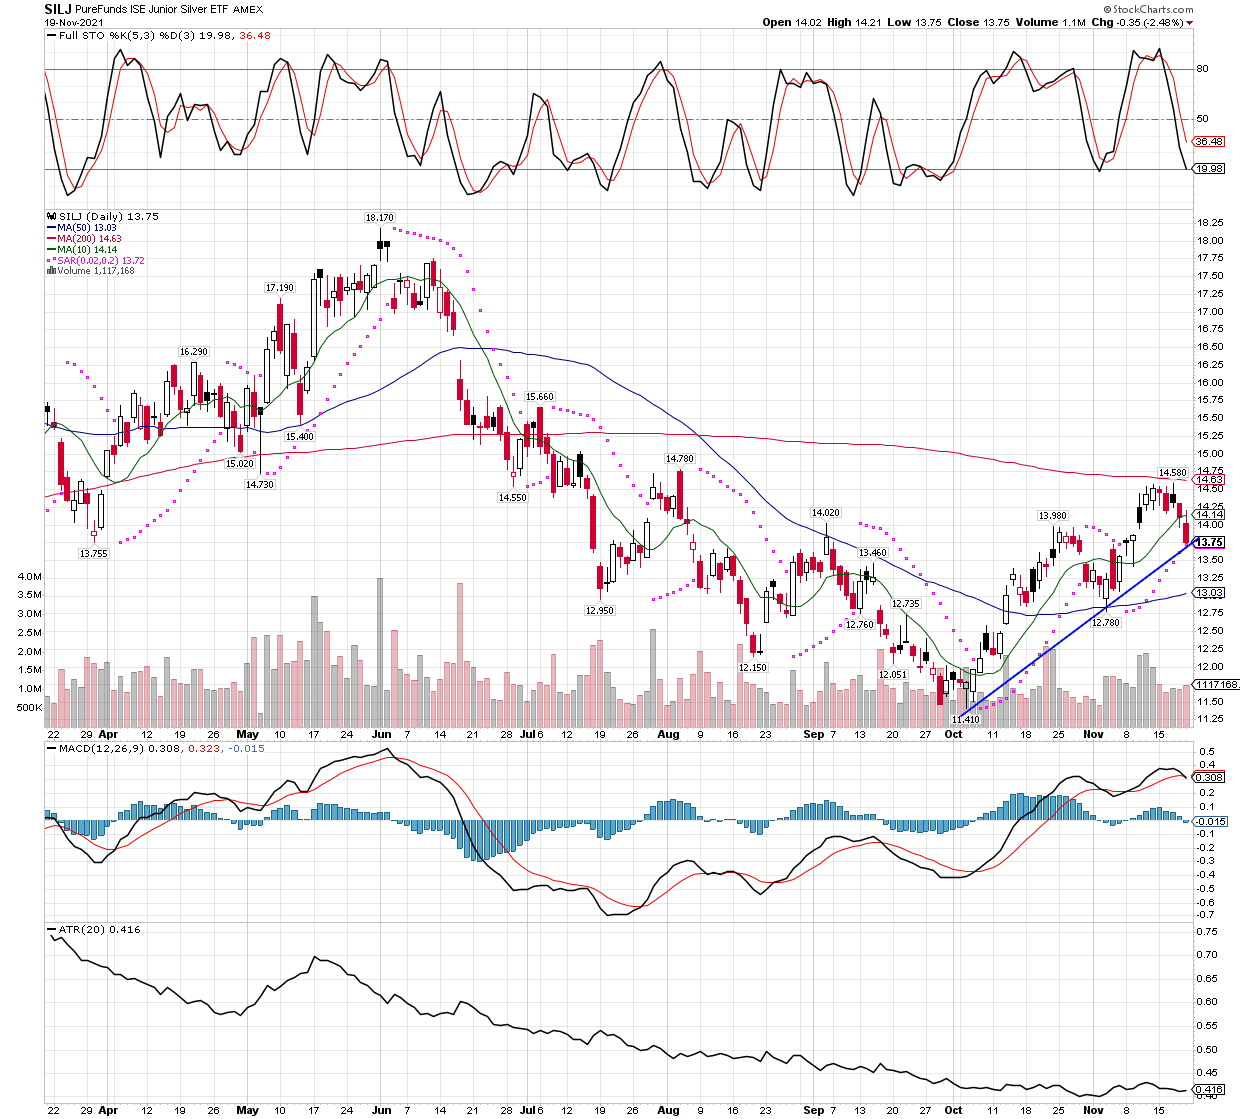
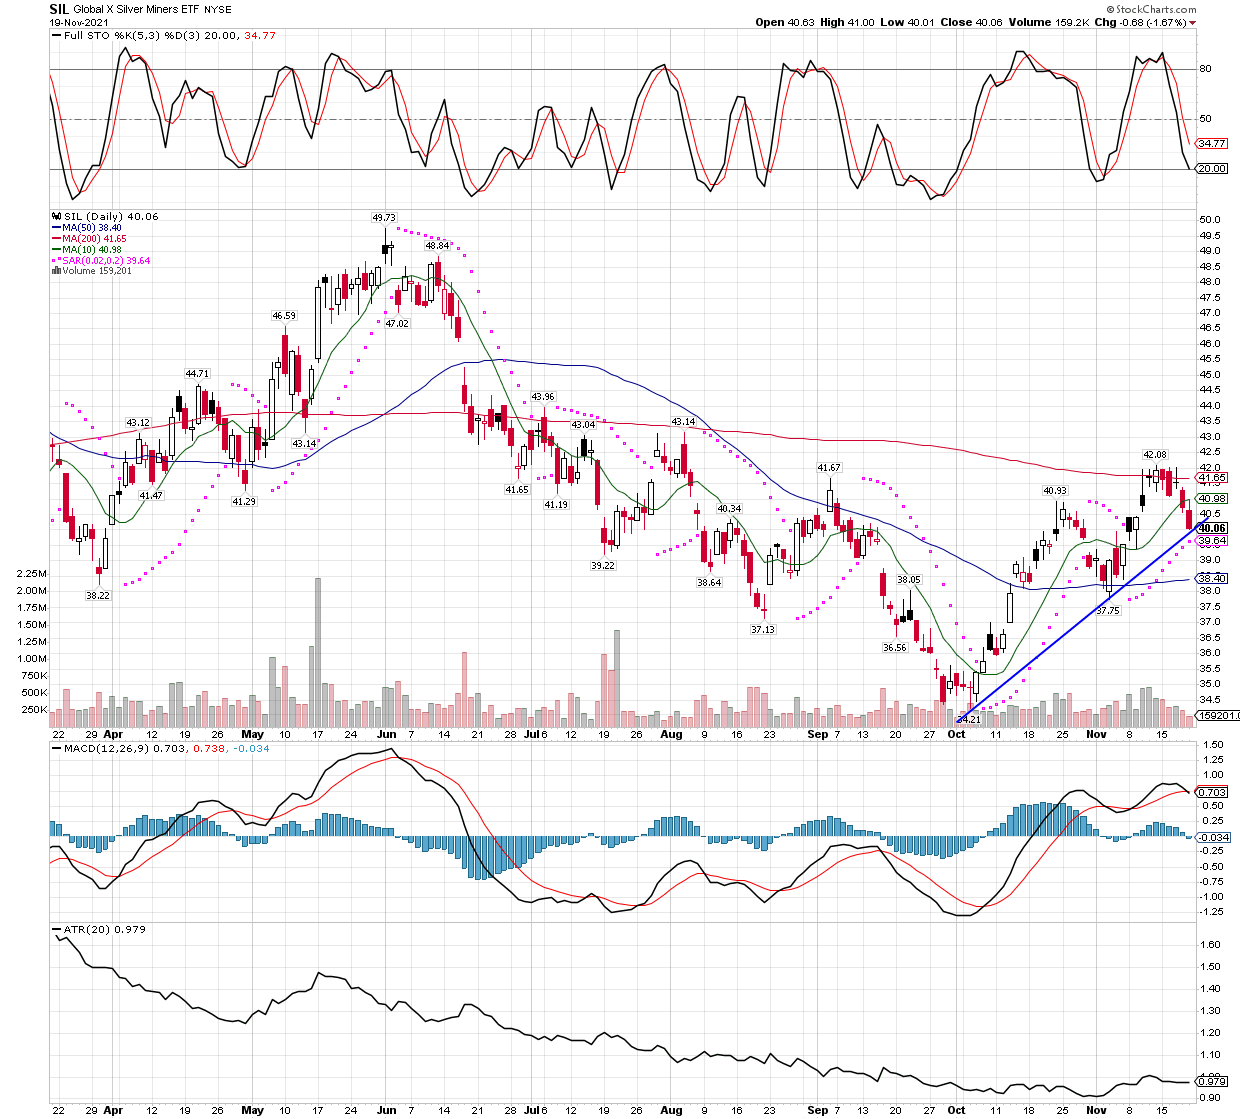
Just a quick extra post of something I noticed as I was going over the charts this weekend, both the SIL (Silver Miners etf) and SILJ (Silver Junior Miner etf) are sitting on their uptrend lines for this cycle on the daily charts. I will post the charts below, but must add that both GDX and GDXJ are not yet testing their trend lines, so we might not get an immediate bounce. However, I would not expect much downside in any of the funds I mentioned above, and the silver miner etfs look even better, in my opinion. Keep in mind, most silver miners are actually near 50/50 in production of both silver and gold, another reason I prefer the so-called “silver miners”, an investor is already exposed to gold as well.
SILJ showing a very reasonable pullback, one I intend to buy into as soon as the technicals get further away form overbought. They don’t have to reach oversold at this point, as we are not picking a bottom, it appears to already be in place.SIL looks quite similar to SILJ, both are buys to me, but I prefer to let them meander around in this area for a week or two more, while they build energy for the next push higher.
It was a week of drawdowns, but nothing serious. The precious metals miners have been on a solid run for several weeks and we are quite happy with our portfolio gains, some of our juniors have been on fire (like DSVSF gaining 107.7% already from its Sept. 27 low), so we should expect a week or two of corrections or sideways action. While it can be uncomfortable to ride through these periods, they occur more often than not in bull markets, and trying to avoid pain by hopping in and out can prove to be very costly, when one finds himself out on the sidelines as the bull decides to re-ignite. I’ve learned to sit tight and rather than sell, I look for areas to add to my positions. One positive outcome during the pullbacks, is that the technicals are allowed to cool off a bit, which give the bull more upside potential when the bull kicks in again. Related to our recent positions, the weekly stochastics were getting into overbought territory, and while now yet flashing a sell signal, they can now “reset”, so that the next push higher has more room to run before the technicals get near the next sell signal. The only concern is that the miners dont pull back too hard or too far, while we wait for the next launch higher. On that end, so far, so good. Miners show strength more often than not, and declines have been muted compared to the positive days of gains. Also, we see may mornings the group will open lower, only to find a low and work higher the rest of the day, thus climbing the proverbial “wall of worry”.
I’m going to post a few links to material I found useful, in fact I just got done watching Michael Oliver’s newest interview with the WallStreetSilver Reddit crew. I really respect his analysis, being he focuses much more on momentum than price, something I do in my own analysis as well. His thought is momentum changes lead price changes, and he has a great track record in the few years I have known about his work. Click here to watch the twenty minute video. Mr. Oliver says both gold and the SIL etf (silver miners) have confirmed bullish momentum breakouts already, and he expects the other etfs to follow.
On that note, let me post a link to a basic FINVIZ filter I use, showing the number of gold miners above BOTH their 50 day and 200 day moving averages. A month or 6 weeks ago there was almost nobody on the list, but that changed quickly, where the filter now shows 17 miners on the list, not bad considering most were down on the week. The week before there were over 25 names on the list, showing us that many miners are back into bull trends, as defined by trading above critical moving averages.
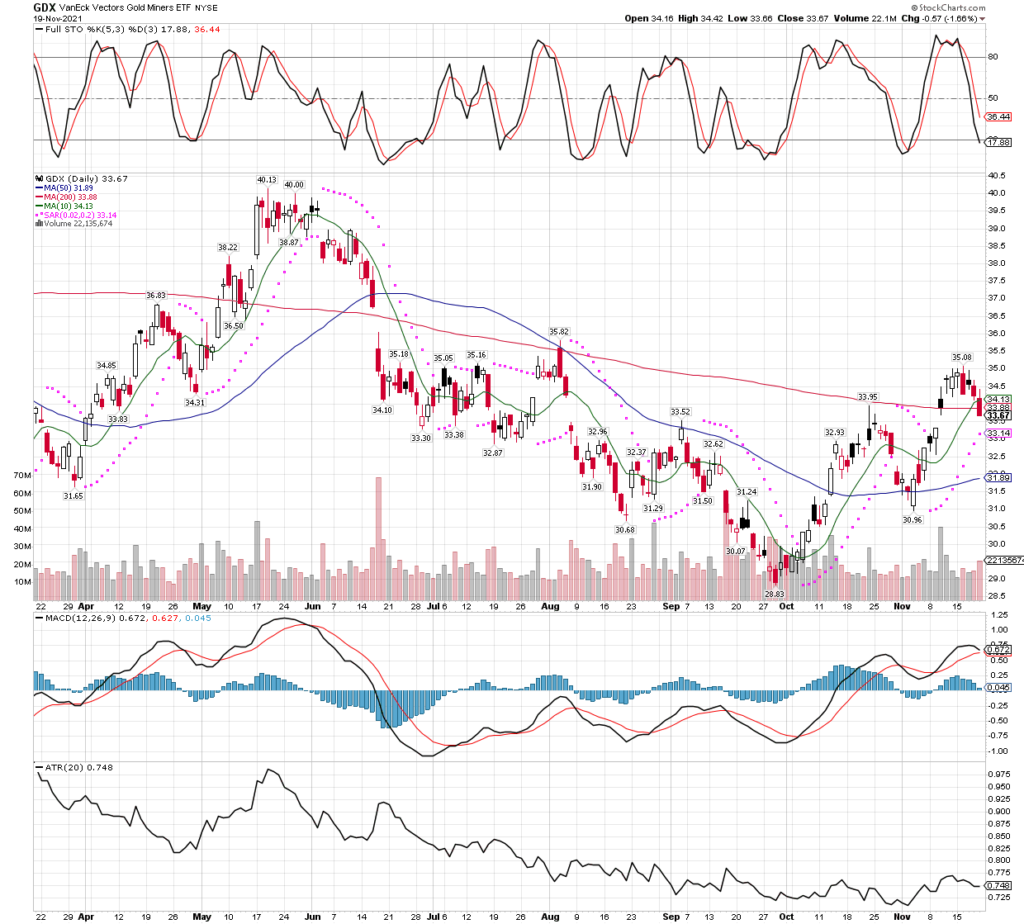
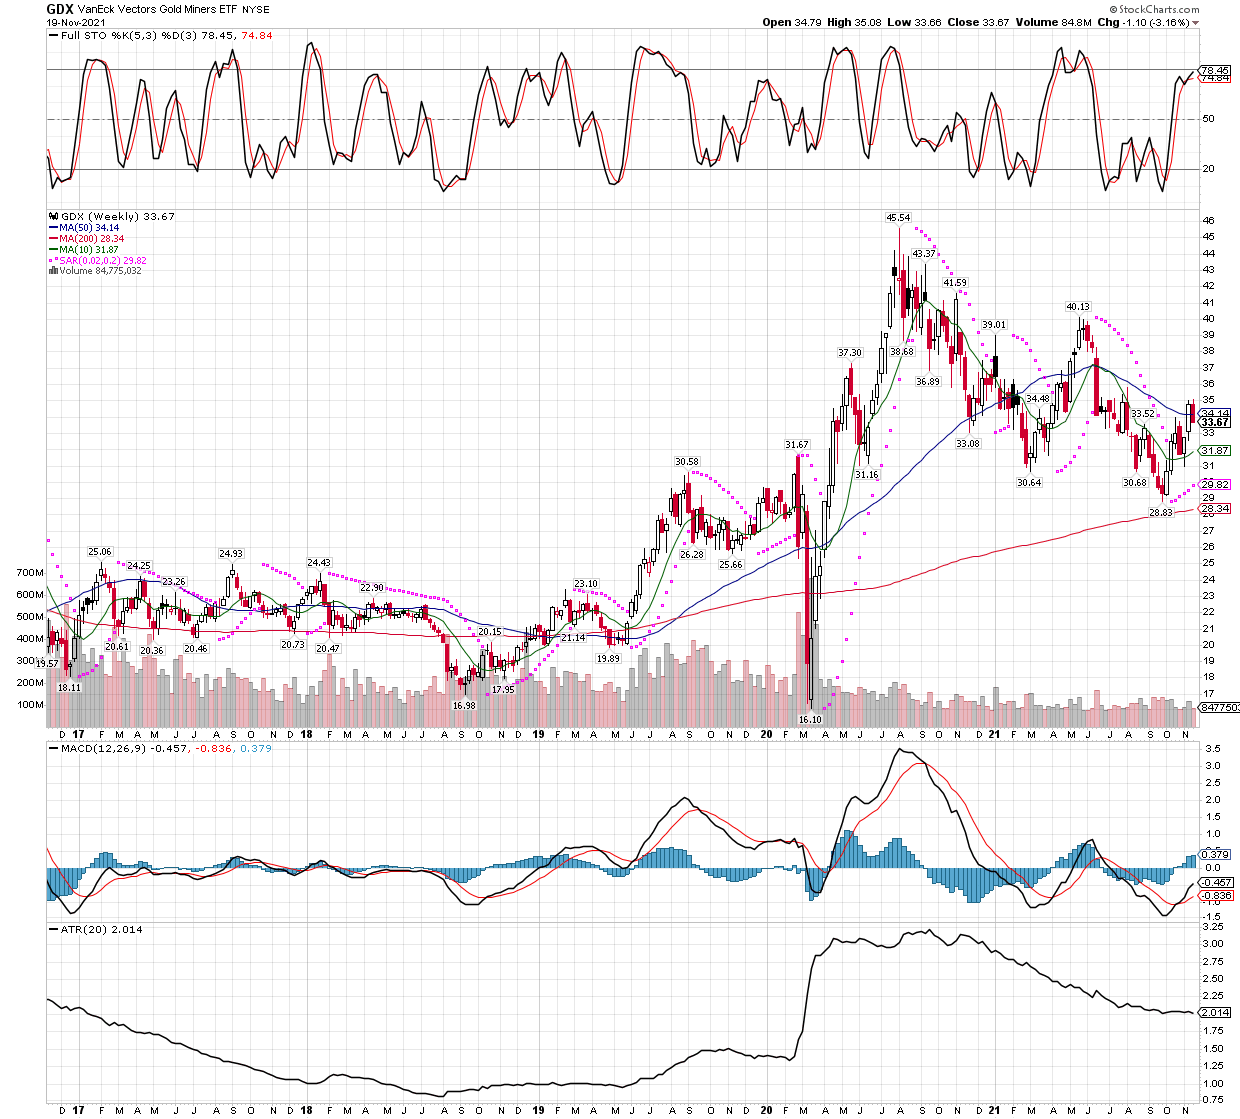
Next, let me post both the daily and weekly charts of the GDX etf. At first glance, one might get concerned about GDX closing below its 200 day MA, but recall that we assume support and resistance will hold, which would imply it wont be too long before GDX is back above the support line. In fact, I would wager GDX is a better buy here than it is a short setup. If it weren’t for near overbought technicals, I would be a buyer here. Actually, I nibbled very lightly on Friday, though it was a small buy until another week or two pass and the stochastics are not near overbought any longer. I will add again if GDX doesn’t immediately bounce and continue its path to overbought.
GDX daily chart causing alarm for those that don’t know support and resistance usually hold up, even with a print below a crucial line, such as the 200 day MA. My bet is GDX is back above it in a few weeks or less.GDX weekly chart might see the etf drop to its 10 week moving average near $32, but by no means would I bank on it, or sell with a plan to buy my back at lower prices. The bigger risk is in being out of the market, in my opinion.
One final note, I don’t usually pay much attention to government funded institutions or industry mouthpieces and what they have to say, being they are often more propaganda than truth, but I found this report from the Silver Institute quite interesting. I have not yet confirmed if their numbers are correct or not, but if so, I don’t see a better place to be invested as we head into 2022.
The Silver Institute says “With each significant component of silver demand forecast to rise in 2021, global silverdemand is set to reach 1.29 billion ounces, the first time it has exceeded 1 billion ounces since 2015.”, and later mention mining supply, “In 2021, mined silver production is expected to rise by 6% year-on-year to 829 Moz.” Lets hope they are correct!
I haven’t posted in over a week, and while nothing earth-shattering has occurred to report on, several things are worth noting. For example, today Pretium Resources (PVG) was bought out by Newcrest from Australia, and while the purchase price is only about a 23% premium from Monday’s close, the stock of PVG is still up over 56% in the last six weeks. It’s good to see takeovers ramping up in the mining sector, yet I still hope my holdings don’t sell out after 56% rallies, I think we can make a whole lot more if we push for more.
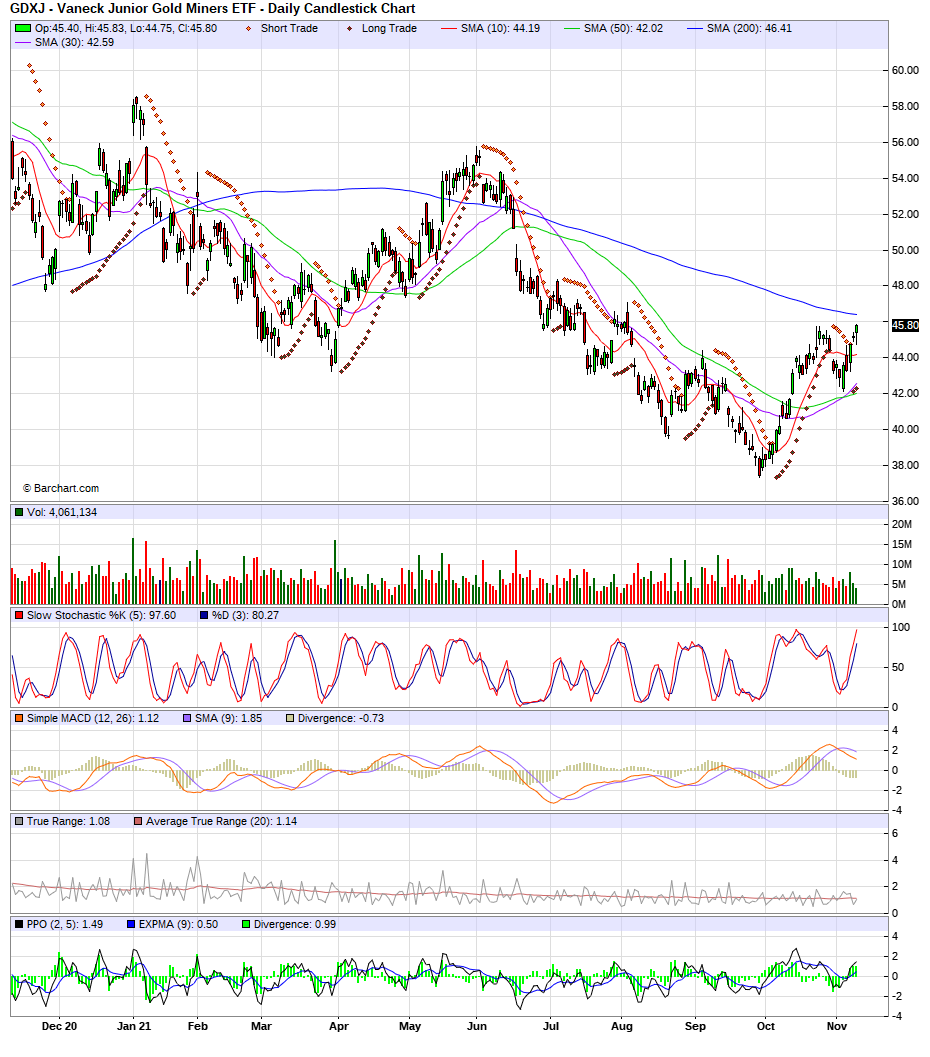
Lets go to some general market and mining sector observations. As the stock market continues to go straight up overall, I am starting to see some weakness in various groups that is not being met with big buying. Instead, some stocks are choosing to continue lower, or are only able to rally marginally. However, the miners are holding it well, and they seem to get bought back up after weak openings, or just plod higher several days in a row. Here we see GDXJ (the junior gold miners etf) making a new high for this bounce as I type…
GDXJ making a new high in this new uptrend, looks good to me.
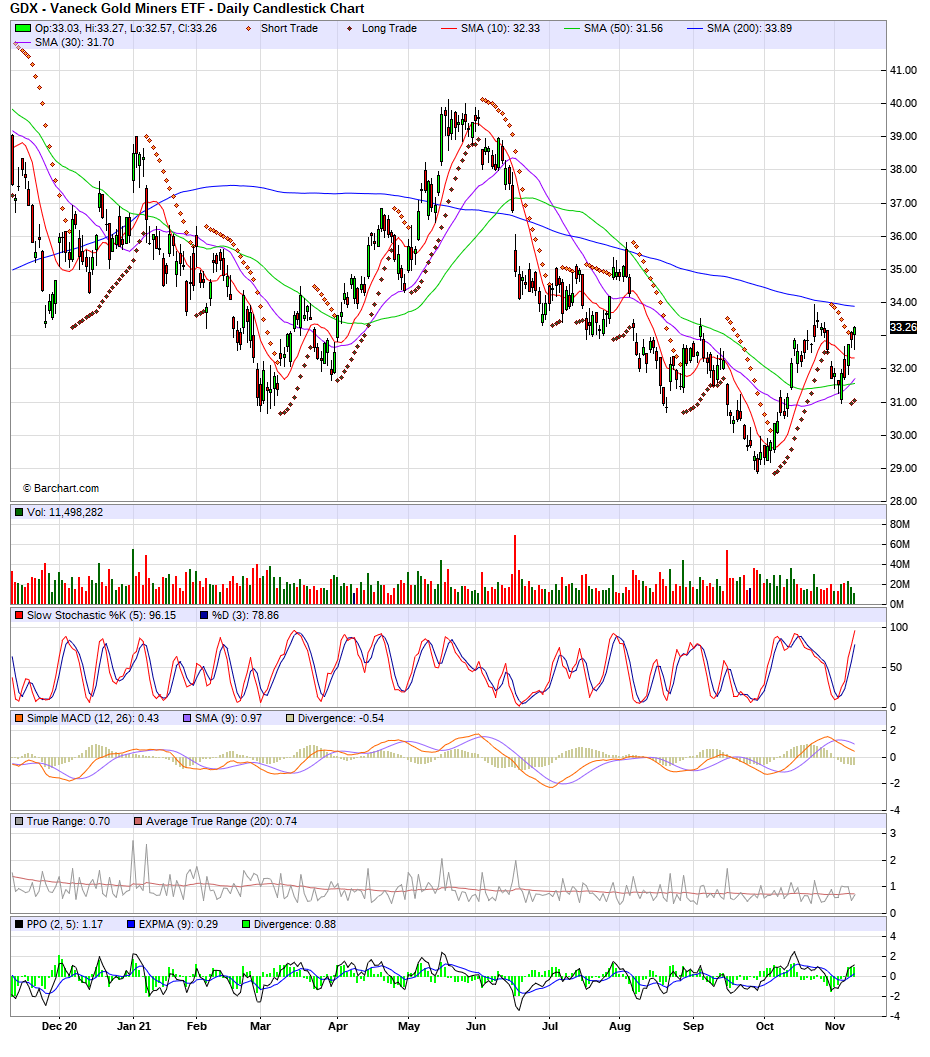
And GDX pulled back to it’s 50% fibonacci retracement level, then tried to break below the 50 day moving average, only to reverse and get back to it’s rally…
Let’s see what GDX can do after it gets back over the 200 day moving average, directly ahead at $33 and change!
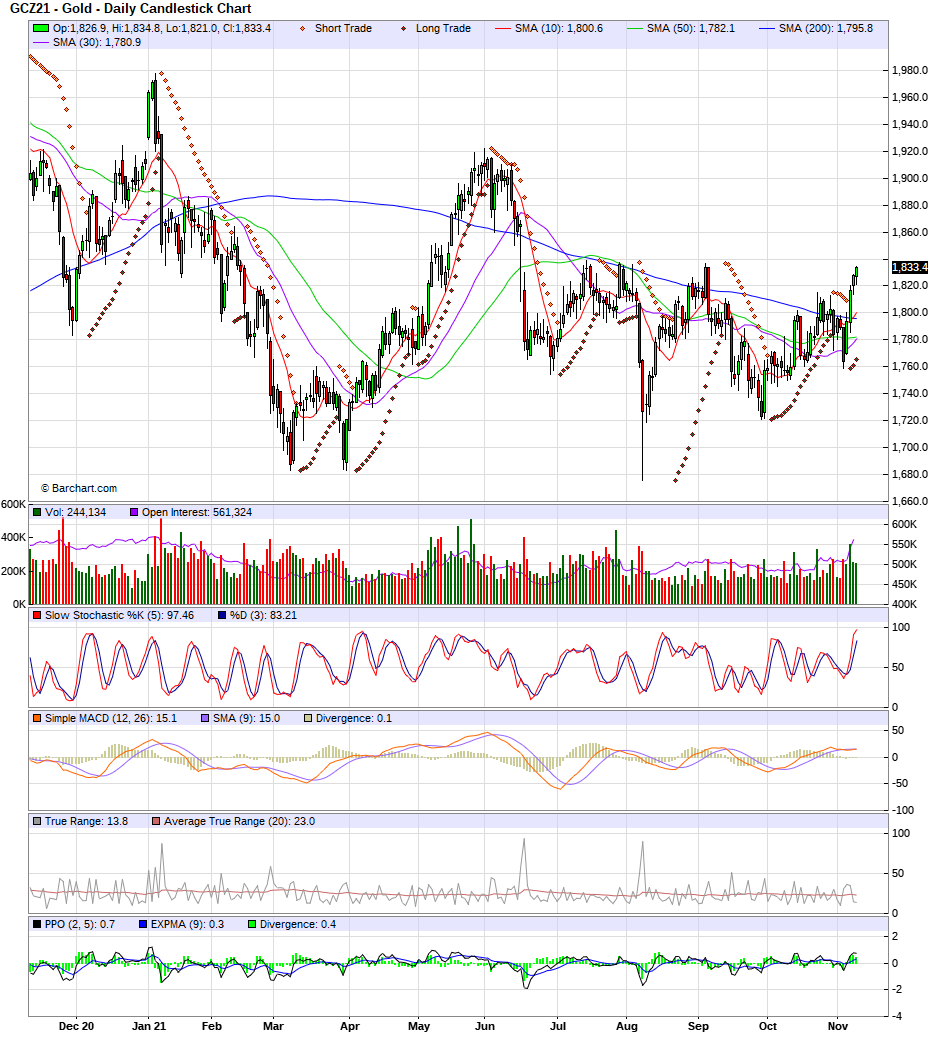
So things look like they are shaping up in the precious metals sector, as gold itself is now back above it’s 200 MA, leading the sector higher…
Gold futures (symbol GC) look to be leading the way higher, miners should scream higher to catch up and pass the metal at some point
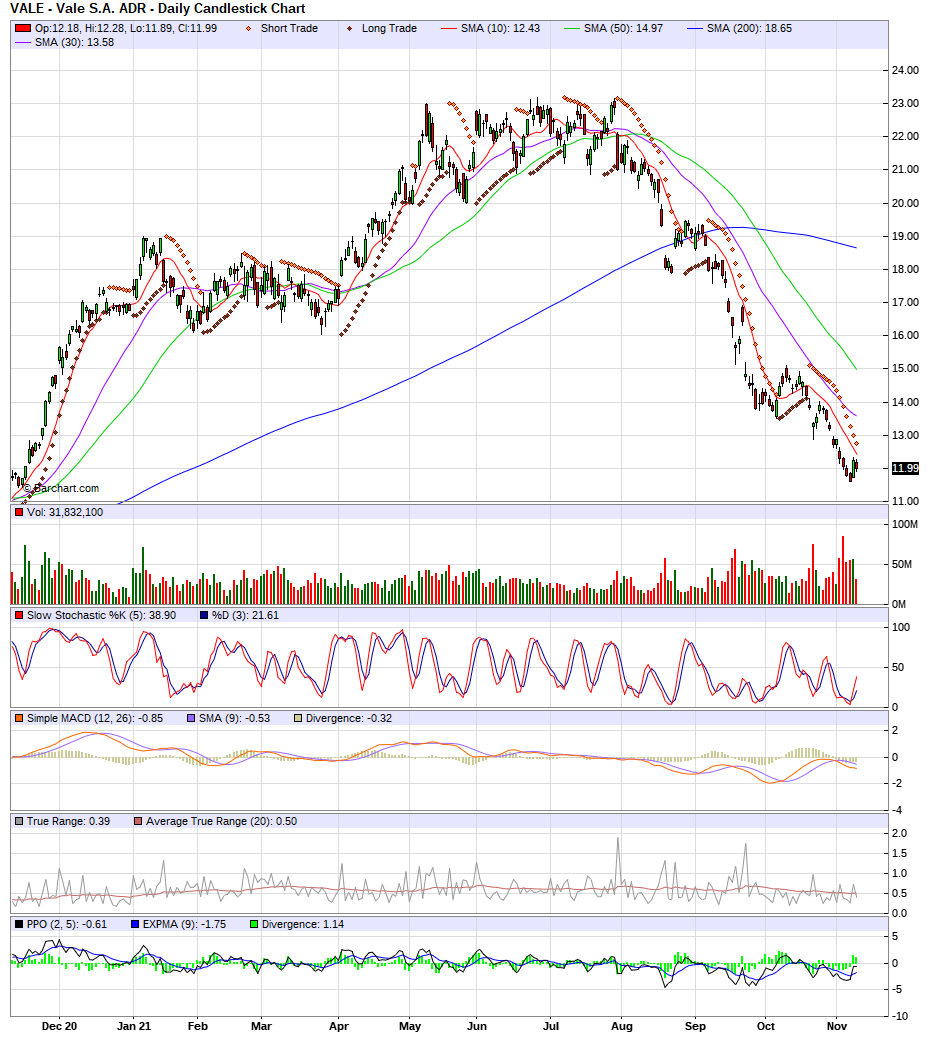
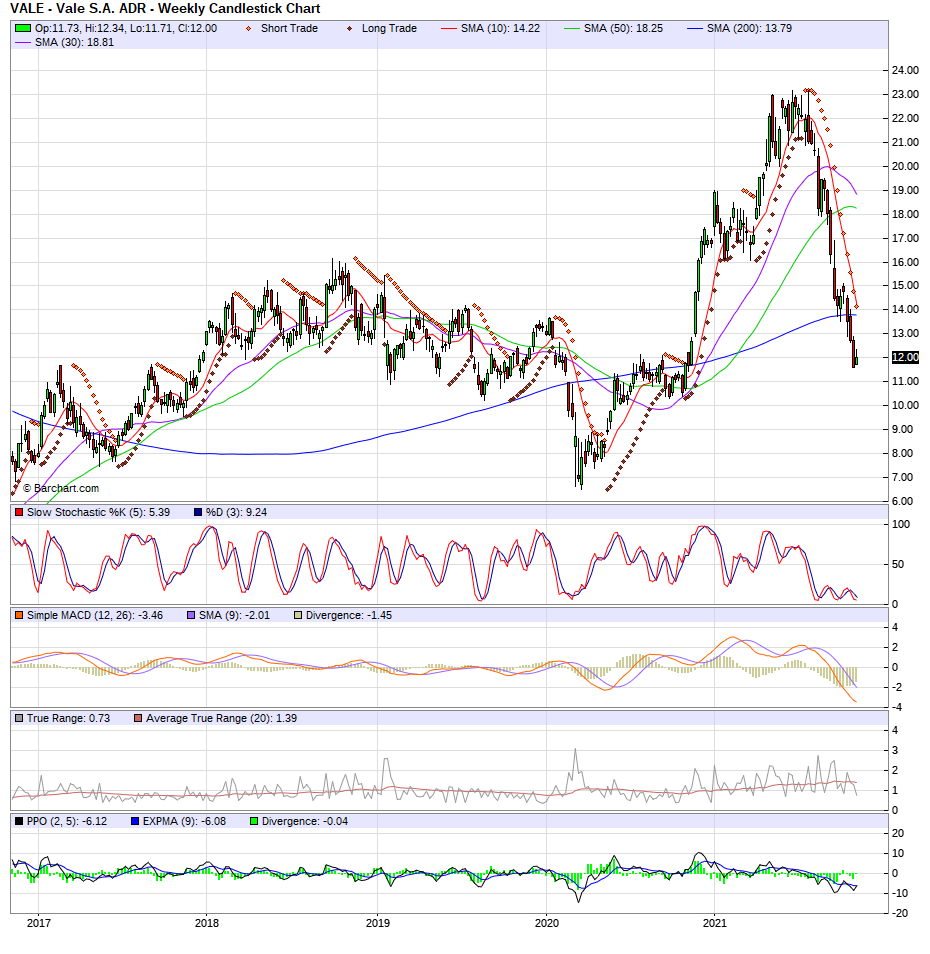
Not to be confused with a one-trick pony, I am always looking for signals in any and all groups to get involved. On that note, some base metal commodities like iron-ore have pulled back substantially. While I am concerned that more economically sensitive commodities might take a break for a year or so after huge rallies they had recently, some are pulling back to levels where I am getting interested at these prices, if not so much in this timing band. I think most of the downside should be behind such stocks at Vale (Brazilian iron-ore, copper, nickel, etc miner), I also don’t expect much more than sharp bounces that sell off again, here and there until enough time passes that they can start another sustainable uptrend. However, with prices so beaten down on stocks like Vale, I have taken a small position to force me to be involved and look for the big turn higher, whenever it resumes. Here are the daily, weekly, and monthly charts, oversold on all time frames, if I was a short term trader, I would buy this one just for a bounce…
Vale daily chartVale’s weekly chart is very oversold and can’t get up, yet!Vale monthly chart, the one I am most interested in, and once the stochastics slow down the momentum lower and cross higher, I plan to take a full position. I will let it form a sustainable bottom on this long term chart before loading a full-sized position.
All in all, things are shaping up nicely for our accounts. I have yet to start acquiring the marijuana stocks, though they are also very oversold on longer term charts, and have not yet added to my China internet giants etf, though a good smackdown in the US markets would have me drooling to buy more, since the Chinese internet stocks like BABA, BIDU, and TCEHY have already pulled back hard. I suspect they haven’t mounted a sustainable rally yet, because they could be anticipating a decline in the US markets, which would likely keep a lid on much upside in the KWEB etf in the near term.