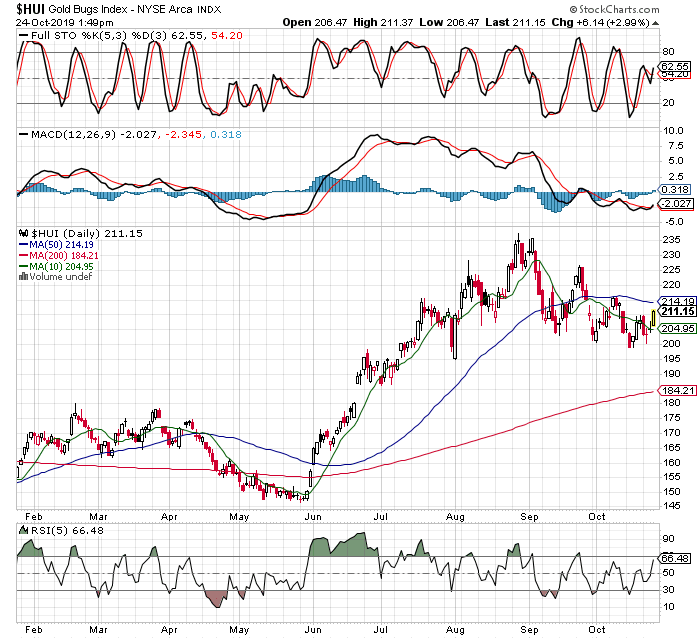
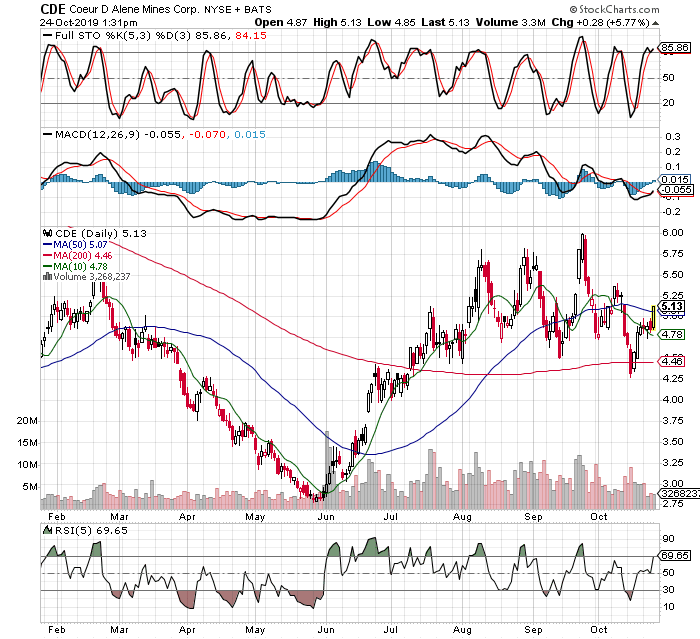
Just a quick post to point out miners might be resuming their trend higher soon, maybe as soon as today. Above we see the $HUI gold bugs index breaking it’s two month downtrend, as while this is no guarantee we are headed back up again, when it does occur, this is how it will start. Now let’s take a look at some individual mining stocks, and note how they are acting similarly. First, CDE…
CDE not only breaking it’s downtrend, its also back above it’s 50 day MA
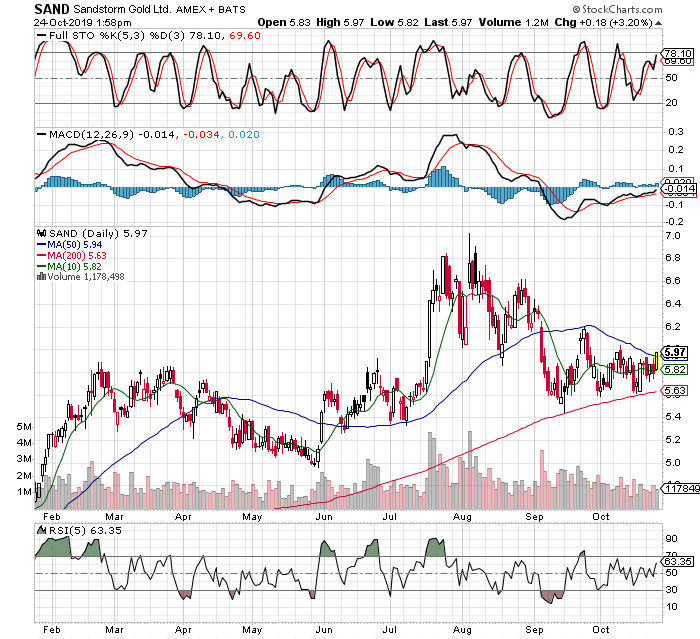
How about SAND…
SAND is doing the same as CDE
Or the larger streaming company WPM…
WPM also breaking its downtrend, though yet to re-take it’s 50 day MA. My bet is it will.
So we see the index and several miners all moving together, only a step or two in front or behind of the others. While we have stayed long throughout this correction, we did manage to add shares here and there into the sharp down days, so now we have the most shares we have had in the trade just ahead of them starting higher again. If for some reason they head lower first, I will use that as an opportunity to add more, as action like today’s is tipping their hand, they want to go higher.
As the charts will confirm, metals and miners have been moving lower again, testing my intestinal fortitude. While it can be uncomfortable, I try to focus on the things I can control, vs. the ebb and flow of markets, they give and they take. I have seen a good portion of my unrealized gains get forfeited, for the time being. People will ask, why not sell at the top and buy back lower, like where the miners are now? Well, if I knew it was a top I would sell, but nobody can know that, and if we see how many times I chose to stay in a trade that looked “toppy”, but kept on moving higher, we would see how the numbers work better by staying in a winning trade until you get your signal to exit. Anything short of your full signal to exit, will find you leaving more money on the table than you would like. In short, it’s costly to the bottom line trying to sidestep what seem like obvious areas to pull back. If it were that easy, all traders would be rich, but we know that is not the case!
Let’s look at a few charts, and start with SILJ, which is now coming back down to it’s 200 day MA, which should be a relatively low risk buy zone. I have funds to put to work down there, but have already started nibbling again today in the $9.20 area, give or take a few pennies.
SILJ and other silver miner etfs approaching their 200 day MA’s
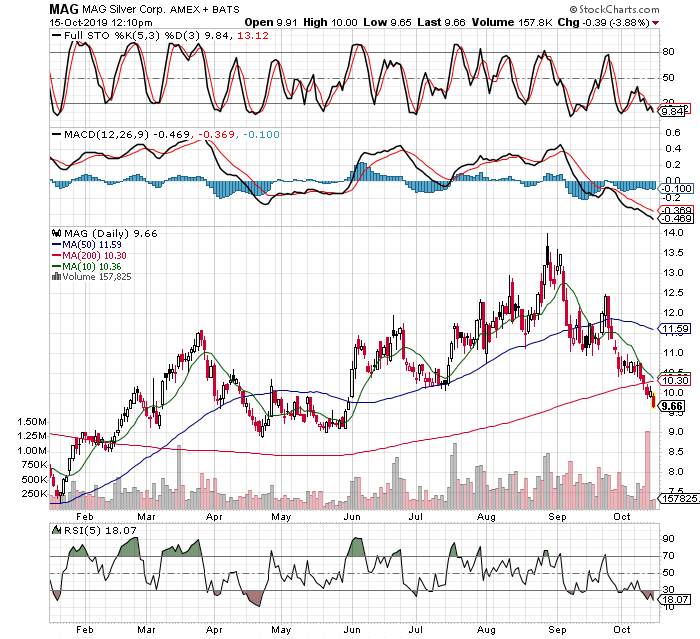
I like this setup, the only thing that I am keeping a skeptical eye on is the fact stocks like CDE, a component of the SILJ etf, didn’t even stop for coffee at it’s 200 MA, instead it blew right through it today. We also see similar action in MAG, another component of SILJ. While one day is not a huge worry, I would like to see these two snap back soon above their 200 MA’s.
MAG even weaker than CDE!
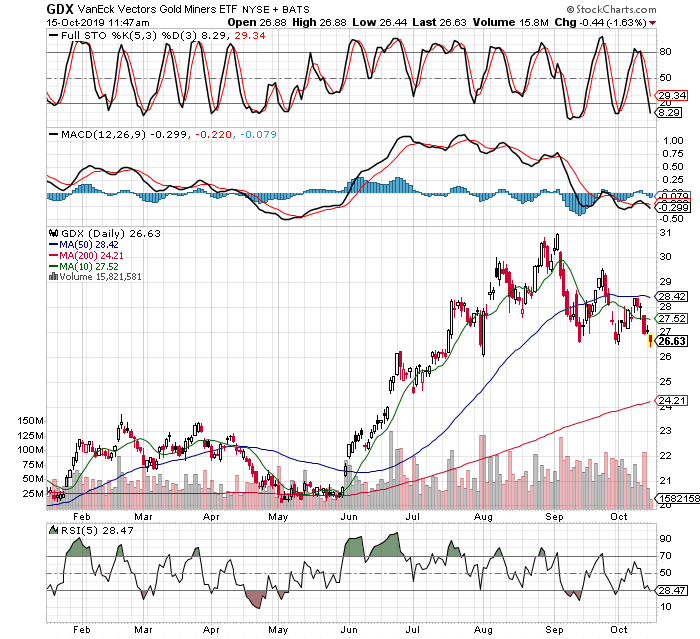
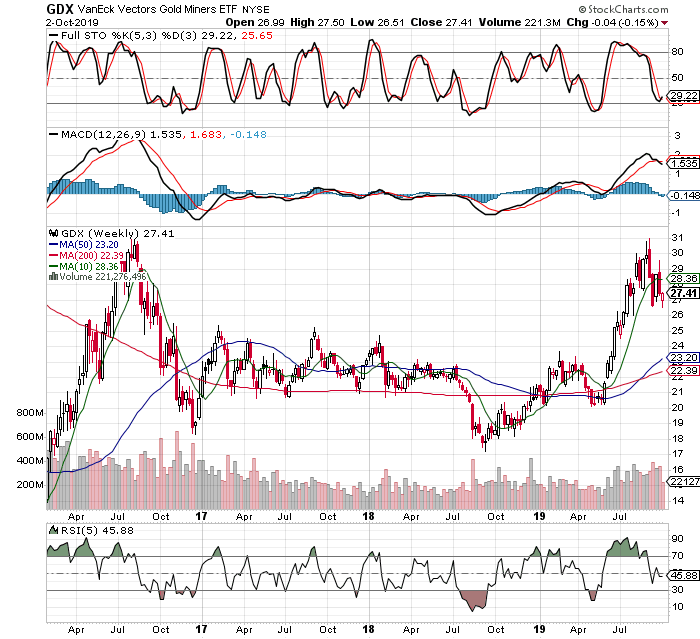
One other small concern is that GDX might not be done making it’s trip lower, and being its the largest mining etf, it can weigh on prices in the group if it wants to go lower before finding a bottom. Still, I see the $26 area as a potential pit stop, then $25.50 as another support, and lastly the 200 MA down in the $24+ area. Let’s hope it doesn’t have to visit $24 before turning higher, but it might so we need to be prepared.
GDX trying to find a support level, several areas below current price might serve it.
And a quick look at GDXJ has me itching to buy. Yes, excited to start adding to miners in the face of all the negativity I am reading now on the group. So many people are looking for $1340-$1370 on gold to be tested that I feel it is unlikely to happen, even if it is a logical area. The fundamentals or new QE money printing, geopolitical risks, and a weakening world economy all support higher gold prices. In addition, my reading on the internet forums shows many of the smaller players not only shorting miners or looking to add to the short side, they have almost abandoned the search for an area to buy and get back on the side of the longer term trend. While many groups appear washed out, like the MJ etf or XOP (energy stocks), they are not yet in uptrends like the metals and miners, as defined by the 50 day MA above the 200 MA, and both sloping upwards. For that reason alone, I will stick with miners and buy/add into these dips. The goal is to have more shares than at any other point in the trade, with positive marks (unrealized gains) so can hold strong, for the next leg up in a bull market.
The general stock market continues to close in on new highs, but if it doesn’t respond to QE like it did the first three times, a weaker market could send miners flying. Not to mention the dollar is starting to wobble up here after a run lasting several years. Lastly, bonds are a flight to safety like gold typically, but even the treasury market seems to be tired running higher after a 30 year bull market. We can’t know what day things change, but we can be positioned in front of it, then enjoy the ride. So while I am getting tested, bruised up a bit and wishing I had sold a bunch of my holdings over a month ago, I still know that feeling is an impediment to greater gains if I let it rule my decision-making. I will stay long and am eagerly waiting to add some sizable positions in the very near term. I did add today very lightly, buying some more SILJ and long term LEAP options on SLV out to 2021, but the sizes are nothing compared to the orders I am readying should we get GDX down to $25 and change.
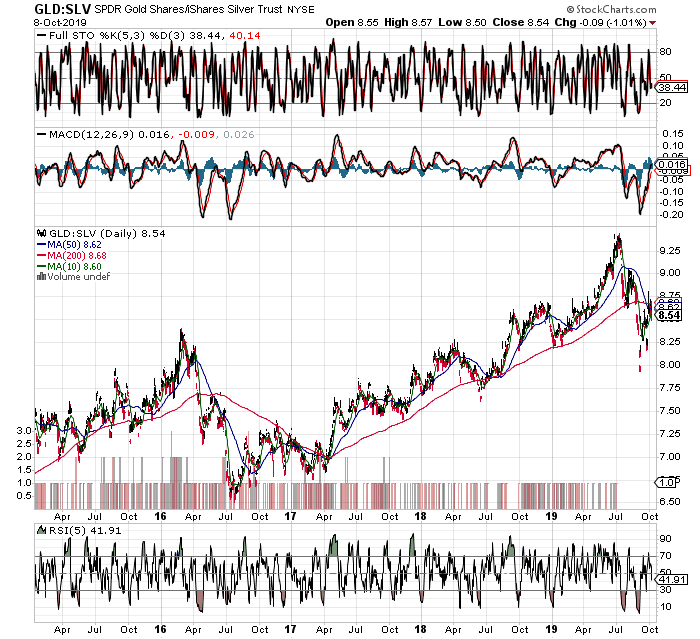
While waiting for this correction play out, I pulled up the GLD:SLV ratio going back to the 2016 bull rally, mostly because I am seeing signs that this pullback either might not go too deep, or last too long. We can see that after the initial move lower in the ratio (pushing miners higher), we still had another drop, which let the miners make another big leg up. Importantly, the second drop in the ratio occurred just after the “death cross” in the moving averages, which is exactly where we stand right now, complete with the rebound higher to kiss the 200 MA. If this played out again, we would see around 3 months higher in another strong upleg for miners. I am not sure where that would put us cycle-wise, especially since Jan to March is the strongest time of the year for silver, I suppose it might imply we could extend the move through March 2020 which would make the move that much larger, but that is just a guess. One last note, if we are indeed in a longer term bull market resumption, that ratio might trend lower for much longer than occurred in 2016. In any case, the worst to happen if we see similar action to 2016 would be a roughly doubling of the gains already made in the most recent run we have enjoyed.
In short, the risk now seems in being out of metals and miners waiting for a deeper pullback to buy. If one is a bull, it might be best to start or add other positions in here, as lots of individual miners are performing very well, and gold doesn’t seem to want to stay below $1500 very long. Regarding the more volatile silver market, the metal has already corrected 50% of it’s gains, landed in an obvious support zone, and bounced with force the last few days, even outpacing gold to turn the GLD:SLV ration lower once again. We also see the miners starting to outperform the metals again, indicating a low is near, or is already behind us.
All joking aside, this pullback in the metals and their miners has been quick and sharp, and we looked to be resuming the upside just before another drop back to the most recent lows. What does it all mean? Probably not much, and here is why. First, we are now in the Chinese Golden Week holiday, and since the Chinese are big players in the gold market and not going back to work until October 9, gold more often than not pulls back or goes nowhere until they return. Second, Monday was the 3rd quarter end, so there is some degree of ¨painting the tape¨ for shareholders of mutual funds and other investment vehicles. After these items pass, it’s back to business as usual. For example, the stock market held up and could not get much downside traction before they closed the books for the third quarter, but just today (Wednesday), the general stock market etfs in the US closed down 2%. Maybe it’s a turn to last for awhile, I don’t know, but nevertheless these things do affect markets in near term. I typically don´t try to sidestep these tendencies because there is always another one around the corner and trying to do so would require constant in and out trading that is very costly over time, especially if it causes one to lose focus of the big trade they are pursuing.
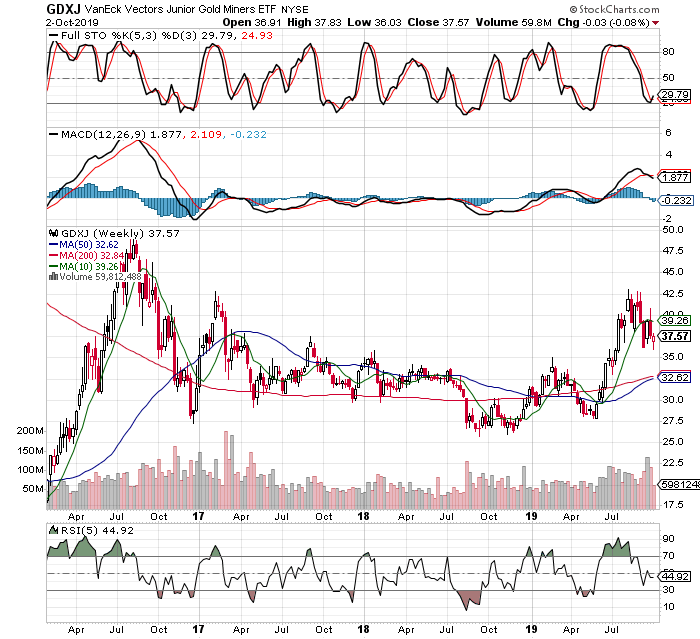
Let’s go to the charts. If we step back a little further than our usual timeframes, we can better see long term support and resistance zones. Here is GDXJ, the junior miner gold stock etf.
Clearly heading or already at longer term support on this chart going back 4 years. Similar for GDX, but could have a little further downside to $25.50 or so, but does not have to go that far.
In the above charts we see both of the biggest gold mining etfs have come down to areas that might provide support, and should do so, if we continue to be in a bull market. I read all over the internet lately that short term ¨traders¨ have booked profits and are waiting for even deeper pullbacks that what I suggest might occur above, before jumping back in with both feet. Further, many are now entertaining the short side of these stocks, which is where I think they go terribly wrong. It’s not just the money they might lose being they are counter trend trading, but they will lose sight of the big picture and even if they can switch back to the long side and trend, will they be able to buy with conviction so that they can load the boat. In my experience it is very difficult to do, but don’t take my work for it, just look at the big fish and how often they jump in and out. I’ll save you some time, they don’t do it very often. Mostly because the big money is made by identifying emerging monster trends early, buying a good amount near the lows, then when they have confirmation they might be correct, they add heavily into the pullbacks like we are seeing now. So what am I doing, well I have nibbled here and there over the last week, but since I am very heavily invested already and sitting on big unrealized gains (albeit not as big as 2 weeks ago), I will wait until either we have violent down days to buy into, or the Chinese Golden Week passes. The third quarter close is already behind us, so I am only looking for places to buy down here, and anybody looking to ring the register on gains has already missed that window, in my opinion. It is time to buy, or sit tight, but definitely not sell if one thinks this is a bull trend that remains intact.
And what about my SILJ? Let’s take a look…
First, the daily chart has pulled back to a potential support area.
Second, let’s look at the weekly chart like we did with GDX nad GDXJ above.
SILJ is almost oversold on stochastics.
While SILJ is not as clear about its trend on the weekly charts, if you compare it first to GDXJ, then to GDX, you can see it is very similar, just late. Both GDX and GDXJ have already turned their long term weekly moving averages to the upside, and GDX has already made it’s ¨golden cross¨ where the 50 MA crosses above the 200 MA. These are not only in uptrends that remain intact, so far, there are relatively early in that bull trend. These are markets where one wants to buy or add into pullbacks, not focus on selling rallies yet, if they wish to make and keep the big money.
All in all, while I agree we might go lower for awhile, from here the downside should be contained. We might not rocket higher just yet, but that is not important, what is important is that we are on for the ride when it occurs, and we have more shares than at any other time in the trade. Check!