Buying B2 Gold (BTG)

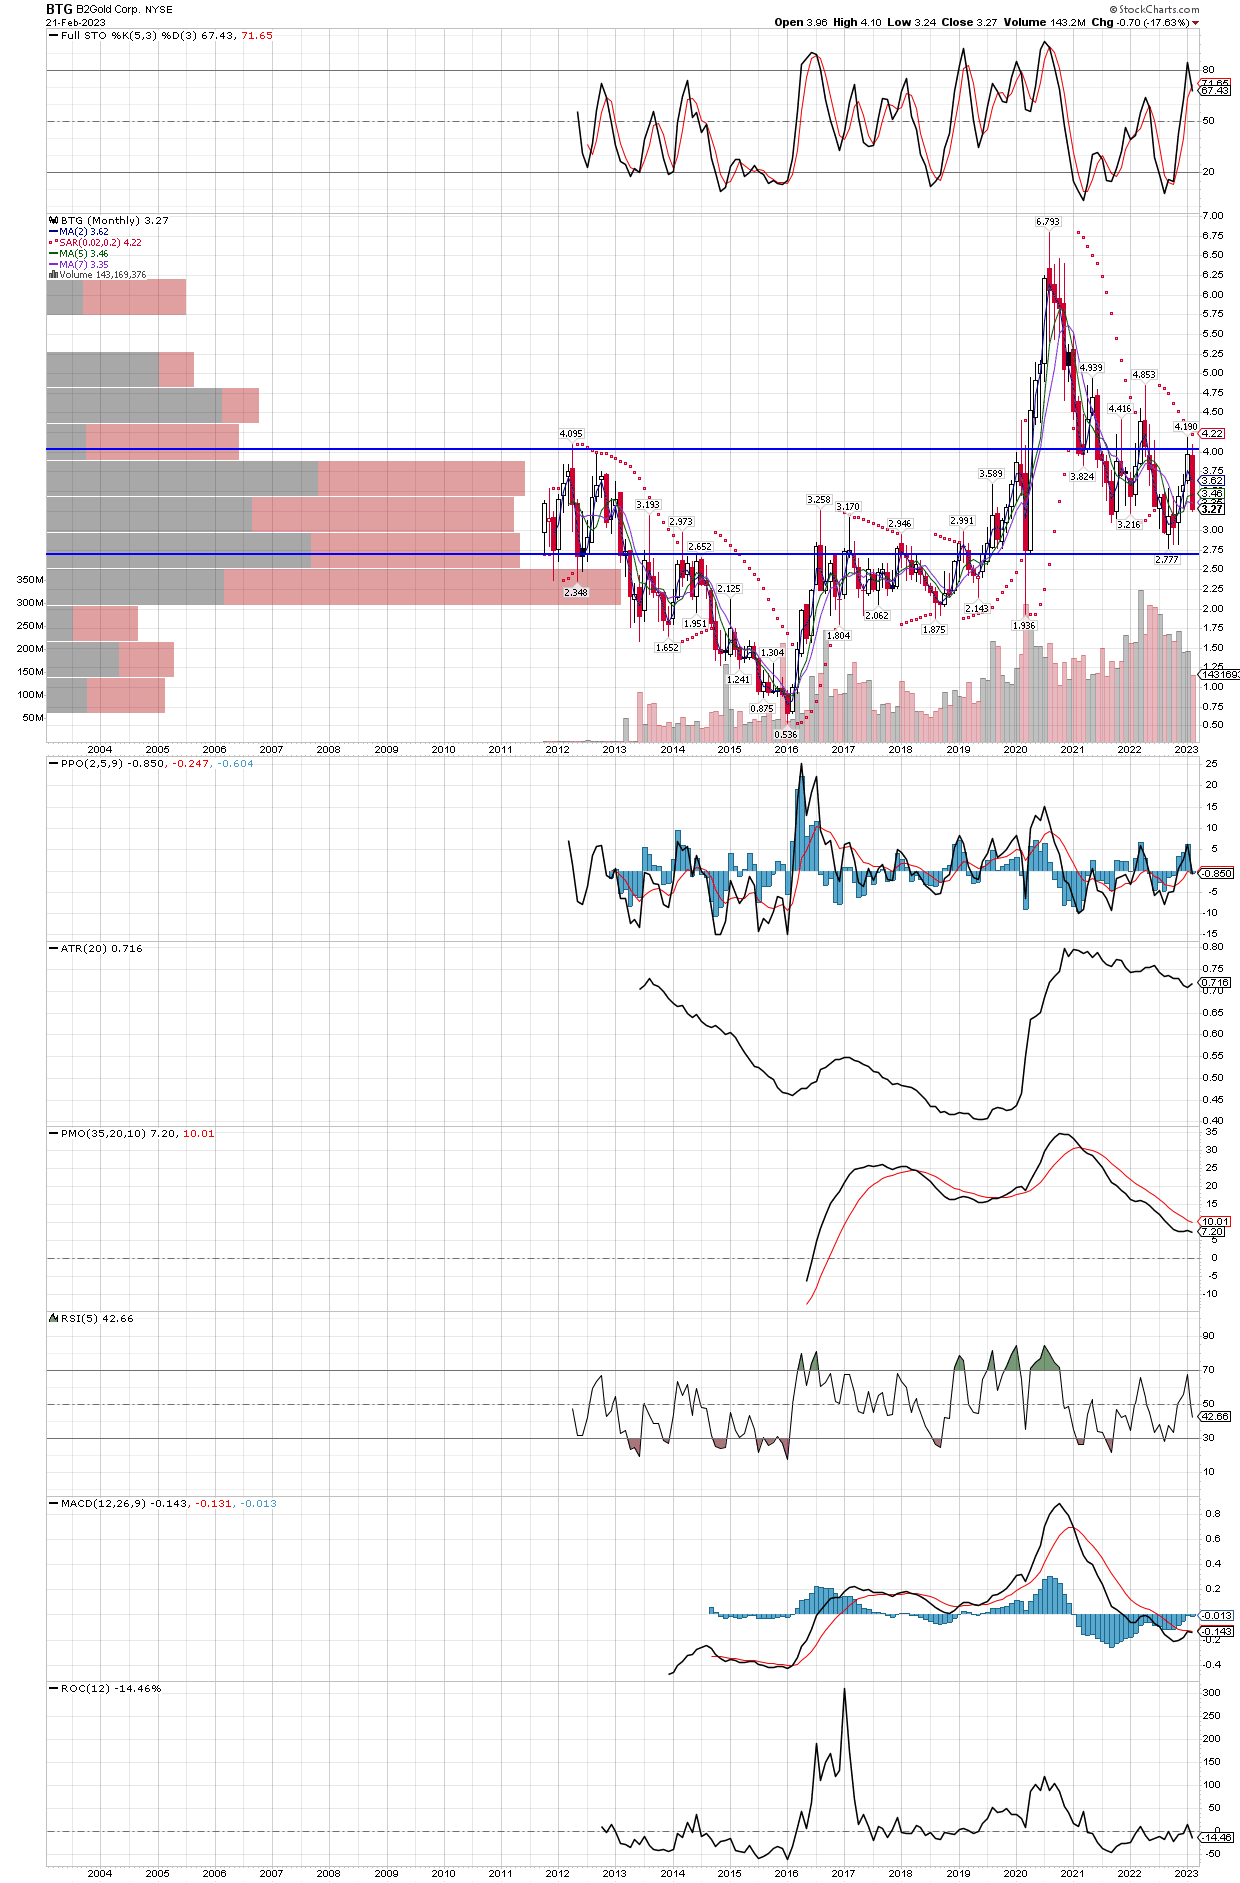
B2 Gold (BTG) pays a 4.82% dividend as of last night’s close, and is in an area I don’t mind buying. A return just to the recent high two months ago would be a 30% gain, and a return to the all time high made in 2020 would be well over a double from here. I like that it made all time highs in the last couple years, it will likely do it again as their free cash flow continues to grow. Below is the monthly chart, and while I prefer the stochastics to be oversold, they still have not reached overbought so the shares still have more upside potential. And the weekly chart does show the stochastics to be oversold already, so I have no problem buying into a roughly 25% decline that has occurred over the last four weeks

Getting paid 4.82% while we wait for BTG to make new all-time highs again

Added GLGDF Today

GoGold Resources has a classic daily chart, nice run up that doubled the price with a typical 50% pull back shown by the Fibonacci retracement, into oversold stochastics. There are several miners sporting similar charts that I am willing to start a position in, or add to our existing positions. Its a lower risk entry in this area, sitting on its 200 day MA as well, so I bought some across all accounts. In fact, the SILJ etf is quite similar, with regards to the 50% retracement, so I might add to it tomorrow morning.

Sitting on its 200 day MA, after retracing 50% of the run higher since November

GDX Buy Signal Setting Up Again

The weekly chart of GDX is close to presenting another buying opportunity. After trimming 16% of our holdings in the precious metals miners the last couple weeks, I am slowly putting the money back to work at lower prices. I added small amounts back again today, but am prepared to put all the proceeds back into miners this week if they and the metals can drop a little more into well oversold technical levels on the weekly charts. I will only buy when the intraday stochastics on the 30 min bar chart are oversold, to help with timing discipline. Here is the GDX, with a horizontal trend line I drew like with yesterday’s silver chart. Note that they look quite similar, which tells me they are more likely to stall their downside move than not, in the areas near the trend lines.

GDX weekly chart gong back 9 years, I feel good buying into this decline.

Silver Support Near $21.50 on Weekly Chart

Just a quick wrap up after another down day in silver and the miners. I pulled up the weekly chart going back 7 years, and one can see the 2016 high around $21.25 and lows in both September and November all are in the same area as where the 200 WEEK MA currently sits (and the 50 WK MA as well). That is good enough for me, and I will add more heavily if silver gets down to my horizontal trend line, but since it might not, I added more shares to my miners today replacing some of what I sold recently.

If support on the weekly chart is reached, its only 75 cents below today’s closing price. Both the 200 WEEK MA and the 50 WEEK MA are a few pennies apart and should act as support, not far from the 2016 high.

Correction Underway For SILJ?

As mentioned in prior posts, trend lines are highly subjective so should not be relied upon as the sole basis of buy and sell decisions, however they do give general areas that might provide support and resistance. Keep in mind this chart of SILJ is form Friday’s close, so using the last tick as the final connecting point is risky, we could easily see SILJ trade below my trend line, even down to the 200 day MA in the $10.27 area. Being miners are in an overall uptrend and have been the strongest performers over the last quarter, my bet is the uptrend will remain intact and that dips should be bought. We also woke up to news that Newmont Mining has made an offer for Newcrest at a roughly 25% premium to its closing price last week, so the biggest miners are still looking to acquire others. Interestingly, the media reports that this could spark more bids for Newcrest as the buyout offer is widely thought to be too low, all good news for the group as a whole. I began adding to positions again Friday afternoon before the close, in the miners I recently trimmed (sold 16% of holdings recently), and will continue to buy more as the intraday technical readings reach oversold on the 30 minute bar charts.

Bought some SILJ Friday near the close, and will add more this week in this area, and down near the 200 day MA if it can drop that far.

SIGN UP FOR UPDATES

NO SPAM, EVER!