I try to keep balanced, and that means also posting article in which I don’t agree with the actions taken, like the following. Phil Streible recommended clients take profits this week, telling them to “sell the rip”. Notice he observes silver is performing better than gold, and that he is looking to get back involved, so he is a bull without his positions is how I see it. Its easy to get convinced to take profits, especially the relatively small moves “a rip” higher, but I have found that while cashing out early works 7 or 8 out of 10 times, it leaves one on the sidelines for the biggest and best moves, the ones that change our entire financial future. The old adage is let winners run, and it still applies in my trading, most of the overall gains in a portfolio come from a few big winners, and we have to be in them when they fly. In short, if I am going to try and skim 5% returns here and there, far easier groups to trade can offer up those opportunities, but that is just one man’s opinion. It does seem the biggest, most successful investors don’t jump in and out of their holdings, once they have formed an investment thesis.
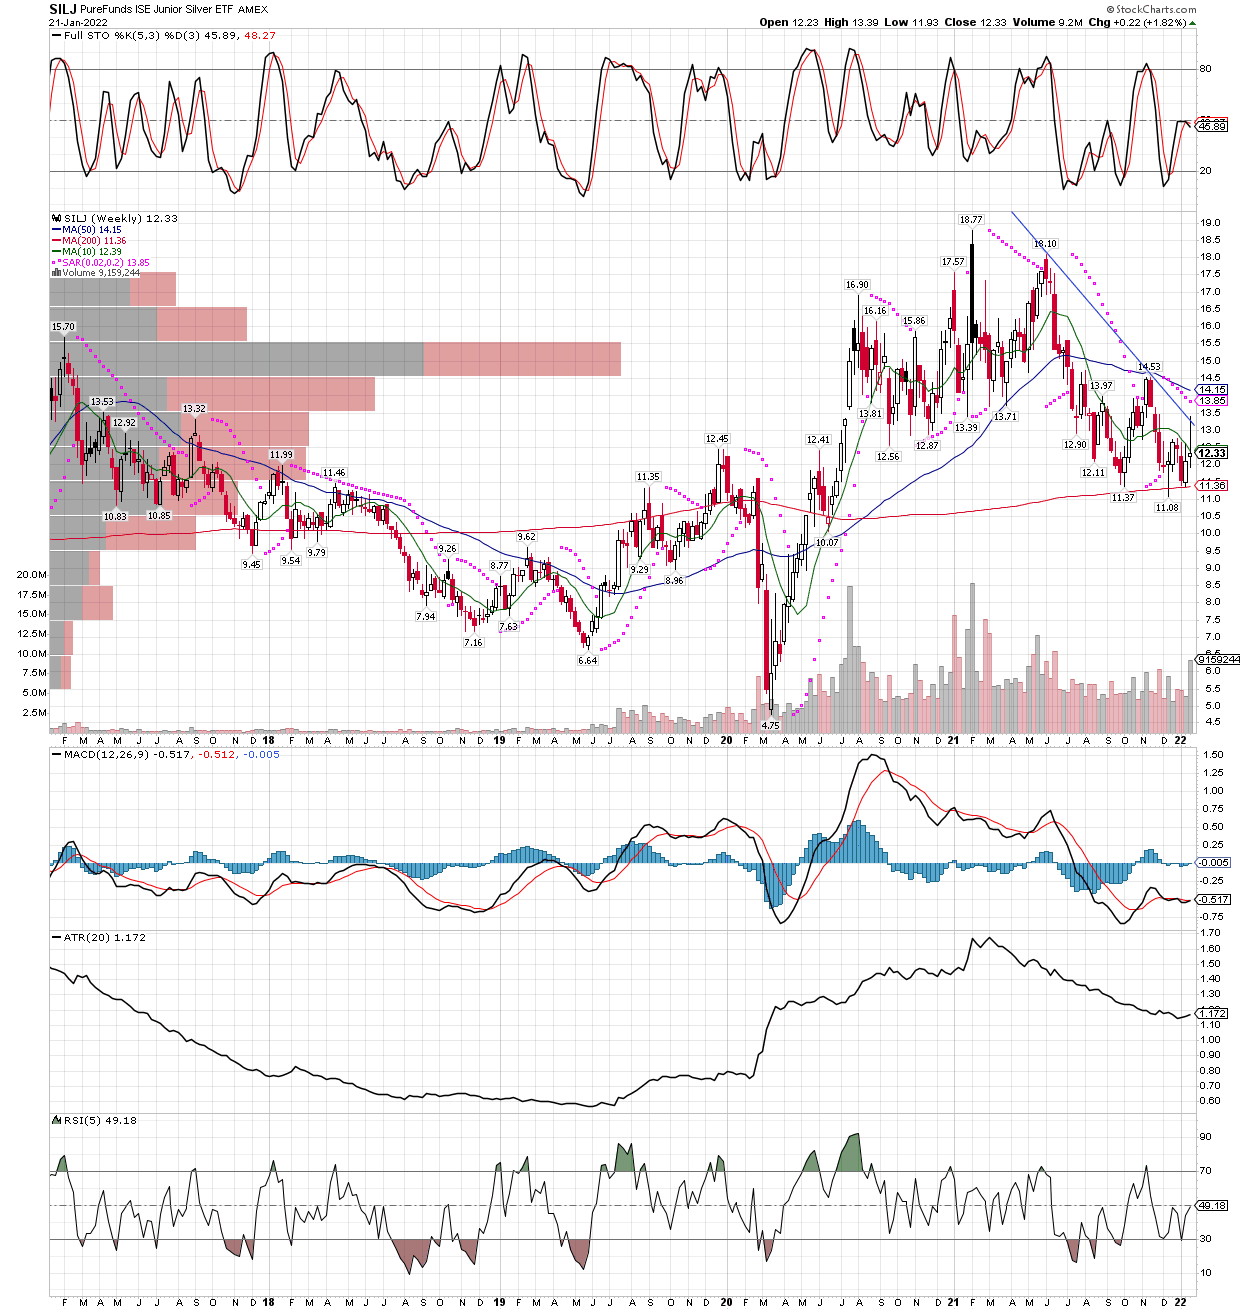
I think this week might have changed how metals and miners are being perceived in the markets. Not only were there huge gains one day this week, in the face of weak markets overall, but the volume in things like SILJ has doubled, showing renewed interest in the sector. Thus, I will continue to look for windows to add to positions. Here is SILJ’s weekly chart…
When SILJ gets above that down trend line, it should easily take out it’s high up near $19, and it might occur quickly as well.
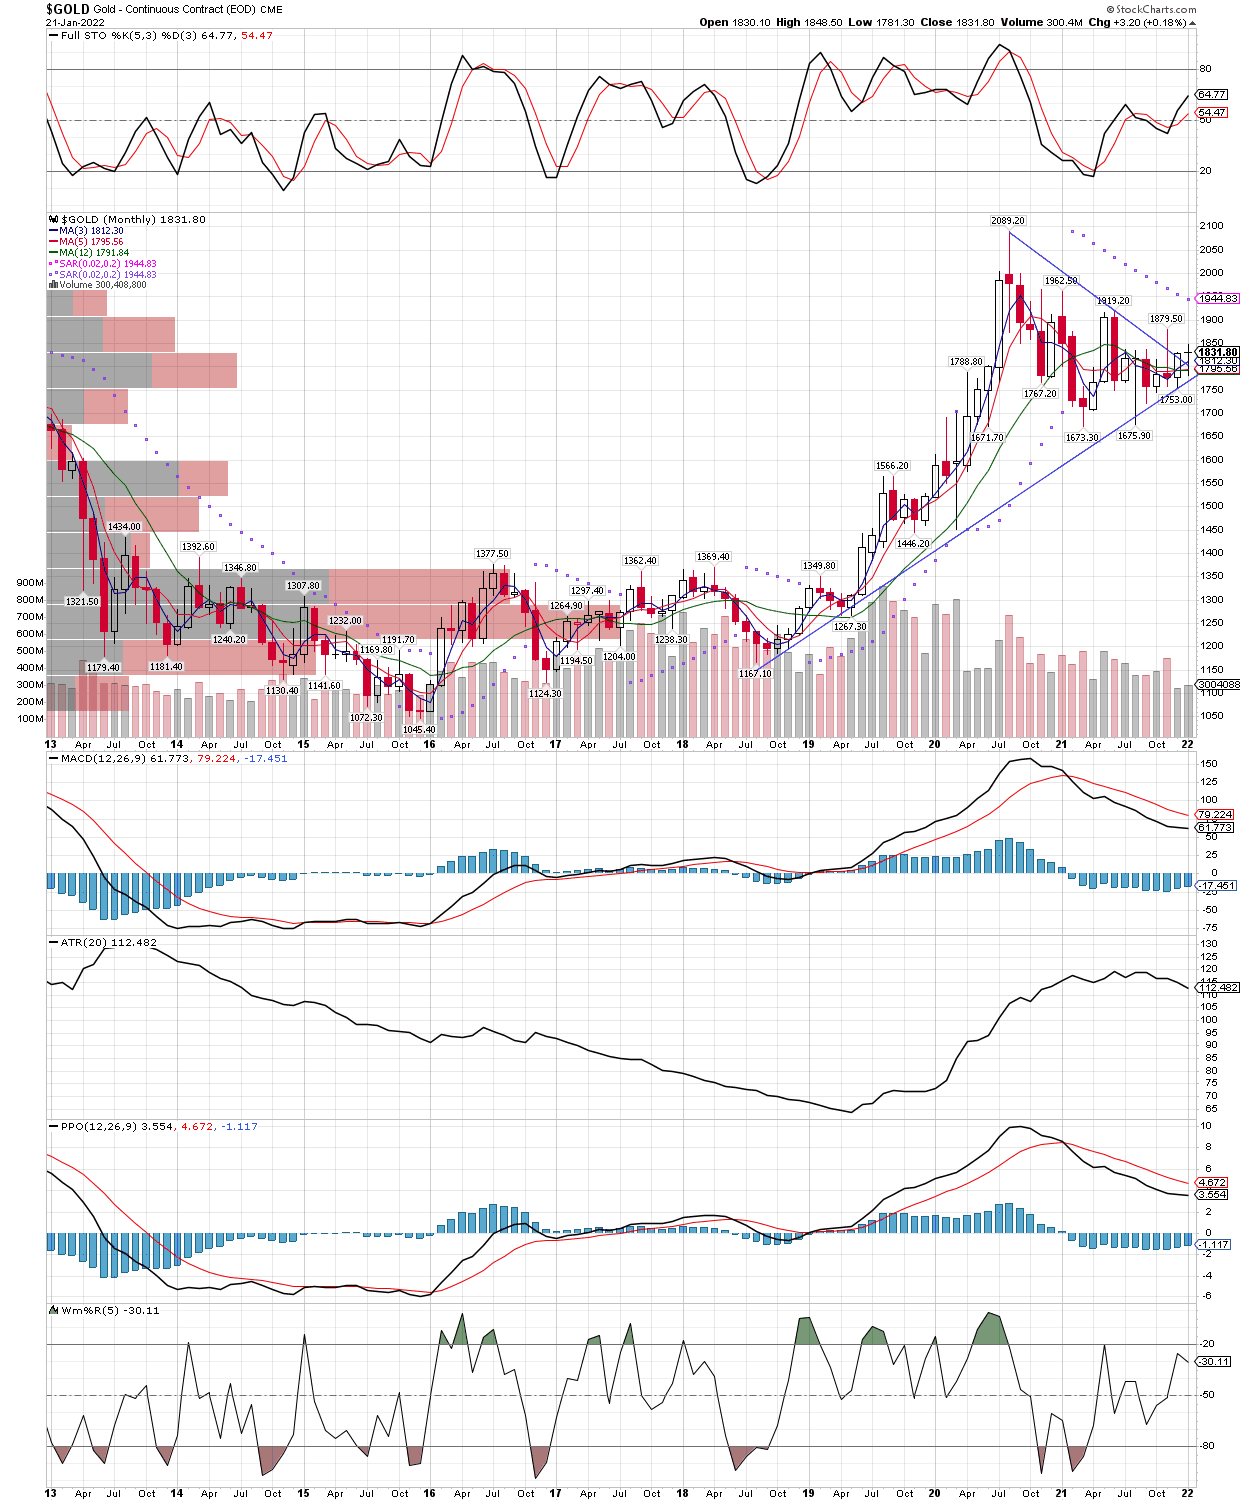
Just a quick chart that could turn out to be important, if the breakout higher out of the triangle can hold, the next leg of the bull in gold will have started. Also note the MACD and PPO technicals having been oversold for a long while now and trying to turn higher, while the stochastics are still far from overbought. All this, on top of the GIANT cup and handle pattern seen as we step out further, like on a 20 year chart. I don’t have to post the cup and handle, its all over the internet now, but here is the. triangle breakout below.
$Gold futures are just starting to breakout of this large triangle, yet still investors are afraid to get involved. It’s the beset of all worlds, if one is able to act early on what they see, rather than wait until its overly comfortable.
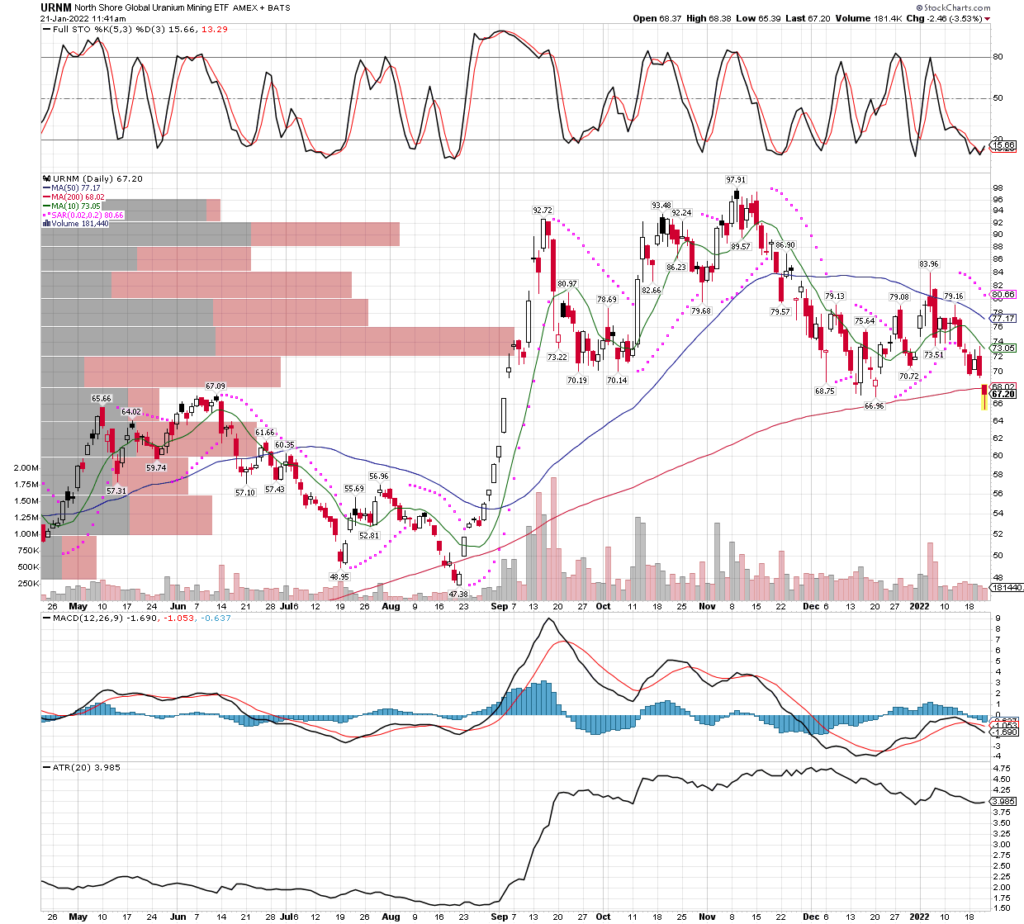
Markets are pulling back sharply on the excuse of Netflix´s earnings, but man things are being dragged down alongside NFLX, including my miners. I took the opportunity to add to my SILJ etf, and will show some charts below. Regarding my shorter term intraday signals, I didn´t take any signals today because the miners are my priority and they were presenting a buy area for me, so they had my focus. However, I got buy signals on both the URNM (Uranium etf) and XBI (Biotechnology etf), and both have worked nicely higher from the paper entry price, so I look forward to using this short term trading system again, while staying invested heavily in precious metals miners.
Below, I will post the URNM daily chart, XBI long term monthly setup, and the SILJ chart I used to add to my positions today.
URNM daily chart, this etf flashed an intraday buy signal on the 30 min bar chart, and has bounced nicely since then.The XBI Biotechnology etf also flashed a buy on intraday charts, but I am more interested in the longer term signal the MONTHLY chart is getting close to flashing. It’s not quite there yet, but encouraging to see this etf bounce when the selling pressure in markets subsides during the day, could mean this one is close to being washed out. Still, we will wait patiently for the signal to occur before taking a long term position expected to be held 6-10 months.SILJ´s daily chart shows it pulling back to near its 50 day MA on the second day decline in a row after a huge run earlier in the week. That big move up and the volume that flooded into the sector I think will prove to be a defining moment, as big money starts to move into the miners and metals as we near the FOMC rate hiking parade. Today I added in the form of long term LEAP options that don’t expire until Jan 2024, exactly 724 days from today, as my trading platform likes to remind me. I added to my position in UNG (natural gas etf) yesterday, after seeing the stochastics on the daily chart reach oversold. I am not yet up to a full position on this trade, so I’m still looking to add into pullbacks. This is a longer term setup, weekly overbought at a minimum before I consider selling any portion, which would only be half, if I am able to be in a full-sized position before it takes off. Like SILJ, the UNG etf took off sharply higher right after I started to buy it, only now a week or so later has it pulled back enough that I feel comfortable adding.
I haven’t had much to report, being I have been getting shelled and just trying to manage my psychology so that I don’t make mistakes or act out of fear. On that note, I have tried to keep accounts accurate as to positions by reporting when I make transaction, but few have slipped by. Overall, my holdings and stops page on this site is quite accurate, except for a couple small sales I did in SILJ to keep accounts margin compliant, and not in risk of forced liquidations. Yes, it got scary there for a little while, but anybody that knows metals and miners knows they move quickly in both directions, and just a week or two later, we see an 18.8% gain today alone, on top of an already decent week. In short, I did not sell any more than I absolutely had to, because I still think this trade will work out well in time.
I remain in the trade because I am starting to see things fall into place in other areas of the markets, not just up days in the miners. For example, the general stock market now goes down more often than it goes up, and when its up, its either inconsequential or it can’t hold the gains and sells off. Today was another example, while stocks didn’t get clobbered, they couldn’t rally all day, only to sell off sharply into the last few minutes before the close so that the QQQ´s ended down over 1%. Likewise, previous supposed competition for gold, the crypto stocks also cannot hold a bid. Bitcoin used to jump thousands of dollars per day, now it can’t bounce much when it is due to bounce, and if it bounces, the rallies get stymied by selling. Bitcoin keeps hanging around the important $40K level, but acts like it has work to do on the downside before it mounts any serious rallies, likewise with many cryptos. A third note is the US dollar fell out of bed rather quickly, faster than I had anticipated to be honest. Readers know I am not a big fan of using the USD charts to predict where gold is going, mostly because the USD index is just the dollar vs other fiat paper currencies, not gold, so to me it seems of limited use. But since many do watch it, there is a bit of a self-fulfilling item there, and in any case, the US Dollar now has a failed daily cycle which also might lead to an intermediate cycle decline, or some have even said a yearly or 8 year cycle decline. Imagine that, how quickly things change, when just a few weeks ago NOBODY would consider touching a miner, today they appear to be the only game in town!
As far as new positions and closed trades, I took profits on a long-side trade in Vale LEAP options, and have also started a position long in the UNG (Natural Gas etf) LEAPS. I will continue to look to add to my Natural Gas position as it triggered buy signals a week ago on both the MONTHLY and WEEKLY technical charts. I will also look to add to miners on dips, since they arer the group that just came into focus, no need to dump the idea of buying miners so soon, when this move is not only just starting and in the seasonal strong time for the group, but the move could also be huge, if it turns out to be the beginning of the last and biggest leg of the bull market. Its too soon to tell, but we don’t want to leave this idea too soon, just because it put us through some pain for awhile first. It’s just part of the game, and we must do what we have to, in order to stay balanced and focused. I will admit that this setup (miners and precious metals) has tested me more than most, being I am more heavily invested in this group than I usually would go, being I anticipate the Federal Reserve bank to start raising rates soon and that has always proven good for miners, especially in this type environment with low rates and slowly rising to stem inflation. I assume, maybe mistakenly, that they will keep their word, but so far the markets seem to be believing what they say.
Now that we are getting some action, I will once again promise to be more active on this site. Not only should I have plenty of action to report on the miners and metals, but I see some old, short-term trading methods I used in the past starting to work again. These setups are signals off the 30 minute bar charts (intraday), and typically last 3 to 5 hours and can extend into the next morning, at times go as long as a couple days when they really work well. I see these setups presenting themselves once again, so am happy to take the trades as the signals come, I will report all buys and sells here, along with my account statements as always.
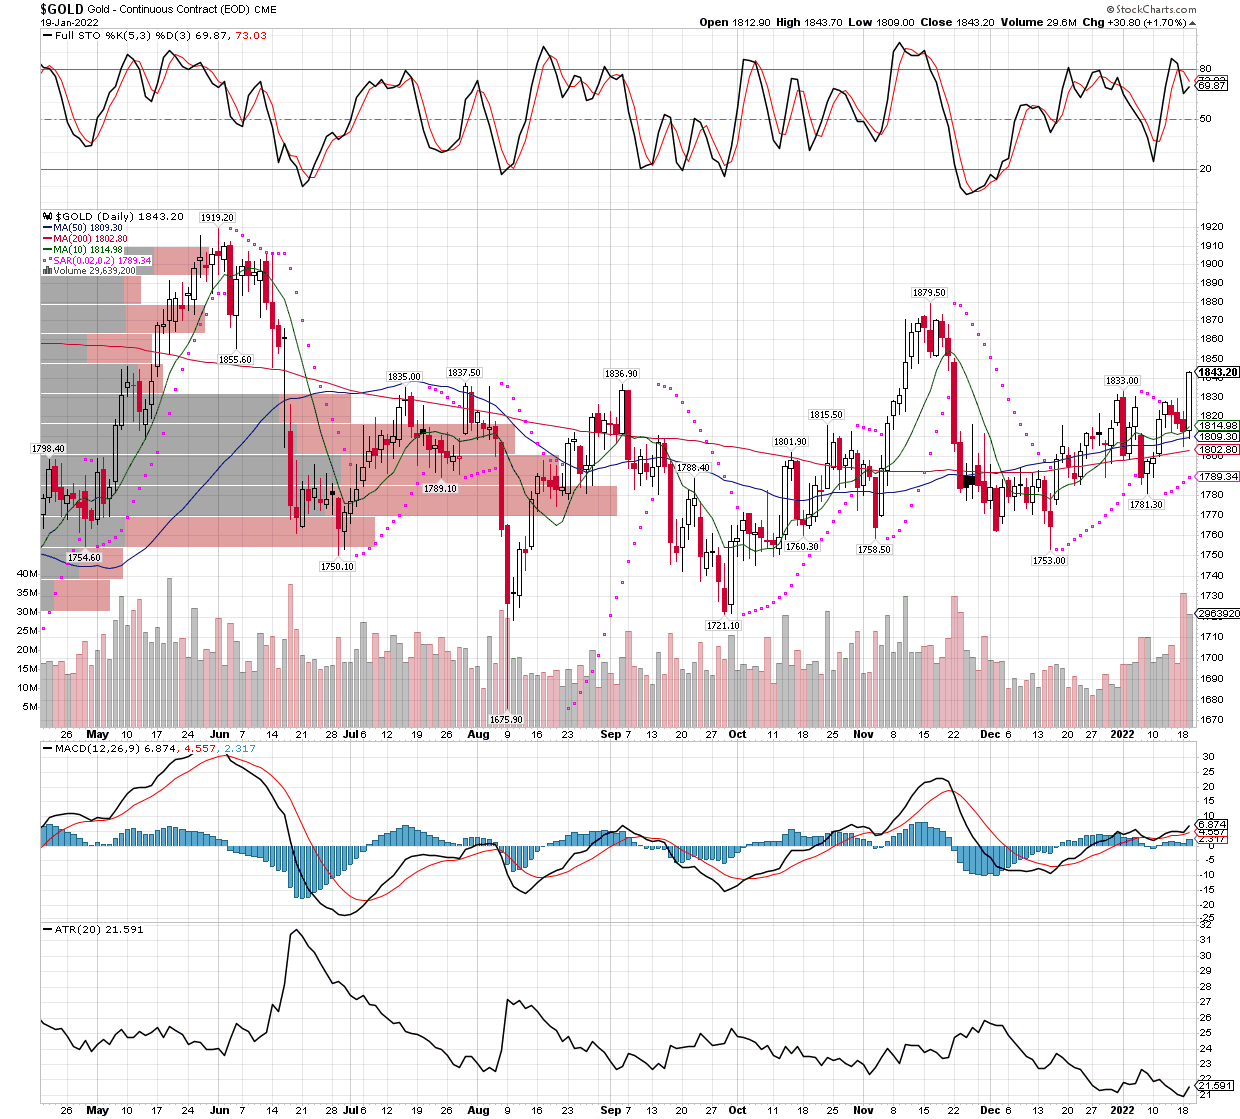
I am also see some breakouts form significant levels and patterns on the charts I have been watching most lately. For example, gold is just now breaking out (today) from its triangle pattern going back to the high in made very early in 2021. Silver is also taking out important levels and the next stop should be the 200 day MA just above, while miners made new recent highs, and gold, silver, and miners all made big gains on quite heavy volume, lending credence to the move up. Even better, according to Michael Oliver, whose work I respect greatly, silver is now very close to a weekly close above his trigger levels that would confirm the next big move up is about to begin. Since his is a paid service, I will just say it’s not far away, probably less that 30 cents away from today’s close. We also see gold is back above all three important moving averages, the 10, 50, and 200 day MAs, and broke above the most recent high at 1833, suggesting we are back in an uptrend. Regarding the moving averages, please note they are not only all sitting on top of each other in perfect order, the shortest term above the 50 day, which is above the 200 day MA, they also are starting to spread out from each other. While that is not a guarantee this will be the BIG move, it is how the biggest moves begin. The Volume by Price horizontal bars also suggest gold has just cleared its biggest resistance areas as defined by volumes traded in that range. There are too many charts to show readers to catch up in just one day, so I will leave you with the $Gold futures daily chart since everything else in the group is driven mostly by gold. Over the next few days I will not only post charts of specific miners and etfs, but also other timeframes for both the precious metals and miners, since I am most interested in the longer term setups on this trade idea.