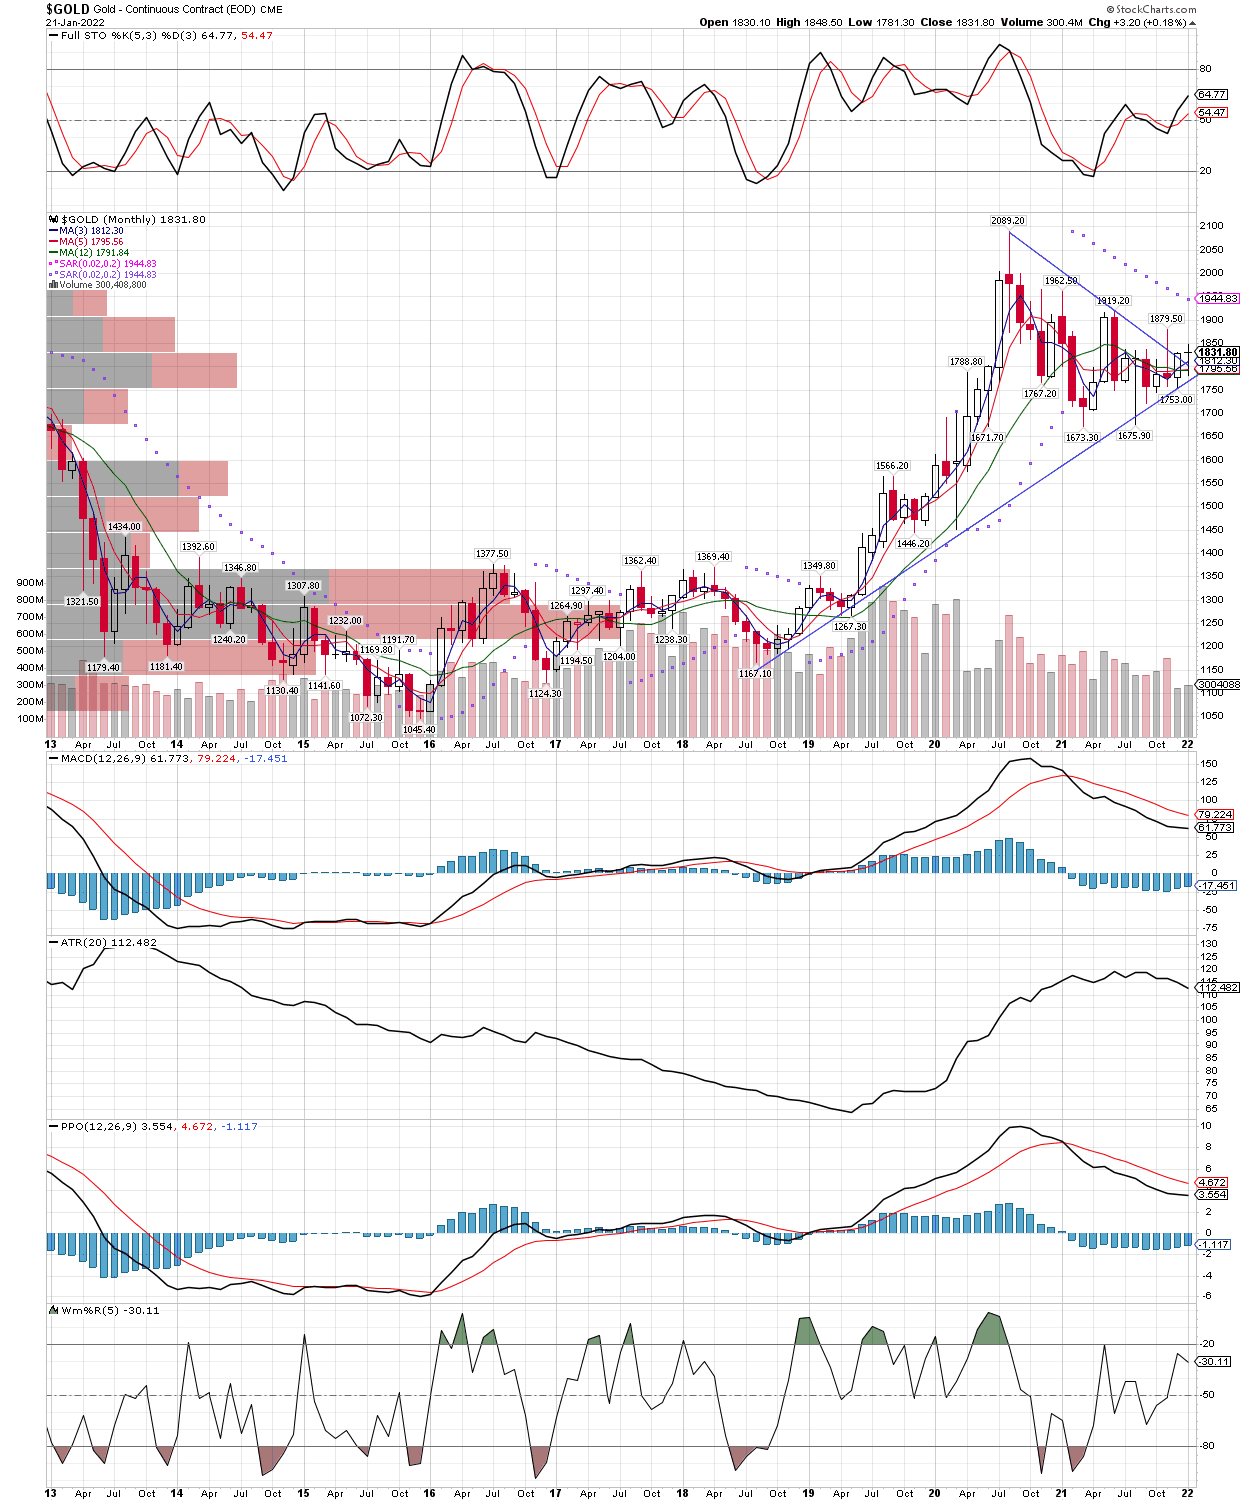
$Gold Futures Long Term Breakout from Triangle on Monthly Chart
January 22, 2022
Just a quick chart that could turn out to be important, if the breakout higher out of the triangle can hold, the next leg of the bull in gold will have started. Also note the MACD and PPO technicals having been oversold for a long while now and trying to turn higher, while the stochastics are still far from overbought. All this, on top of the GIANT cup and handle pattern seen as we step out further, like on a 20 year chart. I don’t have to post the cup and handle, its all over the internet now, but here is the. triangle breakout below.