Trendline break higher

Downtrend line from recent high around $14.50 in mid-June now broken to the upside.

Forgive my chart not showing the down-trend line from the mid June high until last Friday, my chart service wouldn’t allow me to save the annotated chart, but it’s easy enough to identify on the above chart. You might ask why I post a chart of the silver etf SLV? Some have been concerned in the recent metals rally that silver has not kept up with gold, and this is true for the moment. Then days like to today start to occur and silver outpaces gold, and with the trendline break higher, it can bring in more buyers that were waiting for confirmation before getting involved.

The break higher doesn’t mean we can’t pull back in the near term, but it does mean that would be a buying opportunity if it occurred. We still have the overbought daily stochastics in miners to contend with, trying to pull them lower to correct, but I am happy with how the leading GDX and GDXJ etfs hang right up by their 52 weeks highs. There don’t seem to be many sellers, so once we stop the train and let a few nervous bulls off, it looks like the miners are building steam for the next push higher. I remain all long and on margin in SILJ, MUX, WPM, NVO.V, IRVRF and others, looking to add into corrections when they occur.

Information overload, and what to ignore

Too often I see traders and investors running from one indicator to another, or marking up their charts with twenty different technical measures, thinking it gives them the edge. After all, more is better, correct? Actually, no, it not only becomes difficult to follow, the more indicators and advisors one listens to, the more likely to receive conflicting signals and advice.

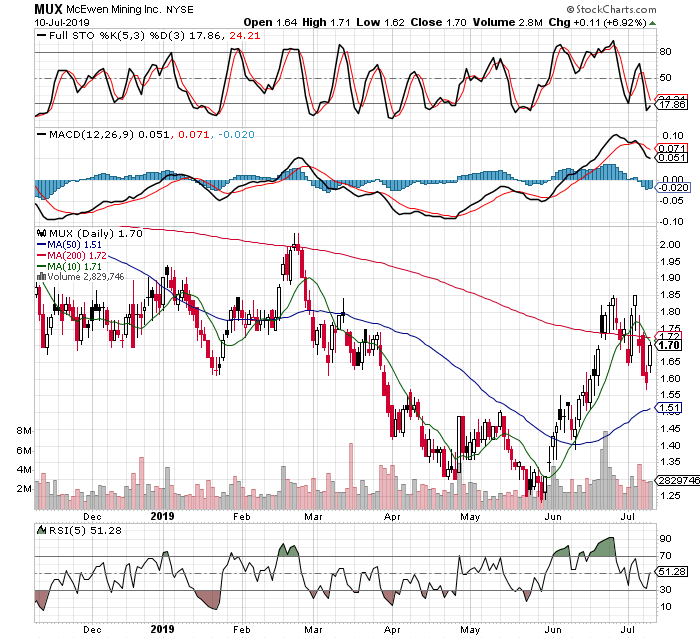
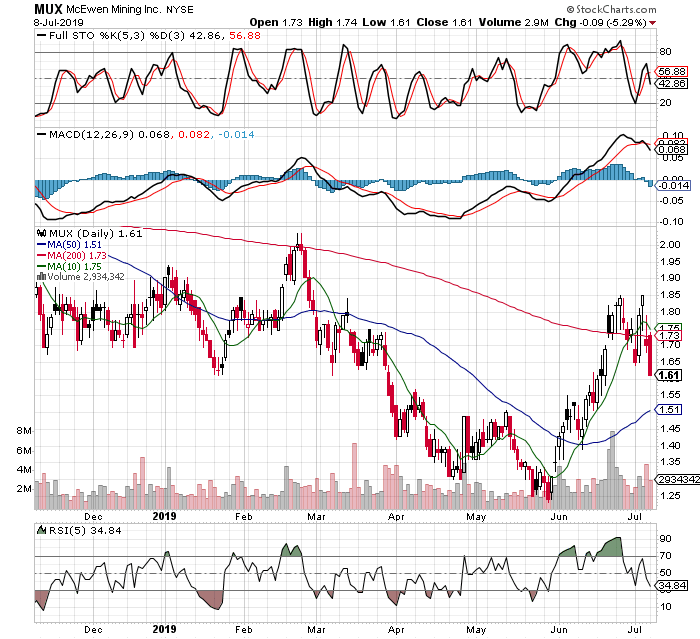
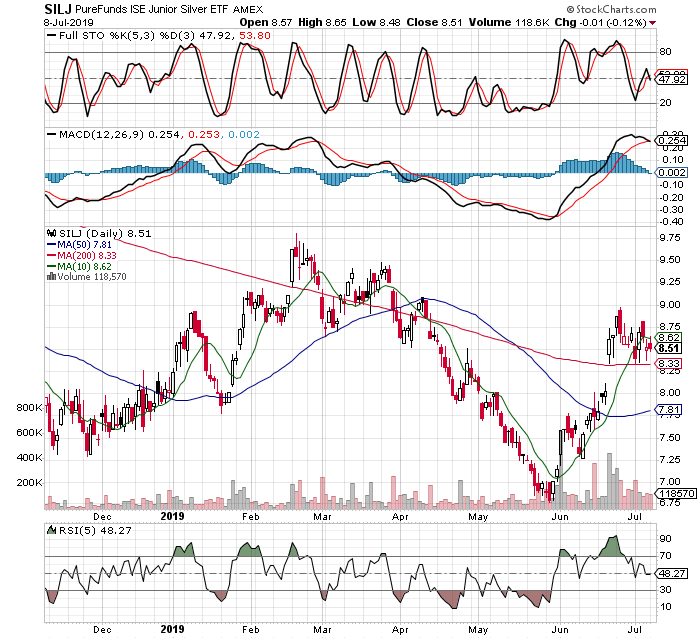
Why do I mention this today? Well, I find myself in a good trade right now with the precious metals mining stocks, and after a good run there are naturally many people looking for reasons to sell. Using sentiment can be very useful, but we need to remember in what environment the data occurred, for example, extreme negative sentiment is a good buy signal usually, but even more so if occurring in an overall bull market for the group. Applied to my current positions, I like the overall setup and everything seems to be falling into place, except for a couple negatives that are popping up. Suffice to say, I am NOT changing my positions by selling out, but I want to show you some crosscurrents and things that could easily shake a trader out, especially after nice unrealized gains have been made. It is too easy to find reasons to ring the register, nobody wants to see unrealized gains vaporize. This week’s negatives are the COT report (Commitment of Traders at the COMEX exchange), and some long time bulls are now calling for a substantial correction before the bull resumes it’s trek higher. These long time bulls still think miners go much higher, but they have decided to sell some or all of their miners, int the hopes of buying them back cheaper at a later date. Guys like Adam Hamilton from Zeal llc come to mind. I respect his in depth analysis, so this is not meant to pick on him as I find his work well worth reading, however we all have to make our own decisions and we must know that nobody gets it 100% right all of the time.

If we are truly in a bull market of for gold and silver, then it is not only just getting started, but we have a long way higher to go. To me, the risk is in being left behind, so while I agree with Adam Hamilton that a pull back could come at any time, I will not try to dodge it because it might not come, or it might not occur until we are already at much higher prices. The point is I don’t want to get too fancy and trick myself out of positions, since I think we see much higher prices over time. If Adam can get out, then back in again at much lower prices, his returns will be far better than mine. However, he has a big decision in when to buy back in. What does he do if miners pull back only 5% before heading up again, where does he buy, and even that is only known in hindsight that the correction was 5%. What if the miners go 10% higher next week, then start the correction? At what level will he know to buy back in, after a 5%, or a 10%, or 15% correction? What does he do if the group just keeps marching higher slowly, gaining 2-3% per week, after he has cashed out a month or two ago? To me, the risk of being out of positions on a good call is just too large to handle. Ringing the register feels good, as if you have “locked in” gains, but you don’t really know that until you discover at what prices you bought back in. Only then can the trader know if he made more money by hopping in and out.

Two quick points to wrap it up. First, if you want to be “big time” you have to think like the guys in the big leagues, and you have to make decisions like they make. I can assure you that most of the whales in the markets did not make their money hopping in and out, for proof just know that the markets couldn’t possibly digest their order sizes without pushing prices around to their detriment. The whales will always tell you that they need to get in and out when the markets let them, they need significant retail order flow to dump their huge positions. Warren Buffett is an ultra-long term investor so maybe not the best example here, but we can agree he is immensely successful and among the best investors, and he for sure does not sell a stock at every whim, just because he is already up 20% in an idea. He fully realizes that what goes up goes down some too, but he is willing to ride the move lower in order to wait for the next push to higher highs. Contrast Buffett’s trading behavior with any free investing forum online, where the little fish, at home day traders are talking all day about every wiggle in their favorite stock, counting the dimes made and lost by the minute. It will quickly become clear which is the better approach, jumping in and out, or riding a bull fully that you were “lucky” enough to identify early.

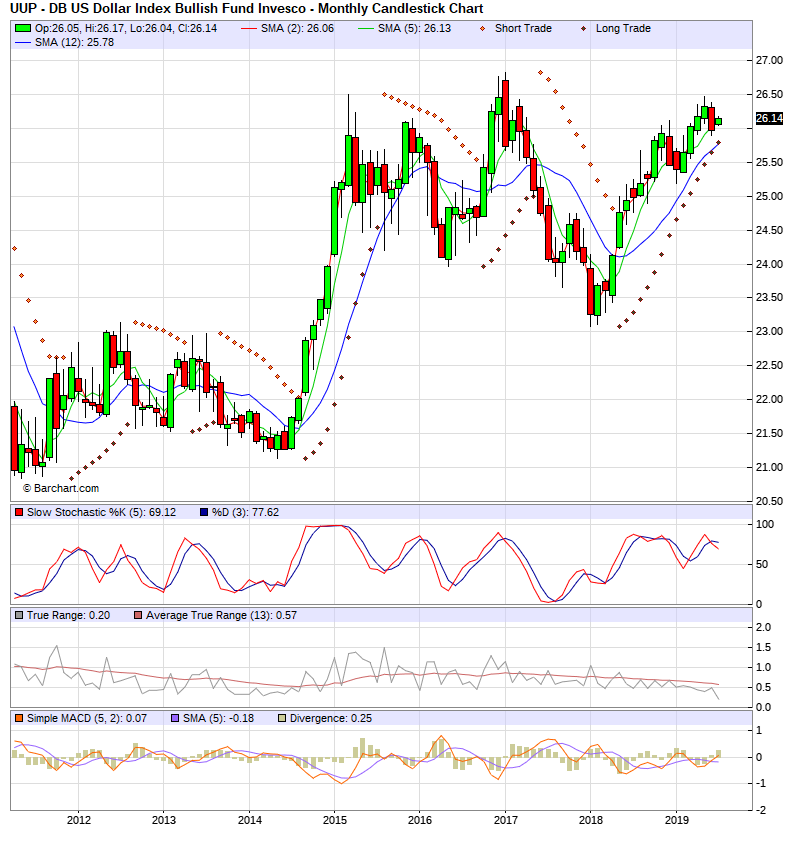
The second point to make is that I will follow my own rules to get me into and out of positions. If we constantly remind ourselves of this, it becomes easier to read unsettling opinions or predictions that are opposite of our own. I realize I know as much, or almost as much as anybody in the markets, and that is good enough to rely on. If I used the long term monthly stochastic to give me the buy signal on the miners, then I will rely on the same technical indicator to tell me when to exit. I let whatever indicators that got me into a trade tell me when it’s time to sell, it’s simple and refreshing because I don’t have to second guess my decisions. Yes, I see a good argument for the move higher to pause or even reverse for awhile, but I do not see a clear way to guarantee I am back to fully invested and on margin if I cash out my gains today, and since my indicators suggest we will see higher prices for miners in the future, all I need to do is stay invested!

A day later, and we are off to the races again.

I will try to post more frequently, but I hate to write just for the sake of putting up material, it’s a waste of everybody’s time. Perhaps in the future I will write about the many other aspects of life that are just as important as trading, and in fact influence my trading to a large degree. Things like exercise, keeping fit, eating habits, etc. are all considerations that affect all aspects of life, including our mental strength and ability to stay focused on the plan. Others might find these insights of use and adopt them for themselves.

Since this was intended to just be a quick update, let’s get right to the charts. The two most commonly traded mining etfs are GDX and GDXJ. I mentioned yesterday how I liked the setup, and was adding to my winning positions while they were pulling back. Today gives us the confirmation that miners indeed want to head higher, and they did with force. Many of the leaders broke into new 52 week highs, suggesting the group will follow, and that the upside is not nearly finished. We won’t know where they top out until we get there and we start to get conflicting signals, but a good place to start looking for the exit will be when the long term monthly charts start getting to overbought stochastics. For now and the foreseeable future, stay long and add on dips. Stay focused on the plan, and don’t let the wiggles scare you out of position.

GDX about to make new 52 week highs
Similar to GDX, the junior miner etf GDXJ wants to go higher. Stay long.

Before I forget, let’s take a quick look at MUX, which I was adding to yesterday while it was down and near the lows. I got lucky here, as it was one of the better performers today, after being one of the weaker ones yesterday. It managed to tack on close to 7% today. That´s nice, but I am not tempted to take small gains, when I am looking at a setup from the long term monthly charts that got me into the trade. The precious metals miners still have lots more potential upside!

It was a nice opportunity to add to MUX yesterday, near the lows of the correction.

Adding to my positions

MUX treated me very well in the 2016 rally, up about 400%

On this pullback, I will be adding to my mining stocks. Specifically, I will add to the SILJ etf for silver miners, and also stocks like McEwen Mining (MUX), as it has pulled back substantially from recent highs, 13.5% to be exact.

Ideally, I prefer to buy SILJ when the stochastics get oversold, but with a down open this morning, it is close enough. I like how it stays above it’s 200 MA lately, a good sign, but even if it drops below like MUX, I still want to own it as the trend in miners and gold are now up. We are adding to winning positions into their corrections, just how we want it.

New Monthly Charts

Let’s step back and take a look at the longer term picture to see how miners look. Above is the monthly GDX chart, and it’s almost ideal, in my opinion. Not only have the moving averages turned higher, we see the stochastics are now back on the upswing. We will hold our miners until these stochastics are overbought, at the absolute minimum, so this trade has many months to go, if not longer. Let the trade take us out when it is ready, no sooner, no later.

Likewise, the SILJ is now sporting similar characteristics, and while not quite as strong as the GDX at the moment, SILJ could have much greater potential upside over time. SILJ’s moving averages just crossed to the upside this month, and we see that a parabolic time price signal (also called a PSAR signal on many platforms) is about to trigger after many, many months of a downtrend. Once that diamond prints below the stock price, this indicates we will see many months, maybe even years of upside for SILJ, but let’s not get ahead of ourselves. Review the GDX chart above, it’s now printed 8 diamonds already in this uptrend, and there is still no end in sight. These charts tell us to stay long for now, so that is what we will do.

While not a critical part of my analysis, it doesn’t hurt to know what other vehicles that affect metals are doing, and how their charts are looking. The US dollar etf is the UUP, and here we see it’s 2 month and 5 month moving averages also have just crossed, but this time to the downside after a long uptrend. More likely than not, the UUP will see lower prices over time, is what this chart suggests.

So all in all, everything is shaping up as expected and we will continue to ride the trade for what it is worth. If the above holds true, and combined with such things like a weak stock market, political turmoil, or economic weakness, this trade/investment should pay out well. We already have the movement our direction, and there are plenty of catalysts to really kick this into high gear. The hardest part is always just sitting on your hands, and not meddling with things at every little turn. Chart analysis is second to maintaining clear thought and discipline.

SIGN UP FOR UPDATES

NO SPAM, EVER!