Bull Confirmations

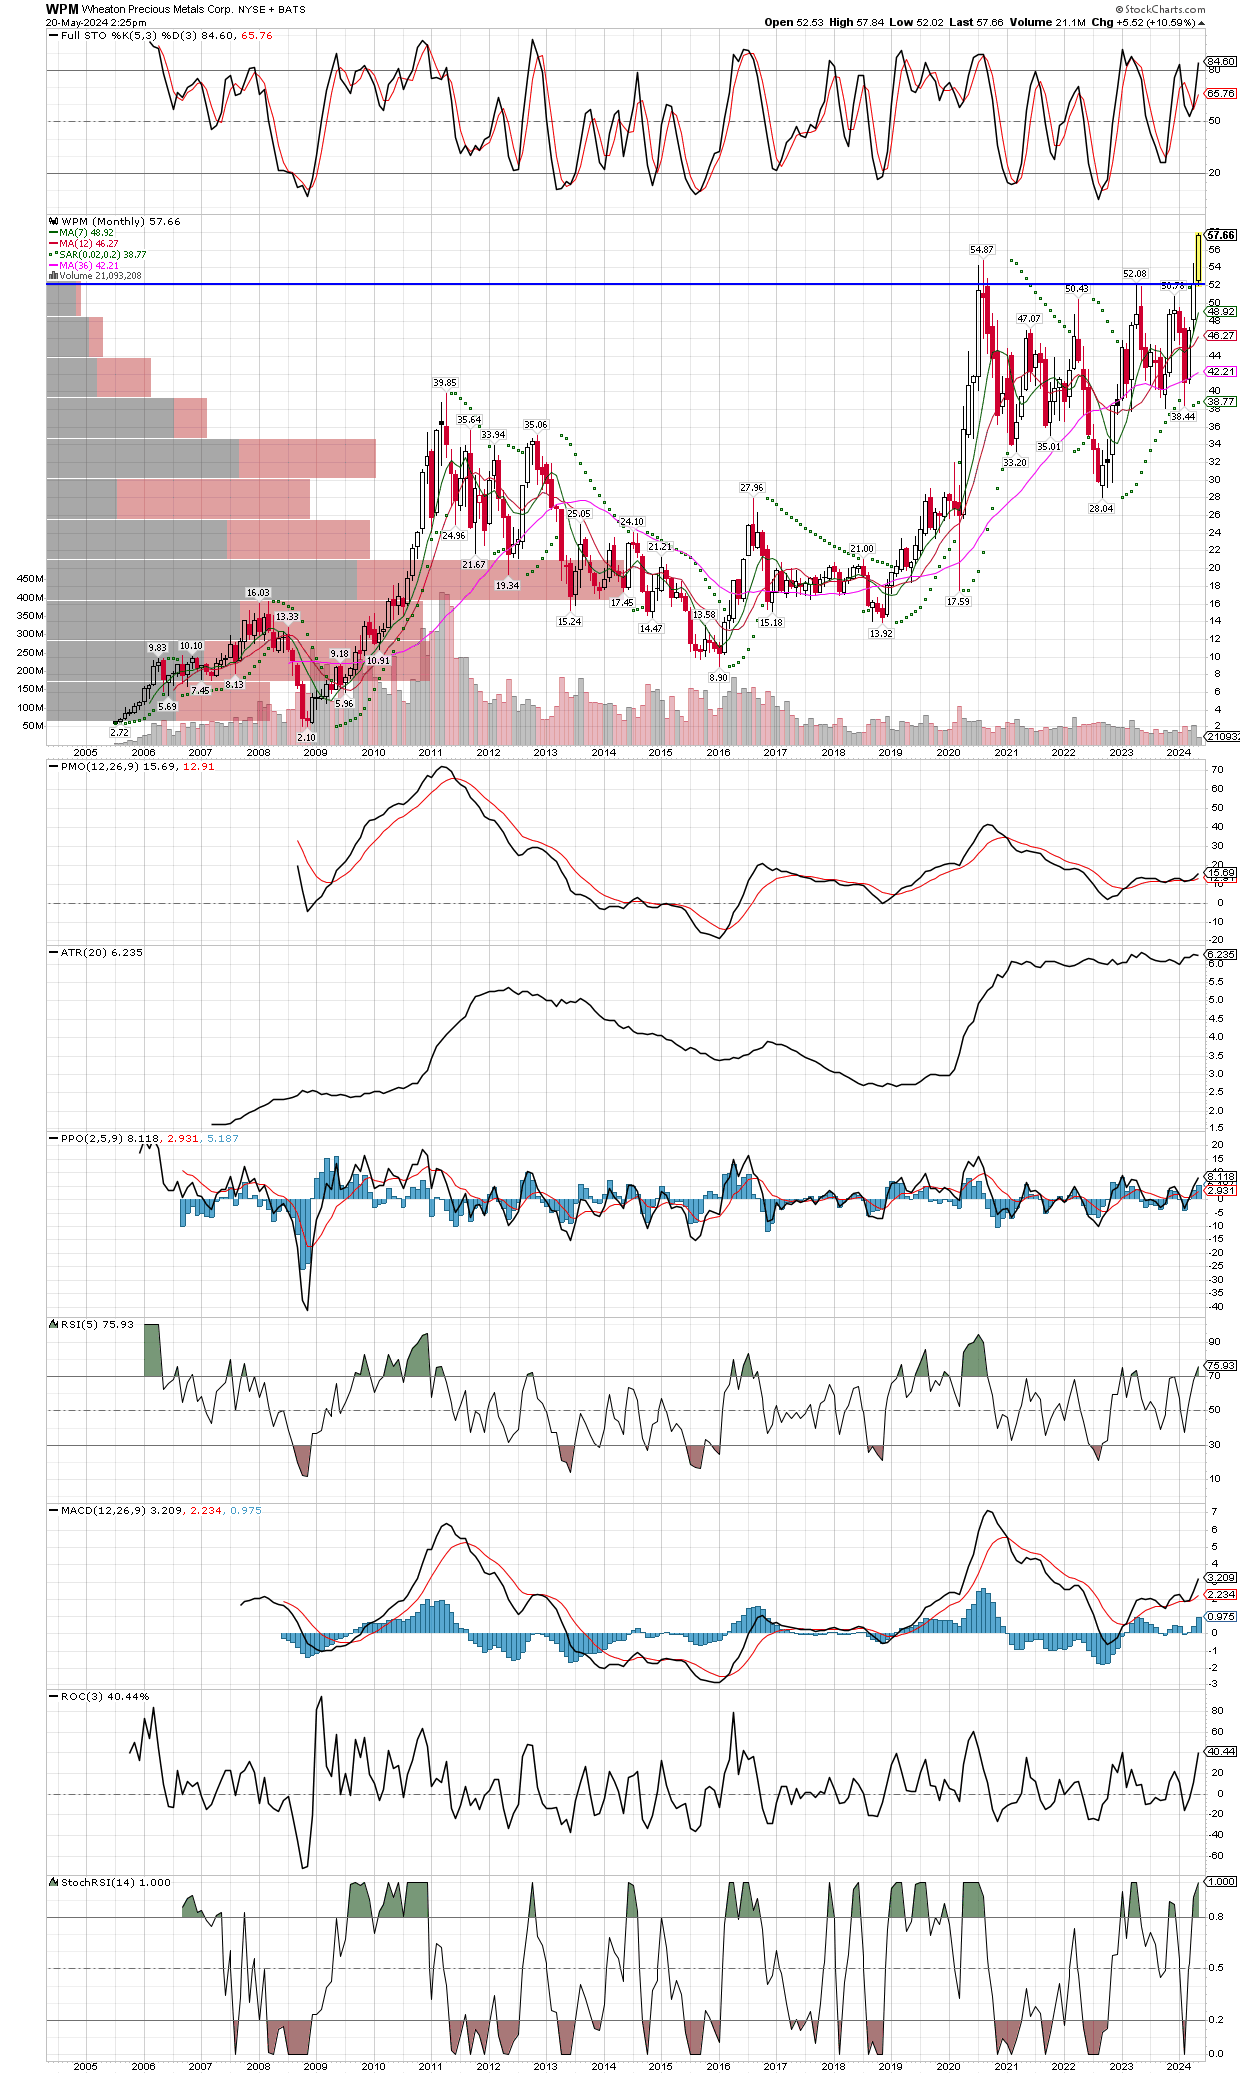
Barely anybody is acknowledging that miners and metals are in a bull market, outside of gold itself. Take a look at WPM (Wheaton Precious Metals), make new ALL-TIME highs, but not getting any recognition as yet. This tells me there is lots more upside in this bull, and forgive me for stepping away and letting it do it’s thing, leading me to post less here. I prefer to let winners run and we have been having a string of enormous gains, easy to make one excitable, so I look away and do something else. After all, no way I am selling anything down here, so no point it watching every tick.

While I do not own WPM outright, I am happy to say its in the top ten holdings of the SILJ etf, which I think is how most non-professional investors should play the miners. People think etfs don’t move, but just in 2016 SILJ gained 389% over six months! I have added here at there to positions in BTG and EQX, and am prepared to buy a sharp drop that lasts just a day or two, when it finally arrives. It might not happen until miners are at much higher levels, when they are in a bull market, they are a sight to behold!

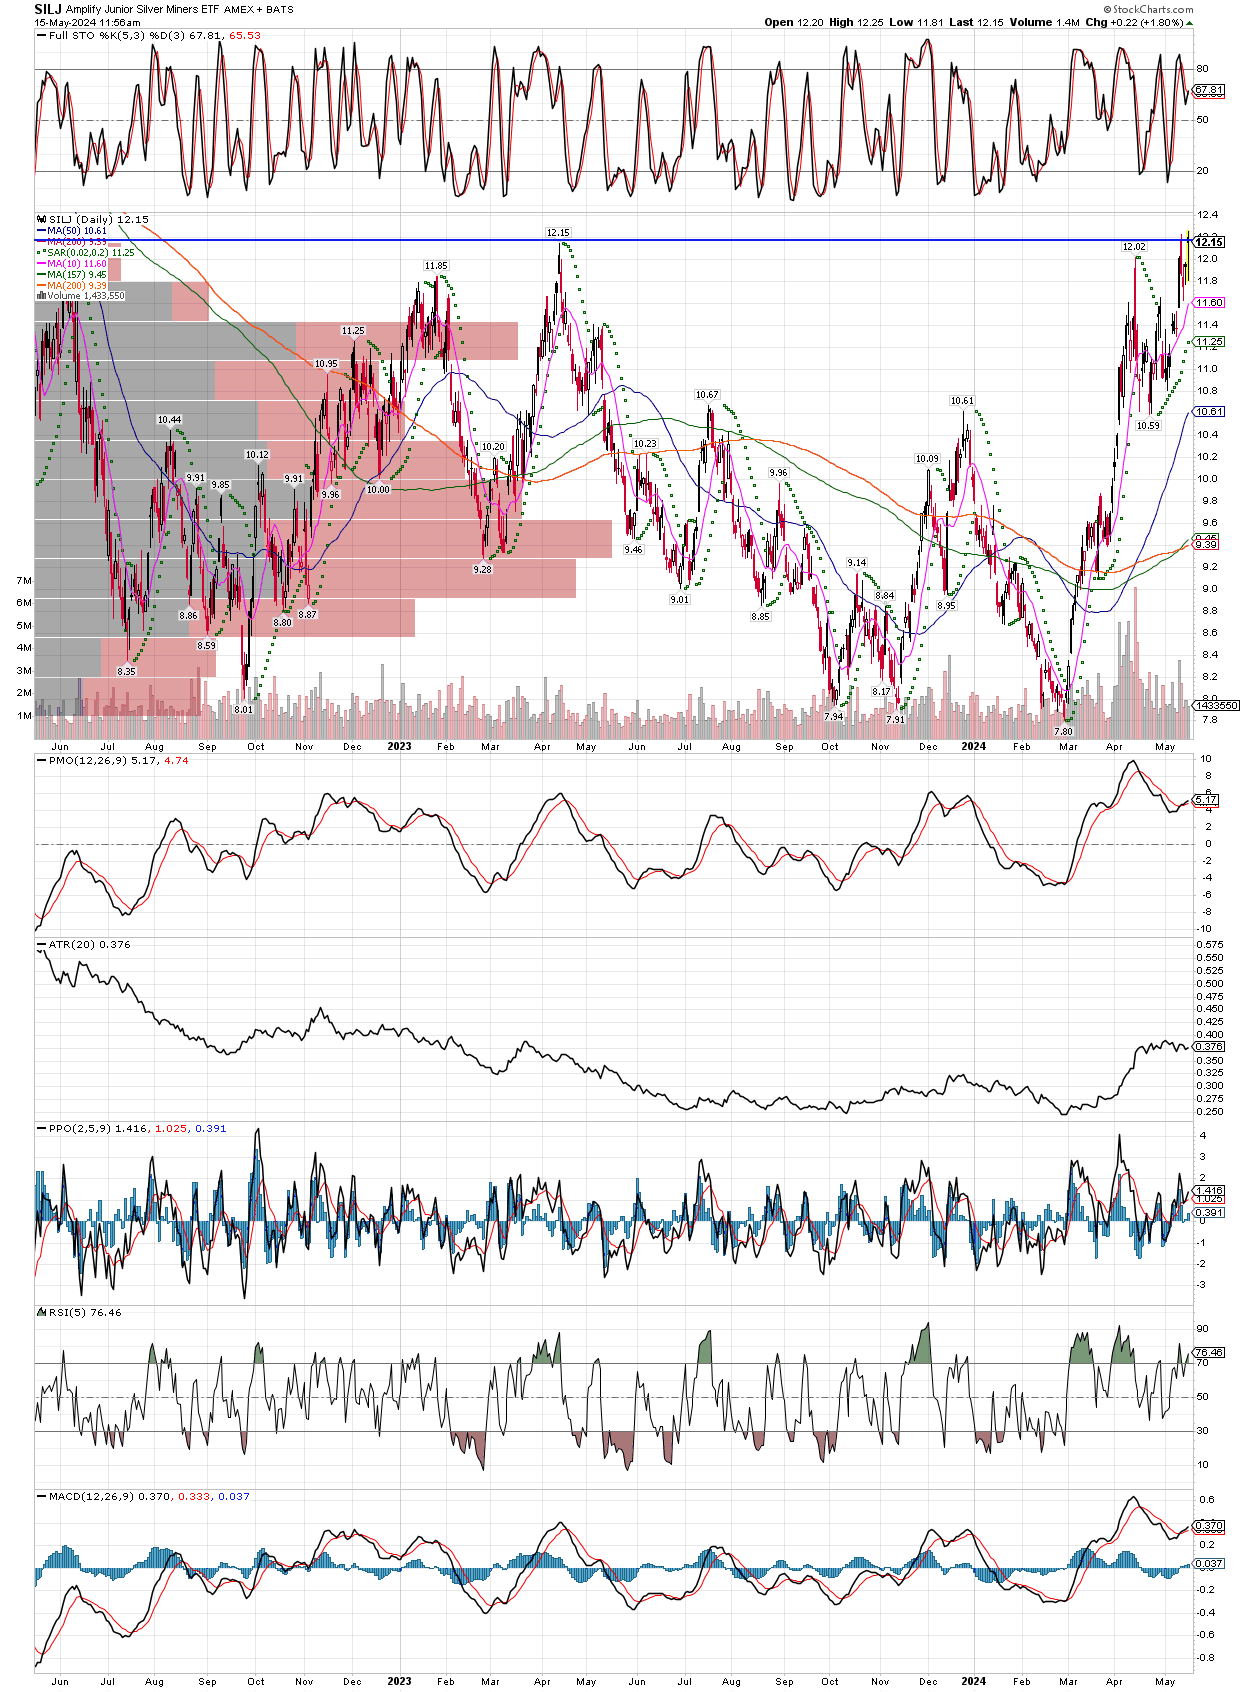
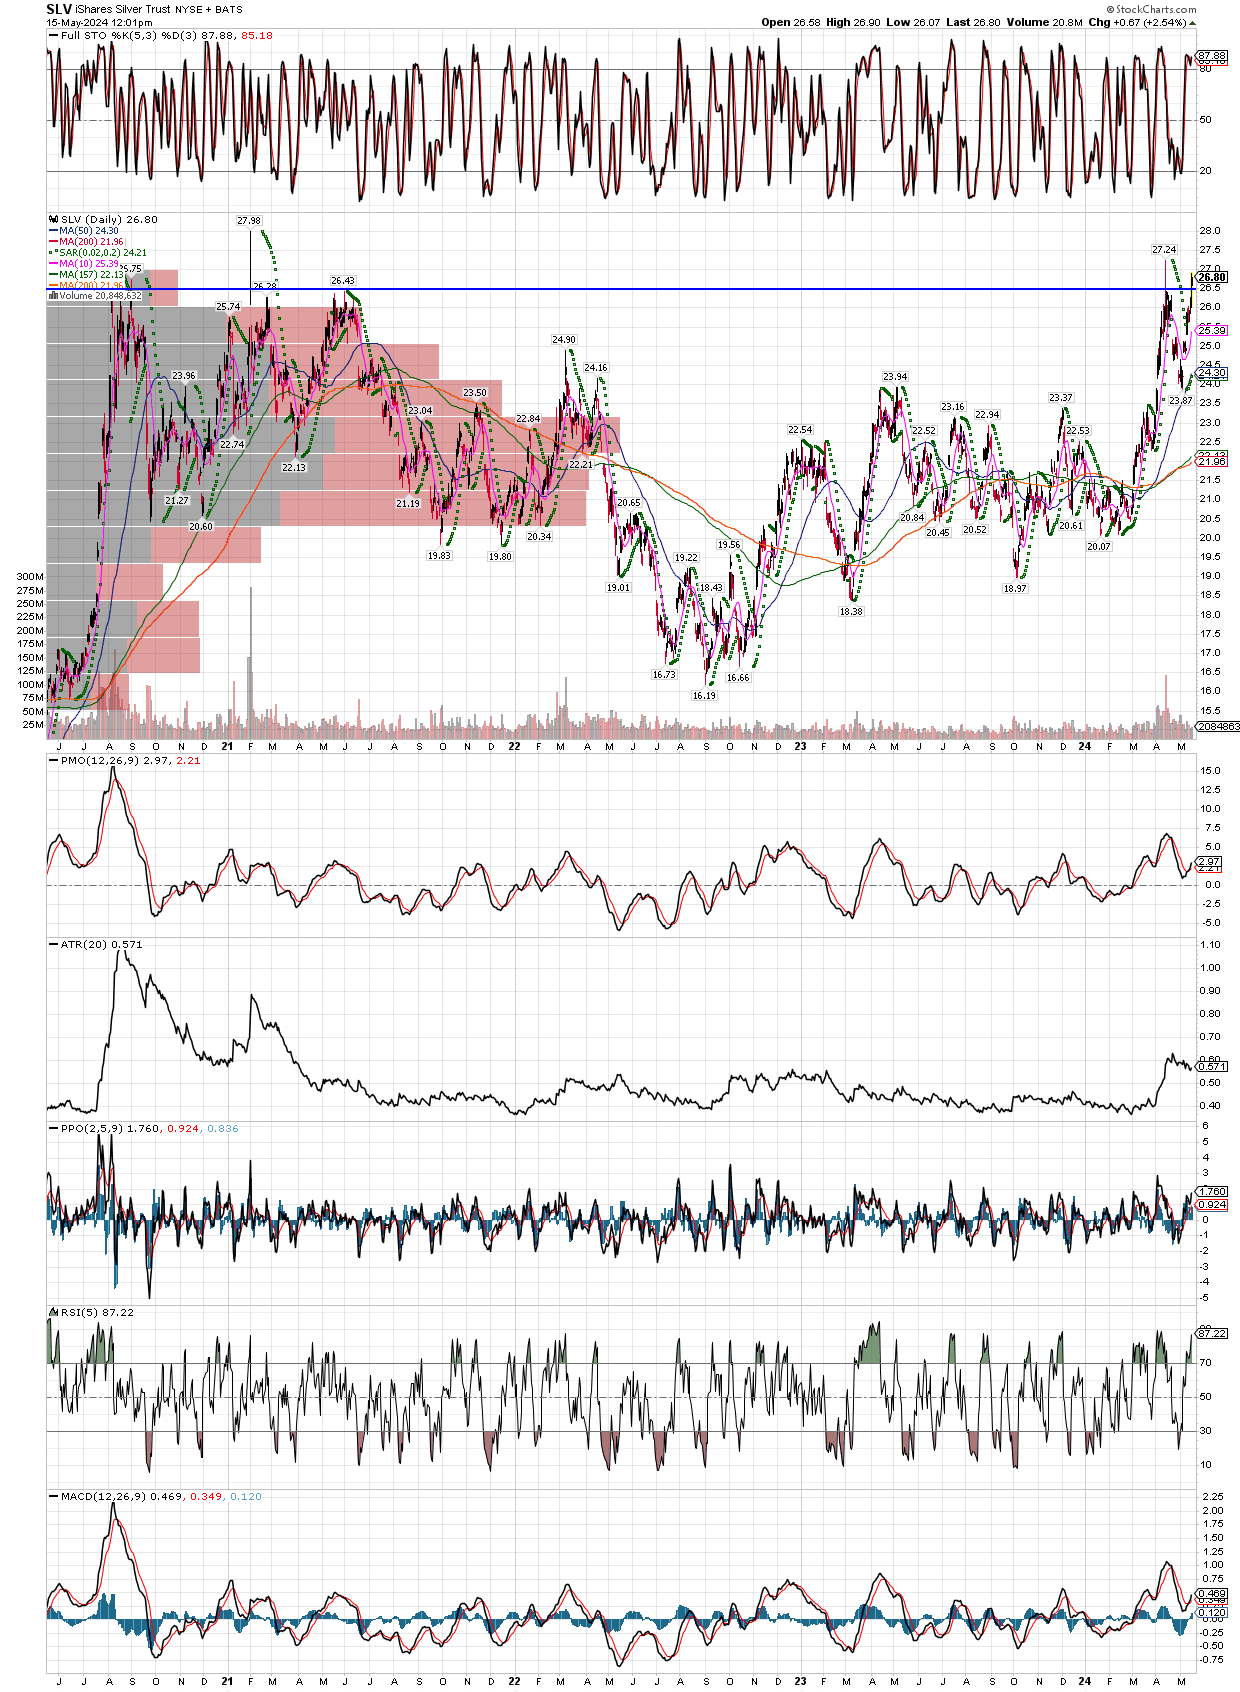
New Highs For SILJ And SLV

SILJ made new 2 year highs today, while SLV is set to make it’s highest daily close in the last 4 years, if it closes where it is, as I type. So much for those that refuse to admit precious metals and their miners are in a new bull market! The small investor still hasn’t even noticed, which means we have much higher to go. Stay long and strong, take advantage of sharp pullbacks that might only last a day or two, to add to positions. We well get the typical 25% correction at some point, but like Michael Oliver, I don’t think that it’s in the near future. Be prepared to hold through it, or for those that are great traders, they might try to side-step the decline when it becomes obvious it’s close at hand. But for now, nothing to do except sit tight and let winners run.

Coffee Futures Bull

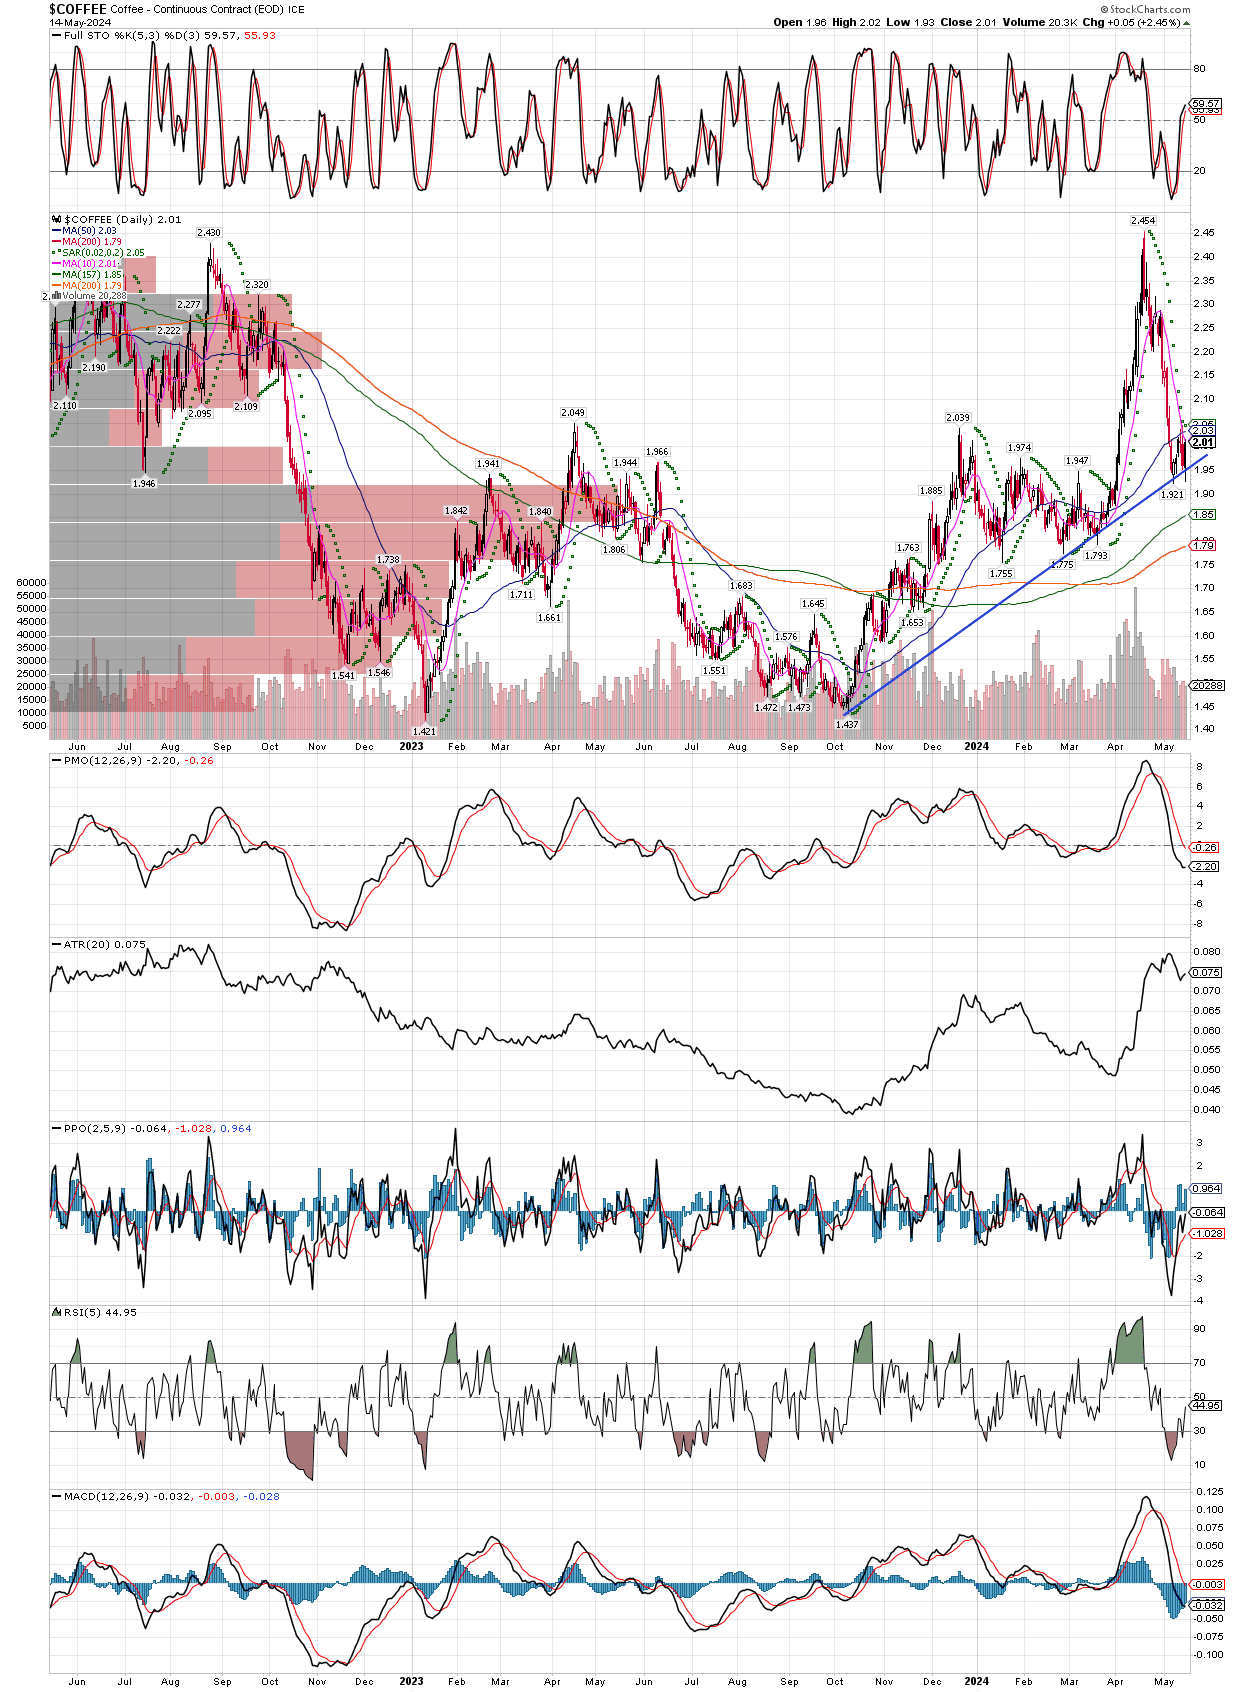
Coffee futures have had a big run since last October 2023, and a subsequent 20%+ correction into an area where I am inclined to buy. Anywhere below the $2.00 level offers a good risk/reward entry, in my opinion. We have seen many commodities take turns spiking higher, Cocoa was the most shocking rise and correction, but others like Orange Juice are breaking out to new multi-year highs, and now things like Wheat, Corn, Rough Rice, and even Silver look ready to start their moves up. Wheat has already done so, the only reason I didn’t buy for our accounts is that it’s not technically in an uptrend on the daily charts yet, but it is close to doing so, meaning I will then buy into multi-day dips or longer sideways consolidations. Copper continues its relentless rise, and platinum just recently started to put up a string of big daily gains, while not involved with these, I might buy the SI futures (July Silver contract), since it looks wound up and ready to explode higher. My favorite technical analyst, Michael Oliver, thinks silver is just in front of a huge 6-10 month rally that could take it to $50 this year. He has been out doing many interviews lately, for those that want to search youtube and hear his words from his own mouth, but suffice to say that he has been deadly accurate in his calls the last several years.

Here is the daily Coffee chart. I added the trend line, though that is not the reason I am buying here, since commodities often trade differently than stocks, they don’t always respect trend lines and more often have a tendency for sharp momentum moves, so breakouts are more important in commodities than in stocks. I just like that Coffee had the big breakout, then got smacked down for a decent correction that has already lasted 4-5 weeks, but could go as long as 6-10 weeks. There is no rush to buy, and the late buyers have been sufficiently punished, so that the downside could be limited from here. If it continues to hold in here around its 10 week MA (not posted here, but around $2.04), I will get long in the accounts I manage, and be ready to quickly add if it starts to move up again.

Is Silver Ready to Rise Again?

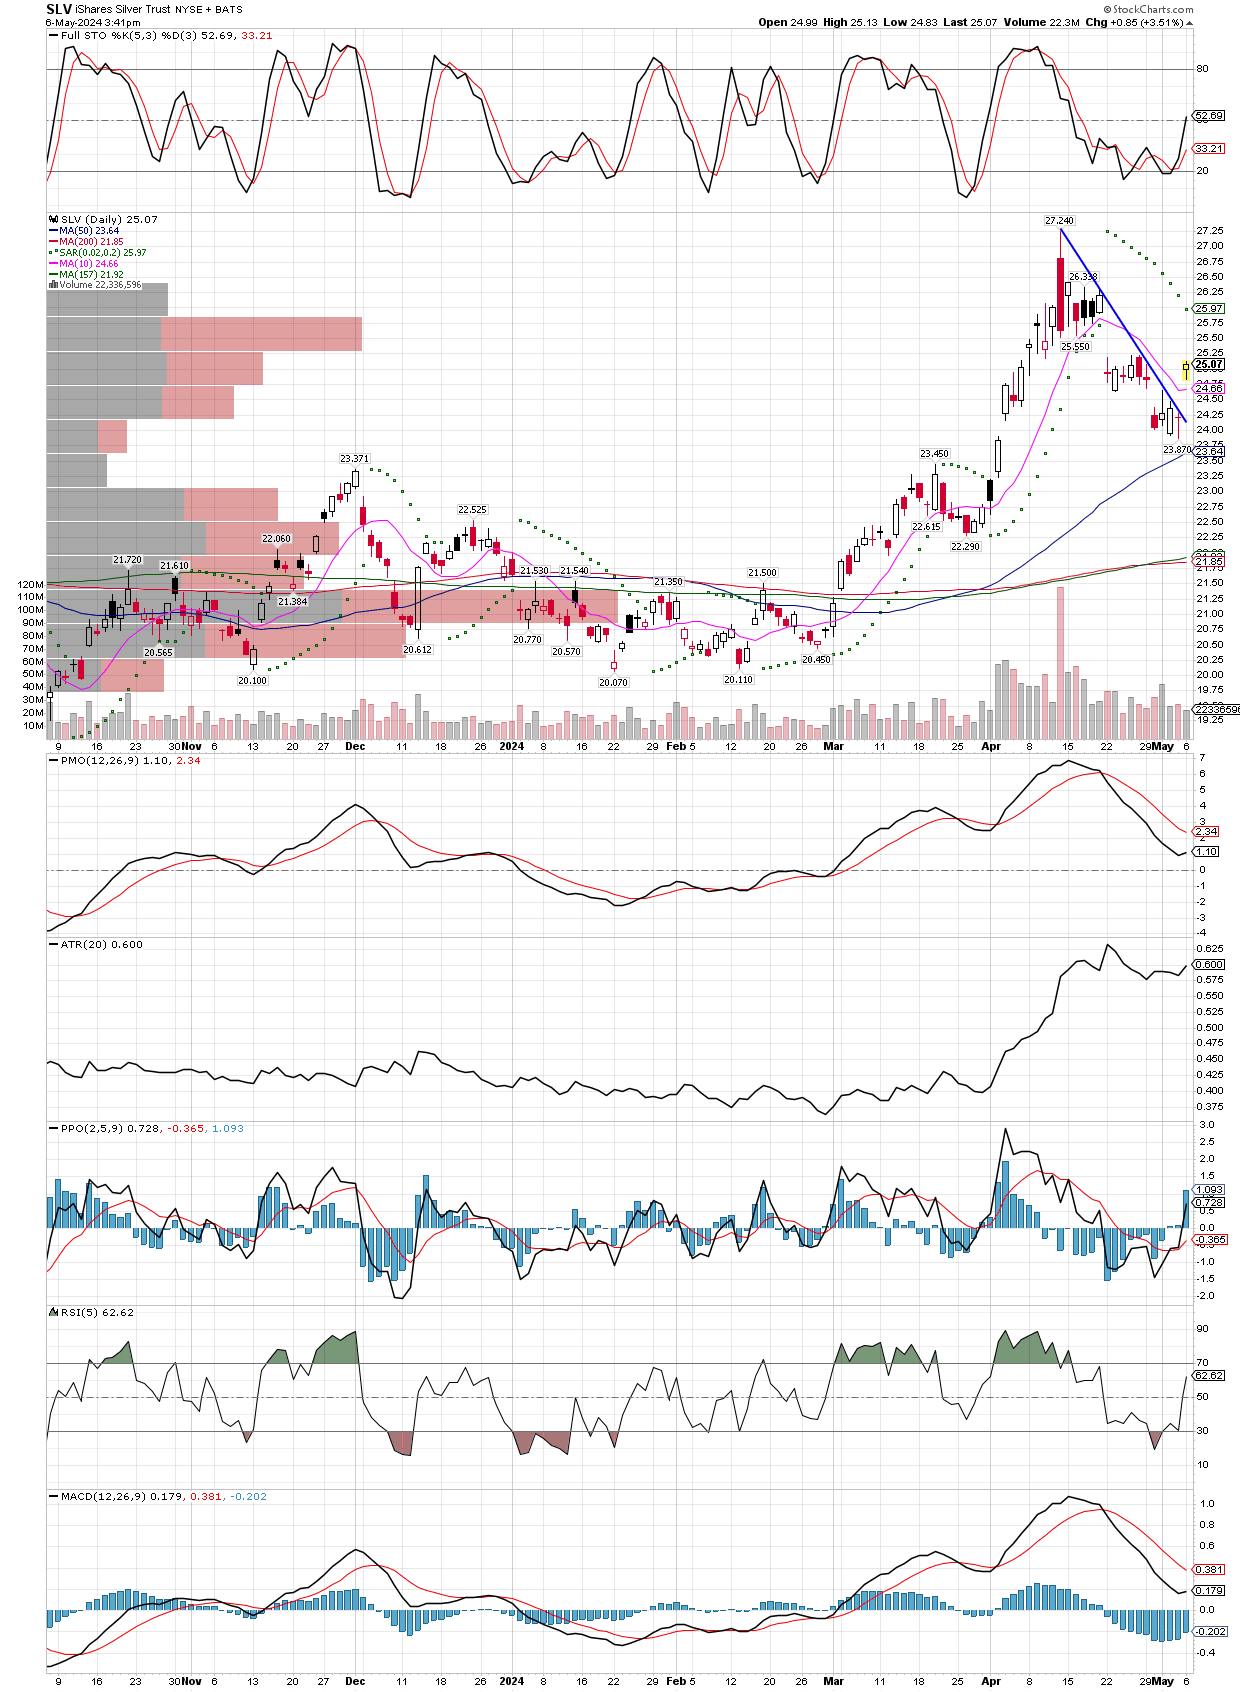
In the last post, I forgot to show the broken downtrend line, which could be showing us the correction in silver is already over. Maybe it is, maybe it isn’t, but either way this retreat is an opportunity to buy or add to positions in the metals and miners.

SLV And EQX

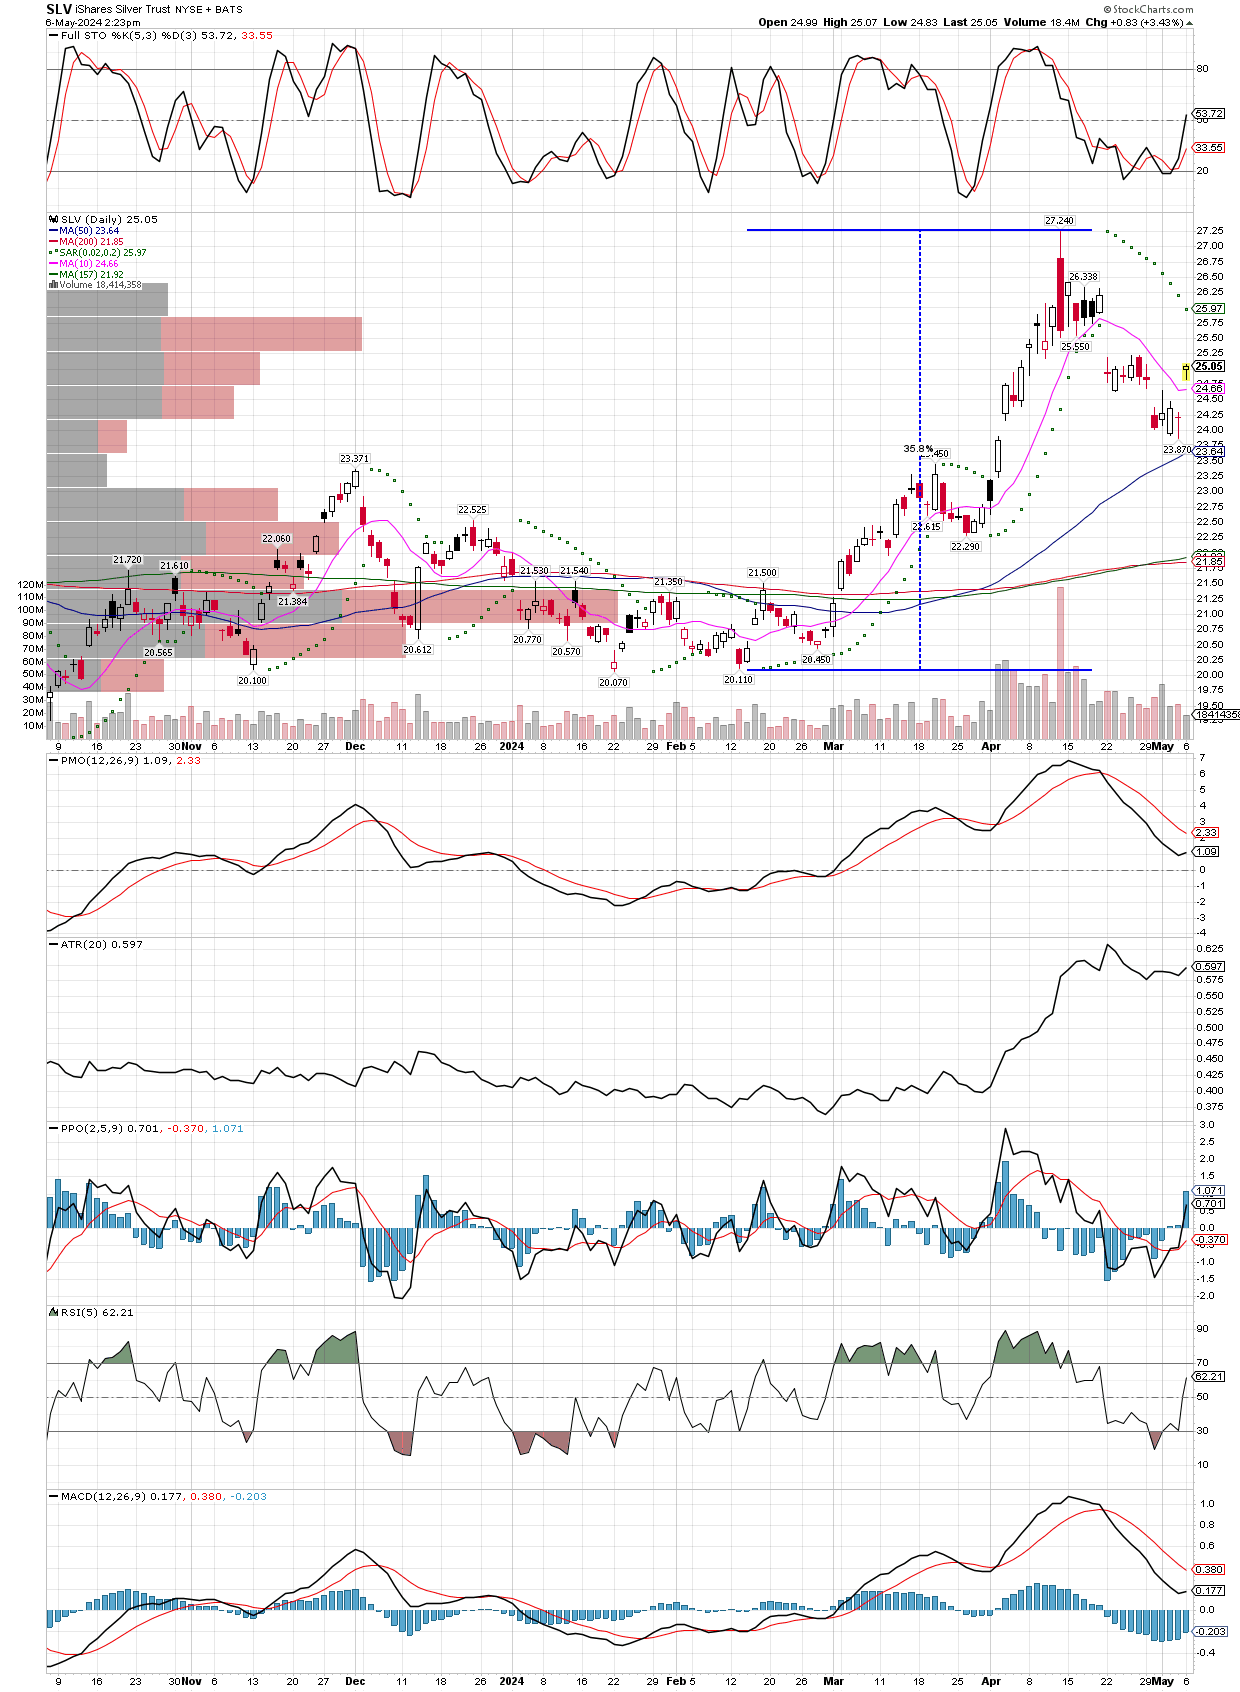
Just a couple charts to consider, first is the SLV silver etf to show how much silver rallied from the February low to the April high, in just two months it rallied 36%. Many people say silver and miners are lagging, but the charts say otherwise. By the way, in my opinion nobody should ever buy the SLV etf, as they don’t have to own physical silver. Lots has been written about this topic and its manager JP Morgan, for those that want to know more about why they should avoid the SLV etf. That said, silver (the metal) and it’s miners look like they are ready to make another move higher. I added to our SILJ leap options with a January 2026 expiry last Friday, and am looking to add to other individual miners as well.

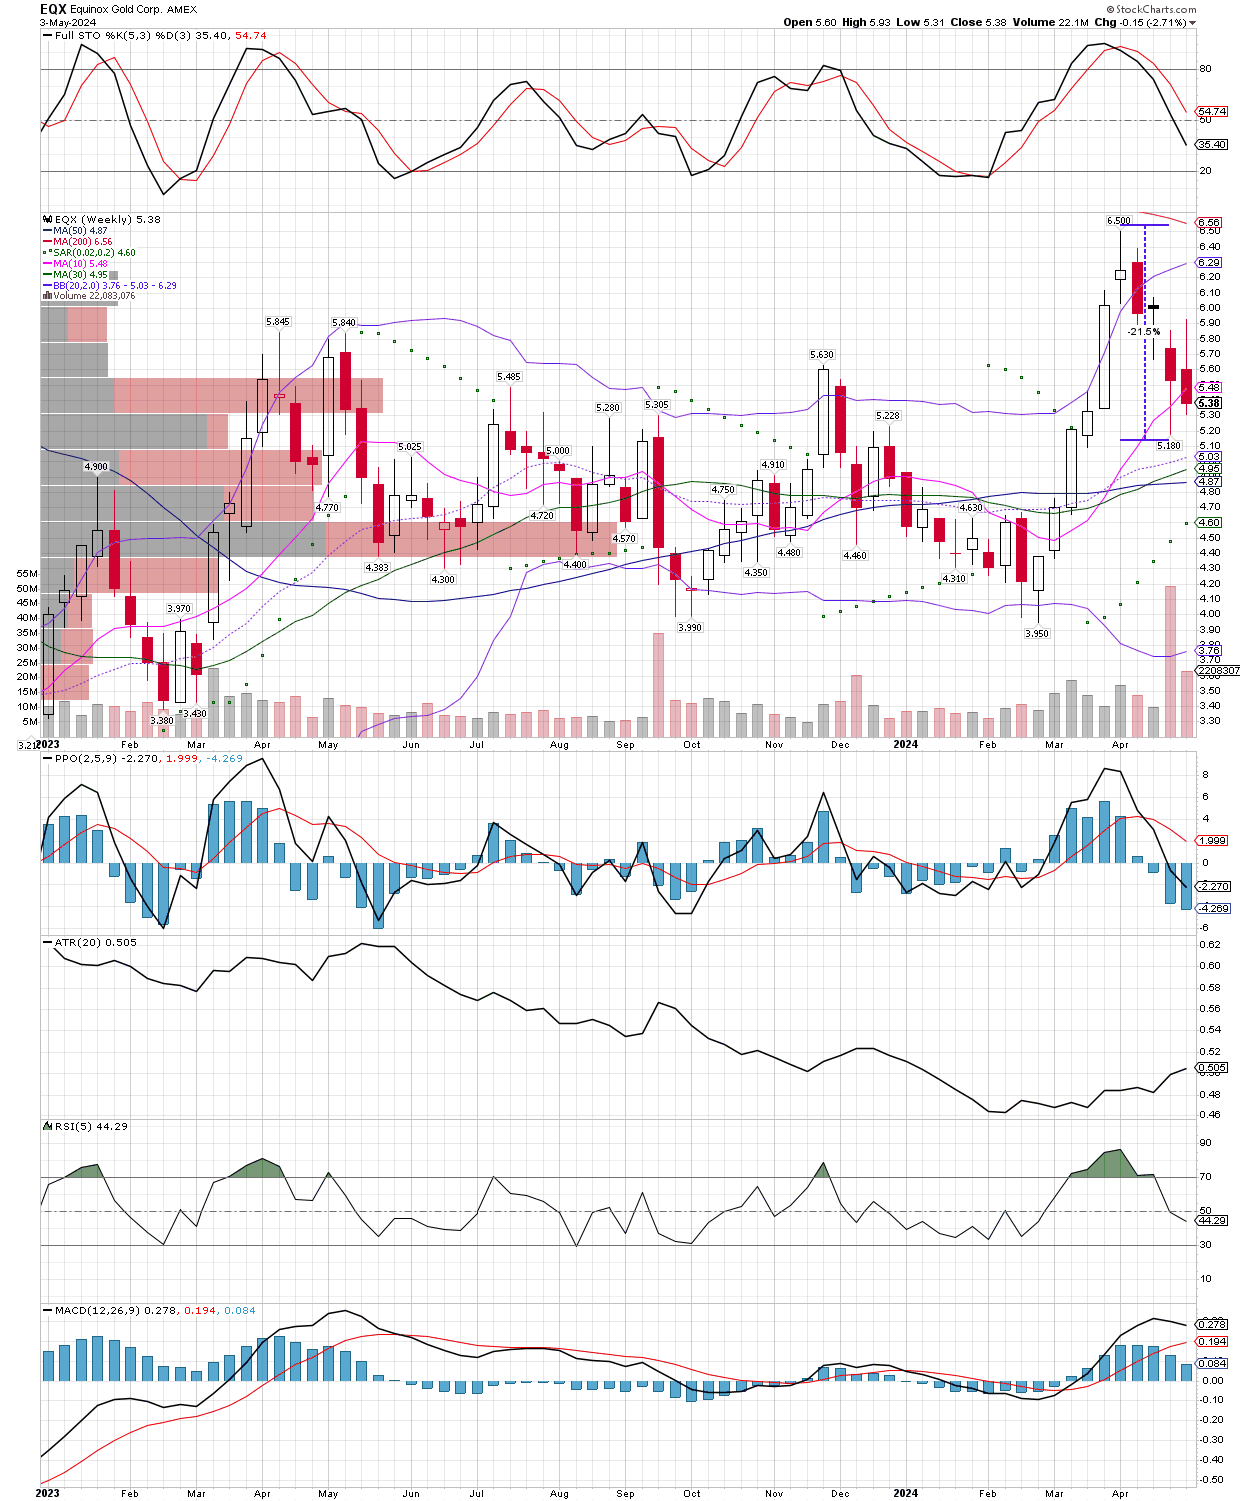
With that in mind, let’s look at EQX (Equinox Gold) on a weekly chart. The stock has now pulled back nicely after making a new 52 week high, is in an uptrend, and now sits on its 10 week moving average while stochastics are now closer to oversold than overbought. I don’t recall which firm it was, but a recognizable brokerage firm came out with a target near $30 (CAD), about $22 in USD! I’m not sure if it was a misprint or not, nor would I buy on a broker’s recommendation, but with the stock at $5.60 as I type, that would be some amazing upside potential. I will stick to my analysis and just say its a stock I am adding to either today or tomorrow, among several others including FSM, SVM, BTG, PAAS, HL, CDE, AG, AYASF, SILV, and possibly a couple juniors like AAGFF and LGDTF. I was prepared for another week of sideways to lower prices as the group corrects, but the open today (Monday morning) saw the group make big gains, so it appears the correction might already be over. I plan to add 10% across the board to each position.

BTG A Laggard But Will Add With 6.22% Dividend

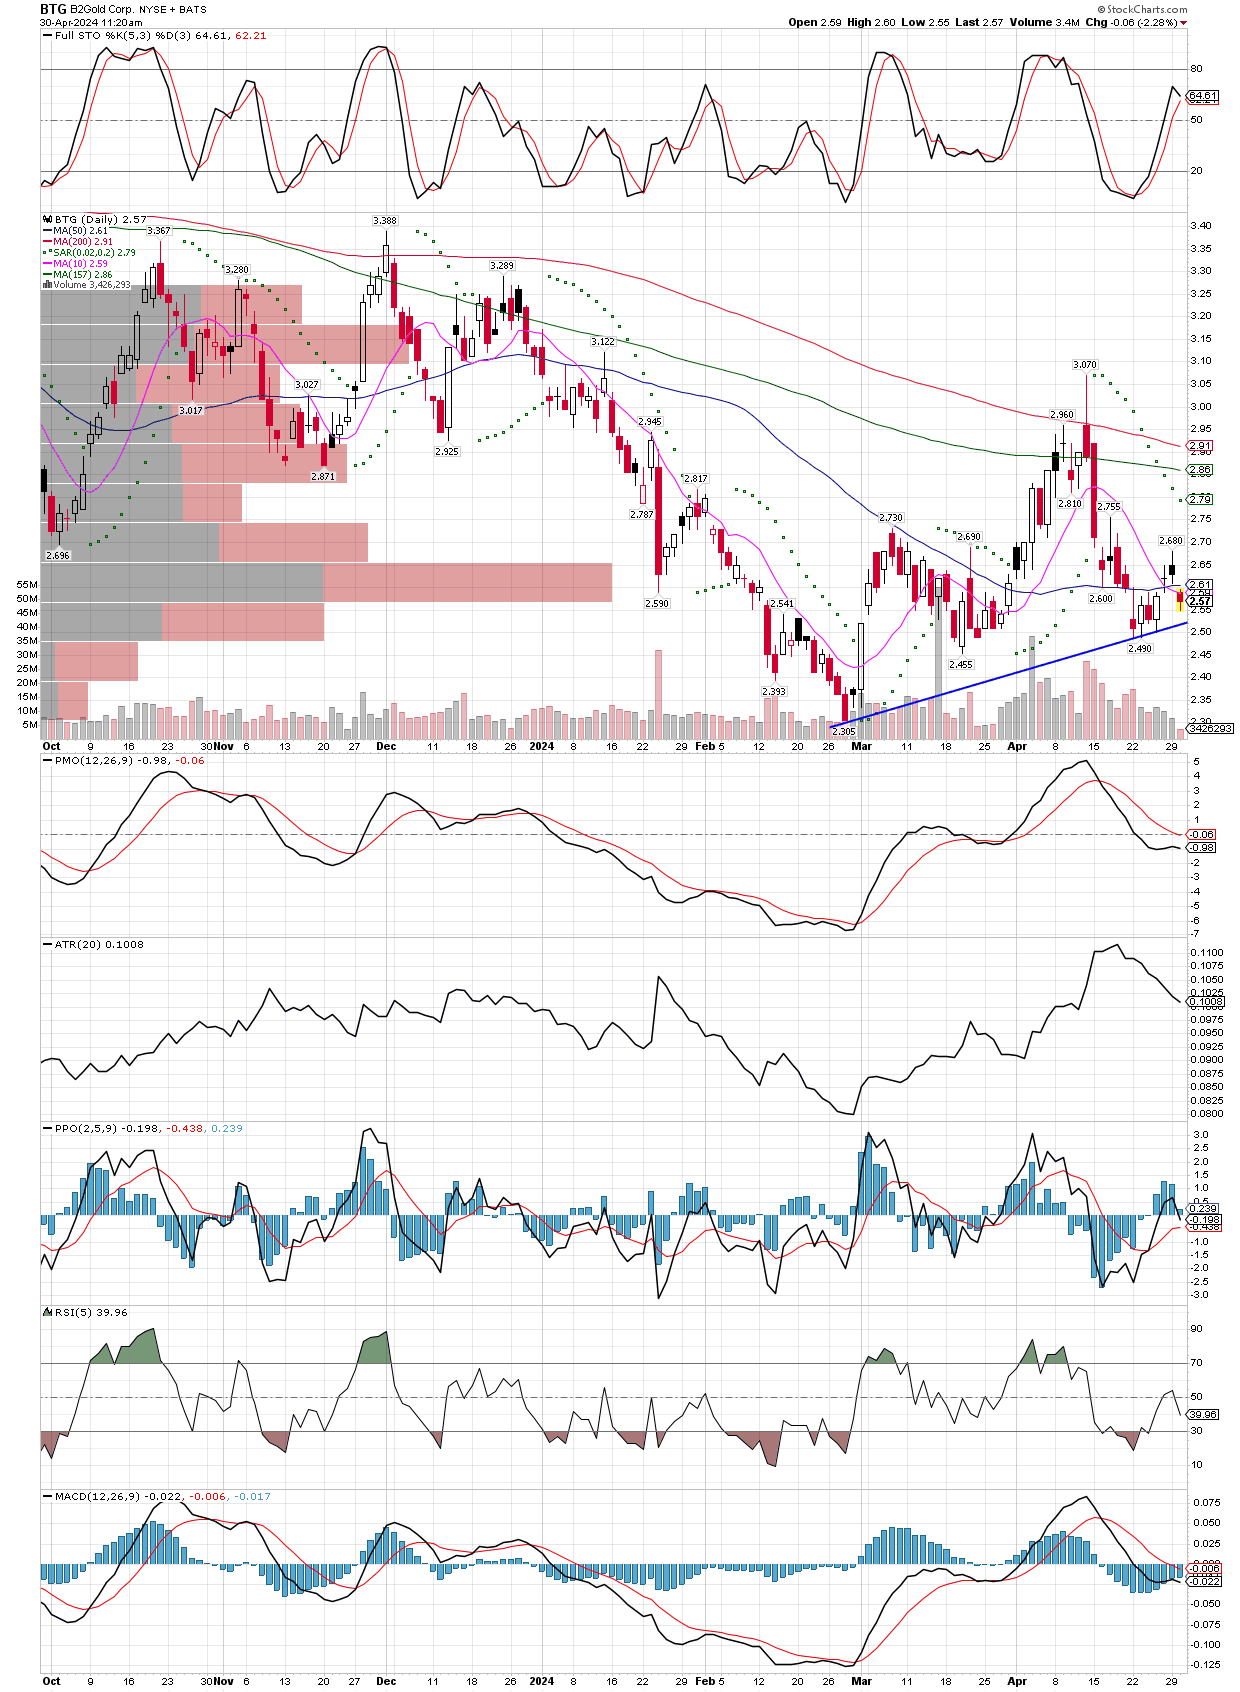
BTG is an example of a miner I will add to, I would have liked to see it bounce harder with the group when they were flying, but I think the 6.22% dividend is safe (and will grow), and the stock holds up better in big down days for the group, like we are seeing today. I likely will wait until tomorrow to add to our positions, as weakness like this can often extend into the next trading day.

Correction Is Here

Being metals and miners are in a bull market, as by the weekly charts’ (not shown here) week moving averages trending higher, I will look to add to positions as they pull back to their 10 WK MAs. Below is a daily chart with the zone between the two horizontal trend lines showing where I will be ready to add to PSLV (the Sprott physical silver etf), while the 10 WK MA is also in that range at $8.72 this week. PSLV and the miners have been rising so quickly that the 10 WK MAs are trending steeply higher, so next week I will adjust my entry prices to higher levels, likely in the area of $8.84 or so. Until then, we sit tight and watch how well metals and miners hold up overall, its been a fantastic run and there is a lot more to come.

Miners Are Outperforming Gold

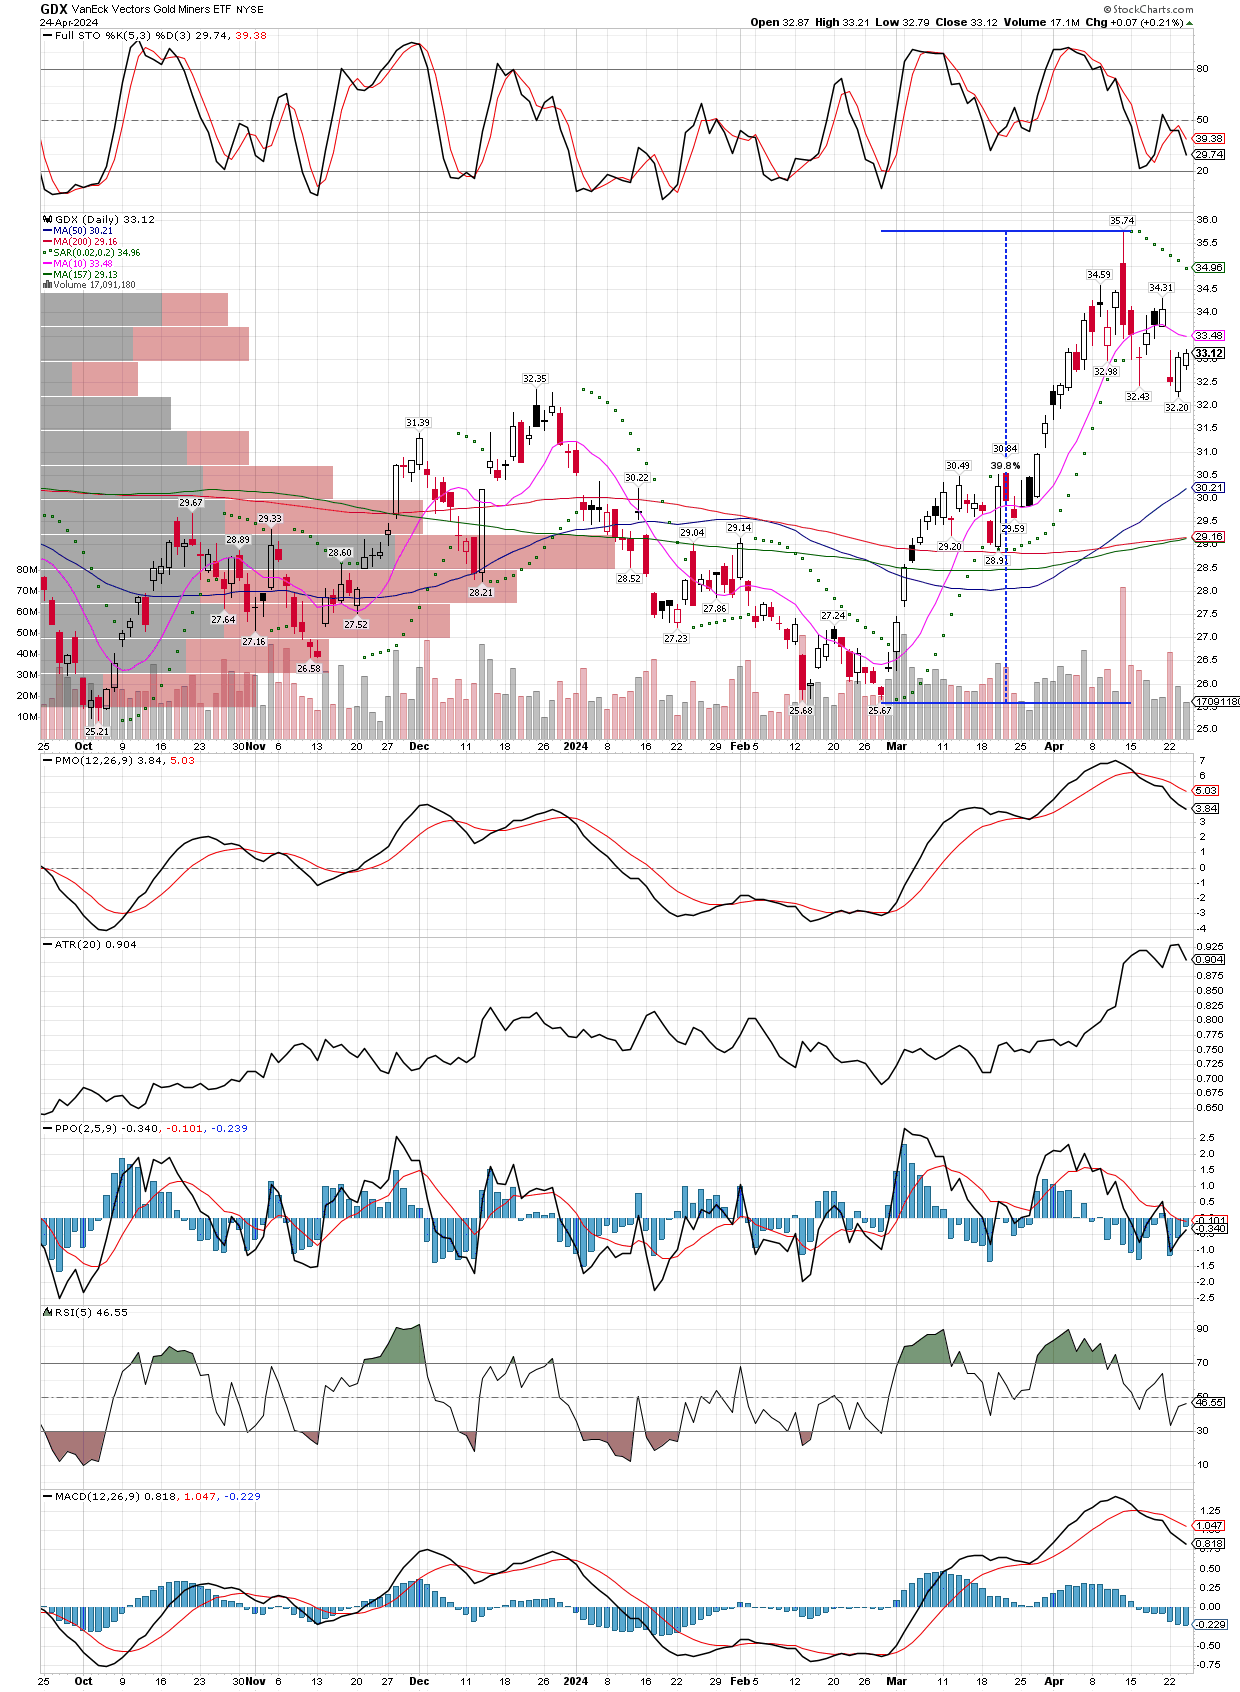
I keep hearing the same incorrect propaganda being parroted all over the mainstream media, and often by “professionals” that should know better. They drone on about how the miners aren’t going up while gold is rising, but I prefer to know the facts. Here is a chart of the GDX etf, large-cap miners that move the least/slowest with gold prices. Seems to me the etf is up 40% is seven weeks or so, since since the beginning of March. Gold isn’t up 40%, even though its performing well, too. Be careful what and who you believe in, look for the facts if you want to take money from the markets.

Keep in mind this chart is only the GDX, many mid-tier and juniors are up over 100% in the same time period. Somehow, this isn’t enough for those that only regurgitate what they have been told. They will wait until miners gain another 300% and prove they handily outperform the metals they mine, before they start to buy!

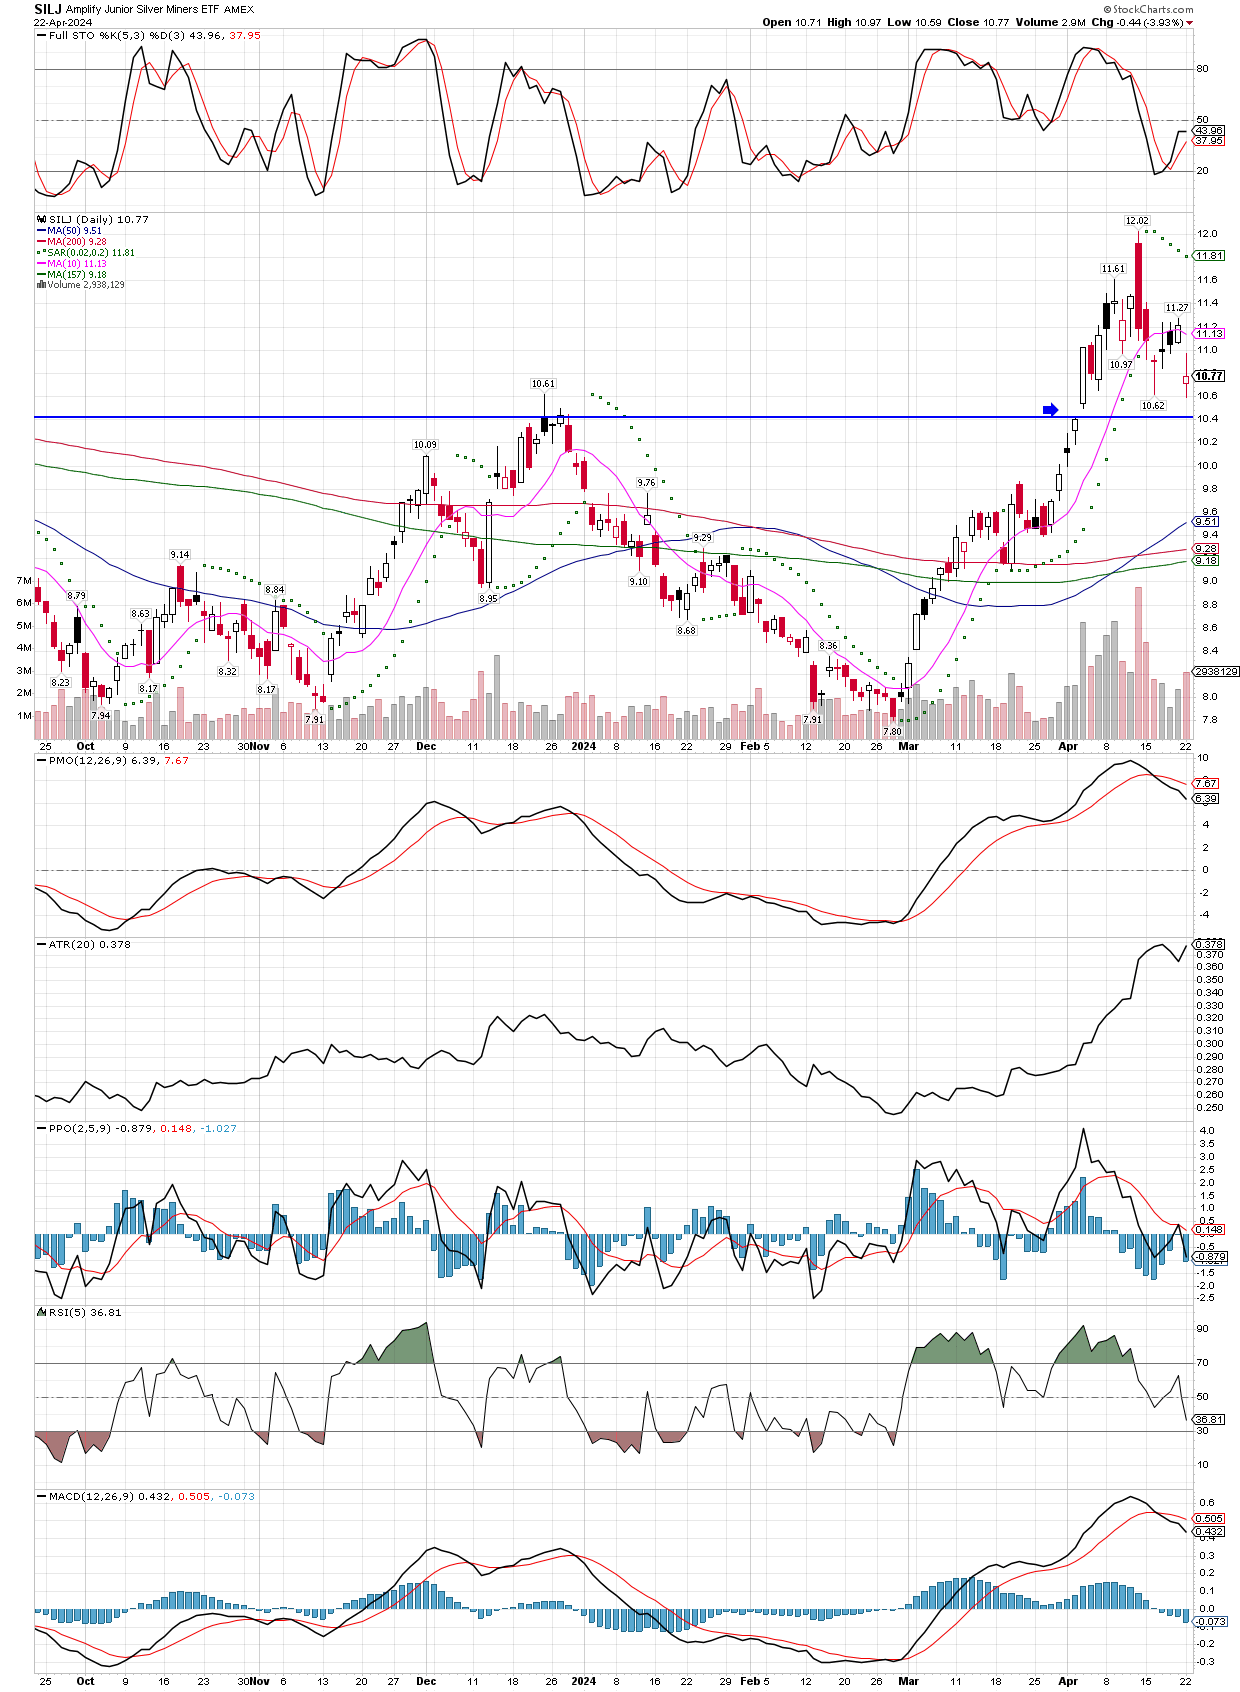
Possible Levels For SILJ Correction

SILJ and the precious metals miners have started a correction. Let’s take a look at possible support zones, where it might hold, then begin to bounce. The upper horizontal trend line is just an estimate of where the 10 WK MA will be in two weeks, as it is gaining roughly 25 cents per week. The lower horizontal trend line is where SILJ’s 10 WK MA should be one week from today. I point this out because strong uptrends typically respect the 10 WK MA, so both those levels are areas I will look to buy, depending on how much time has passed before each level is visited.

Now let’s take a look at the daily chart, where the $10.40 level looks to potentially be important. That would close the gap created there back on April 3, but it’s also the area of older highs which now could act as support. Since the $10.40 number is relevant to both the daily and weekly charts, that seems like a good place for me to add to my position. If it drops below that quickly, I would expect to see the $10.18 level to be the next area of support, on the weekly chart. If the 10 WK MA will be respected in this strong uptrend, the $10.18 zone, should occur sooner (next week), rather than later (two weeks or more), because the 10 WK MA is rising so quickly now.

We were stopped out of our CT (cotton) futures. They went straight down both before we bought them, and after we got involved, trading down directly to my stop. It happens, and while I don’t like being wrong on trades, a trader and investor must honor his stops or it can turn ugly. We still hold NG (natural gas) futures, and since the price is rising, might soon get the signal to add our second tranche.

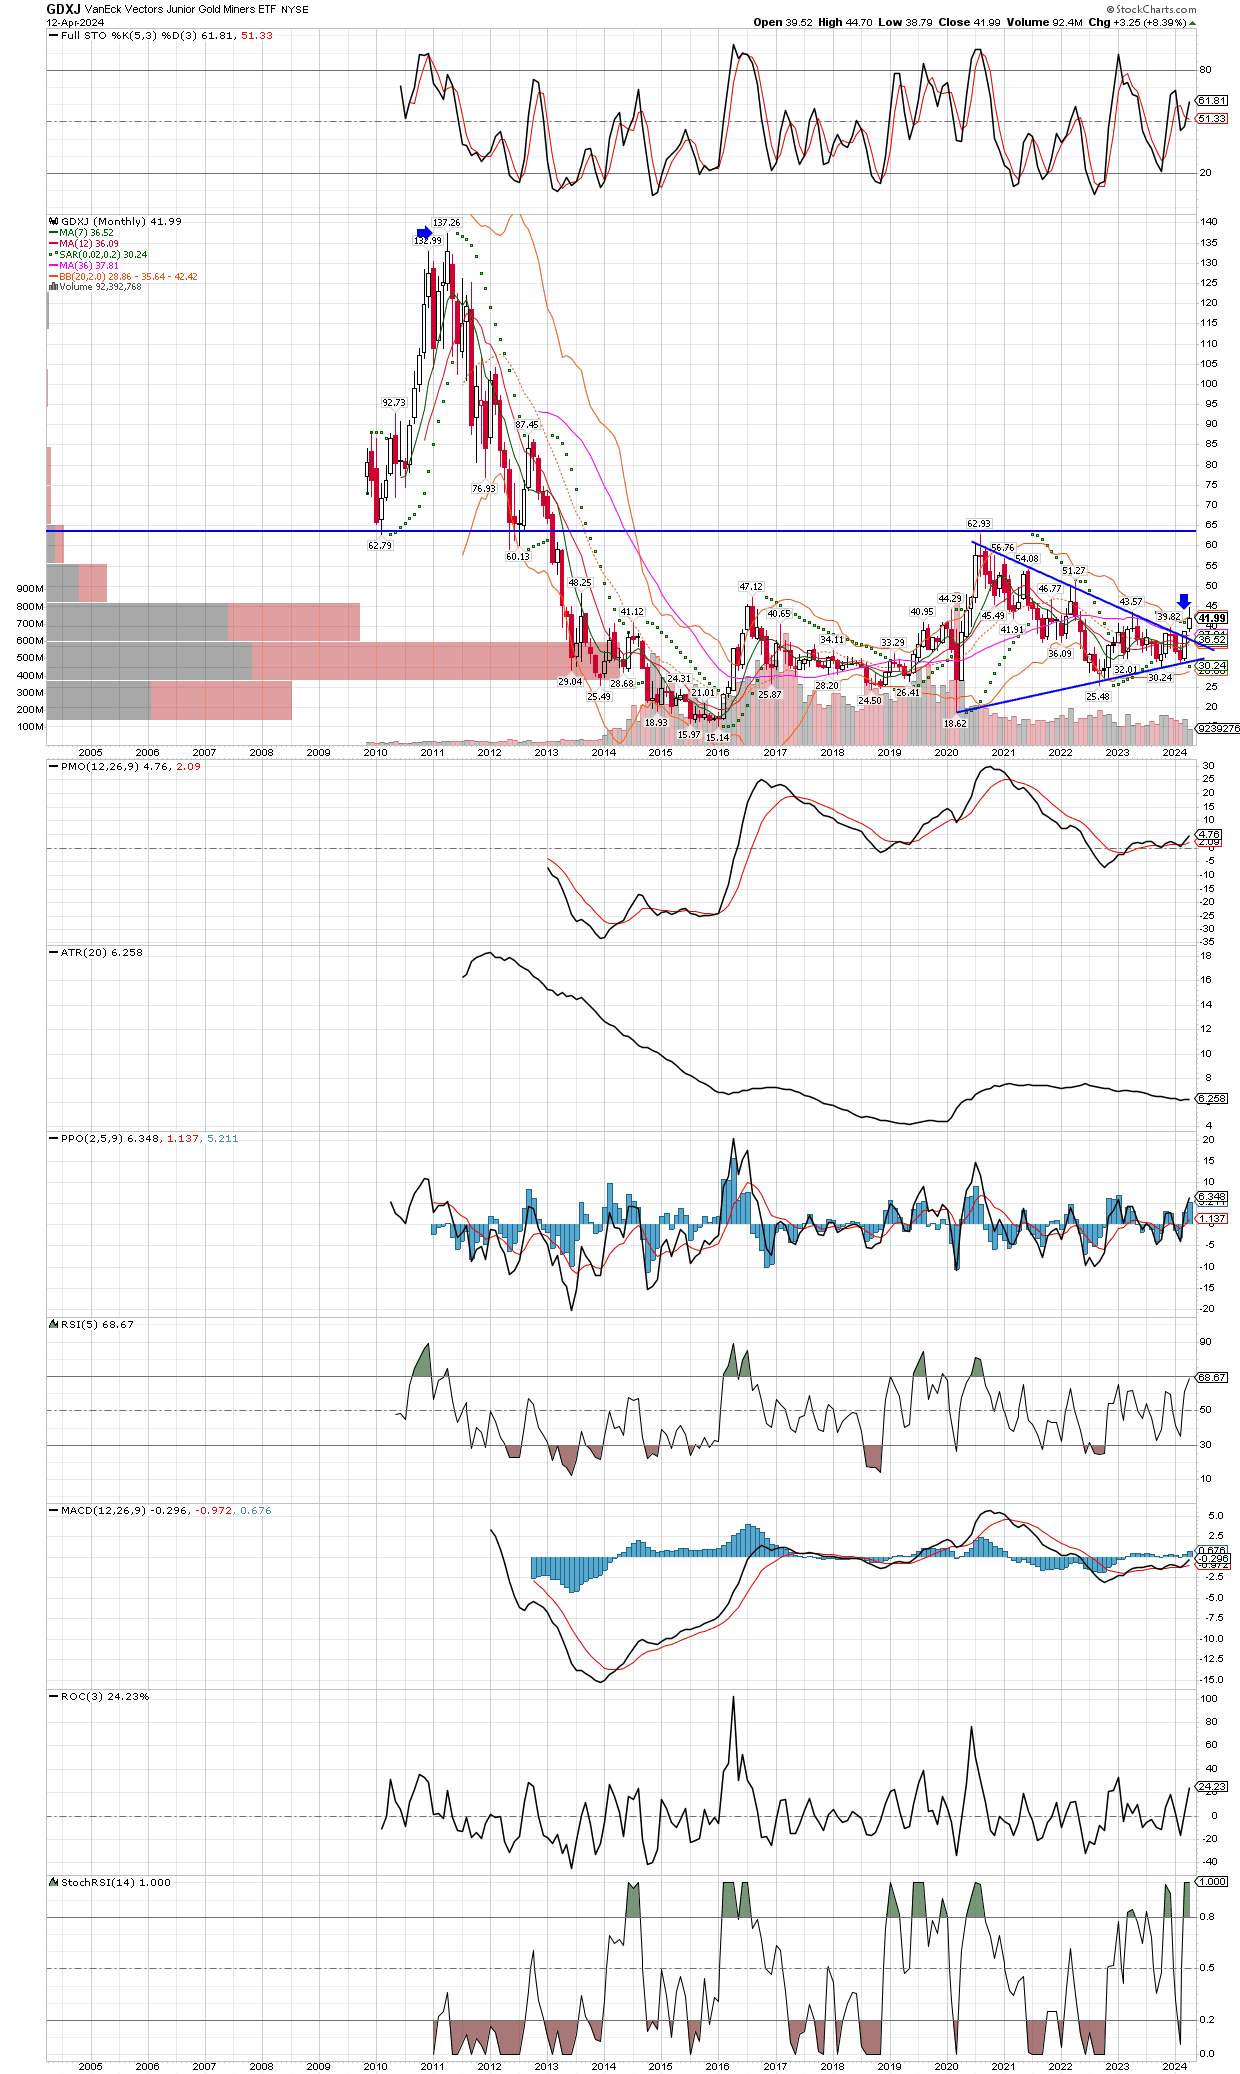
GDXJ Monthly Chart Looks Good

The long term monthly chart of GDXJ (junior miners etf) is shown below. Note the Bollinger Band breakout that just occurred this month, as well as the break above the downtrend line last month. It seems to me the horizontal trend line up around the $63 area should be easily obtainable, and possibly very quickly. After that level gets taken out, the Volume by Price bars overlaid on the left side of the chart suggest there is very little resistance on GDXJ’s journey to visit it’s all time high, which I see as highly likely in the next year or two. That would be gain of another 300% from today’s price.

SIGN UP FOR UPDATES

NO SPAM, EVER!