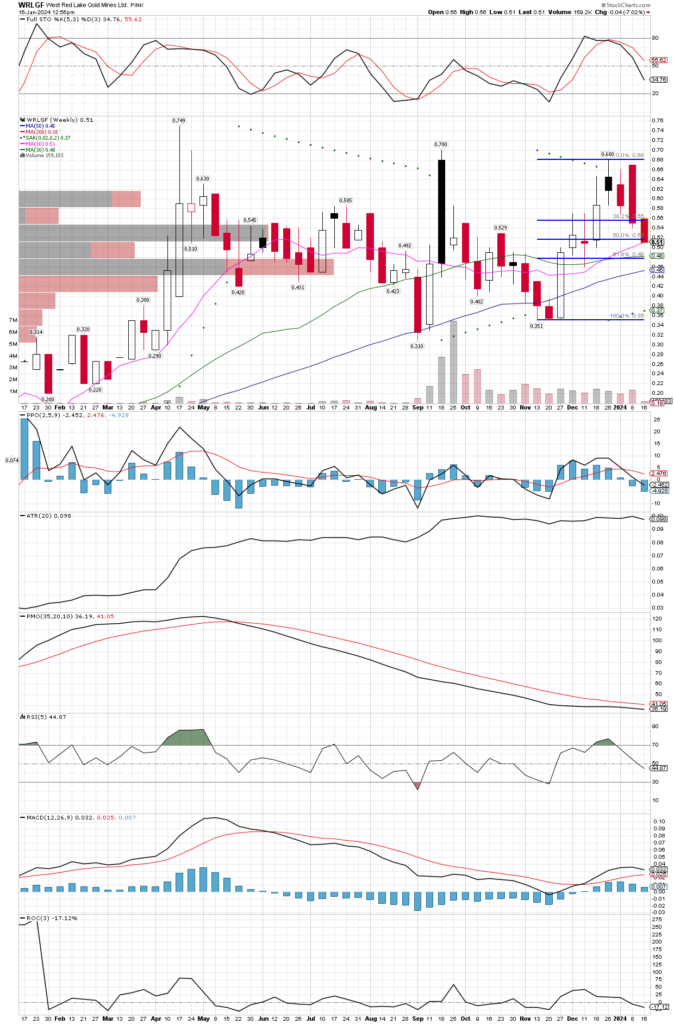
Some Junior Explorers To Buy?

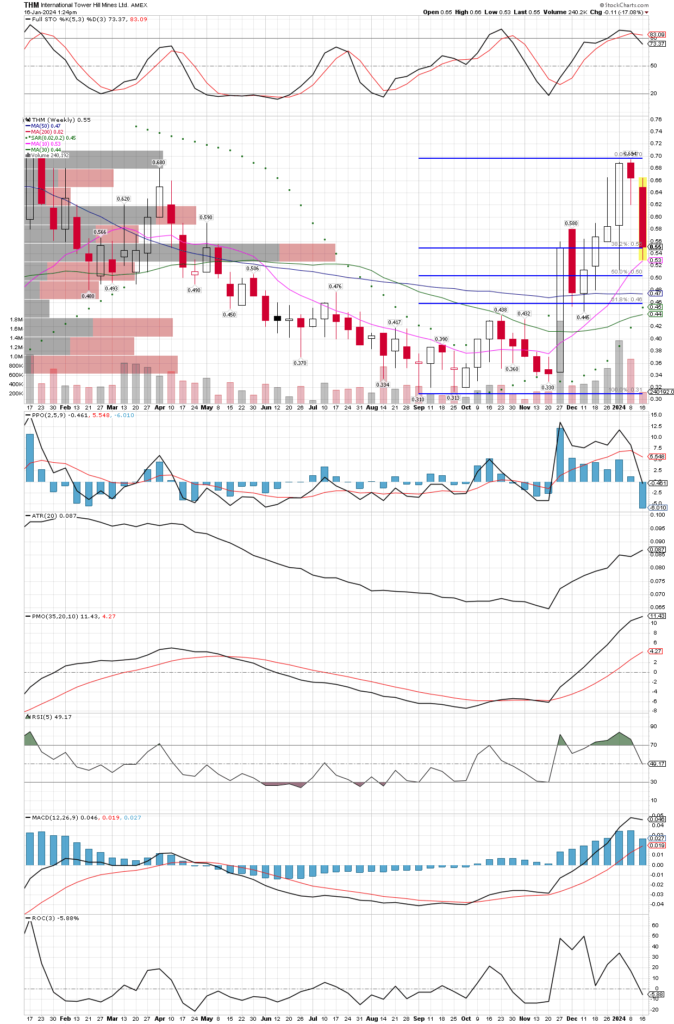
As mentioned before, I will not get too heavily invested in the more speculative junior explorers at this time, since I think many will have to dilute shareholders to raise cash, especially if they see a decent rally first. Still, I am interested in opening positions in the better ones, with a few more shown below. While keeping my exposure to “juniors” via the SILJ etf, which is actually more accurately described as a mid-cap producer etf. I see this area as the safer play as they already have cash flow to fund their exploration, but are still small enough they could be bought out, or grow quickly as they continue to increase their metals reserves. For those with more risk tolerance, starting small positions in the following companies might be a good idea. Go back and check the charts over the last five years (weekly), just to get an idea of just how much devastation has occurred in this group!

I will most likely wait until Friday afternoon to start buying these, as their weekly stochastics are continuing their move lower, but not yet oversold. However, if they mover lower sharply during intraday trading before Friday, I will have “stink bids” in below current prices where I hope to get buy orders filled.

There are several others too, I will try to post a couple charts each day of what I perceive to be some of the better junior exploration companies out there, but remember that these will be smaller positions with far less total risk to portfolios to start. If they work out, I might step in to buy much larger positions, but will keep the overall risk fixed at my pre-determined level, so they will have to prove themselves before I pyramid up in a position.

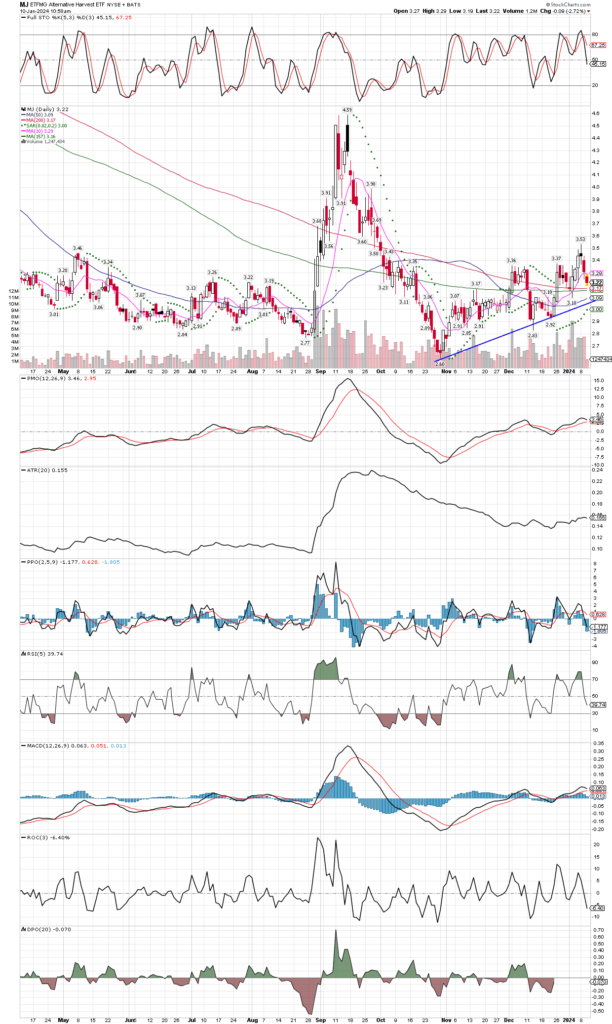
Marijuana Stocks Might Have Bottomed

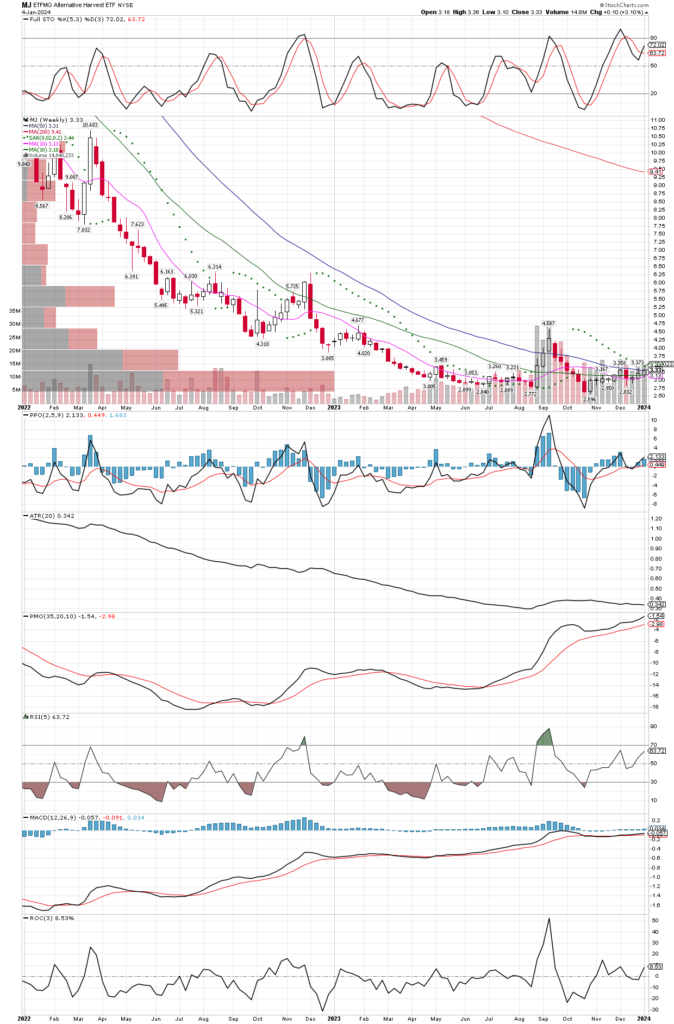
Putting aside personal beliefs on whether one should or should not consume marijuana, no doubt there are many people who do. Besides, a buy signal is a buy signal, so if the MJ etf holds up into the end of this week, I might buy some for myself and the accounts I manage. Or, I could wait until about 10:30 am Monday morning to make sure it respects its moving averages just below the current price. Below are the daily and weekly charts, the weekly shows a long period of sideways movement after a massive collapse the last few years, and if we can get in near the moving averages we have much lower risk. I will use the 30 WEEK MA as my tell.

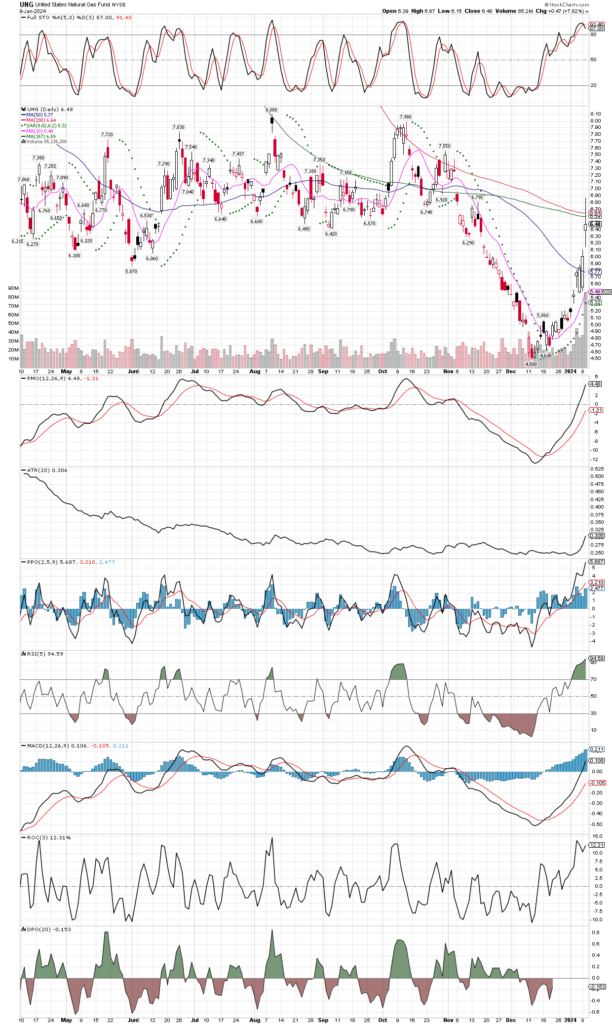
Natural Gas (UNG) Rocketing Higher

We have been patiently waiting for natural gas to come back to life after a near 80% decline from its highs the last year or two. Yesterday the UNG etf traded 4x its usual daily volume, only stopping when running into serious resistance near the 50 and 200 day MA’s. We will be keeping an eye on natgas, as the long, drawn out sideways action after a huge decline might be coming to an end. Let’s see how it holds up, but if it can get above those critical MA’s and then use them as support over the next weeks and months, we will certainly get long. To be determined is which vehicle to use, the futures, the UNG etf, or possibly and natural gas stock etf like FCG, though the latter didn’t react to the big up day in gas, so maybe that is a tell that we will have plenty of time to do our buying. For now, keep your eyes on this chart.

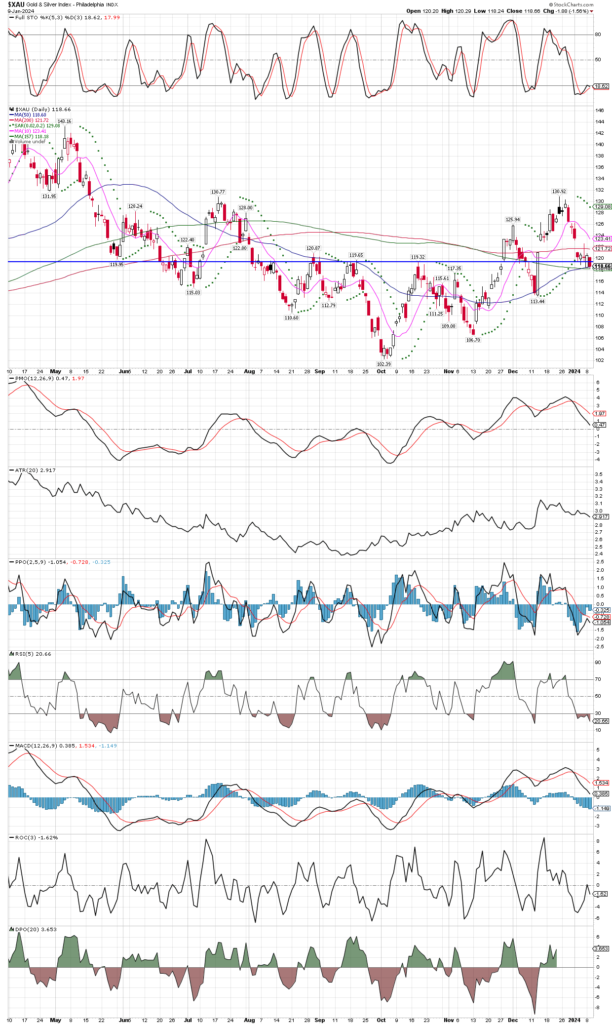
XAU Index Daily Chart

Since I typically focus on long term charts, here is a chart of the XAU daily going back nine months. I quickly drew the horizontal trend line since it jumped out at me, that this might be a good area to buy/add and get on board the bull market.

Buying Novo Resources and Eloro Resources

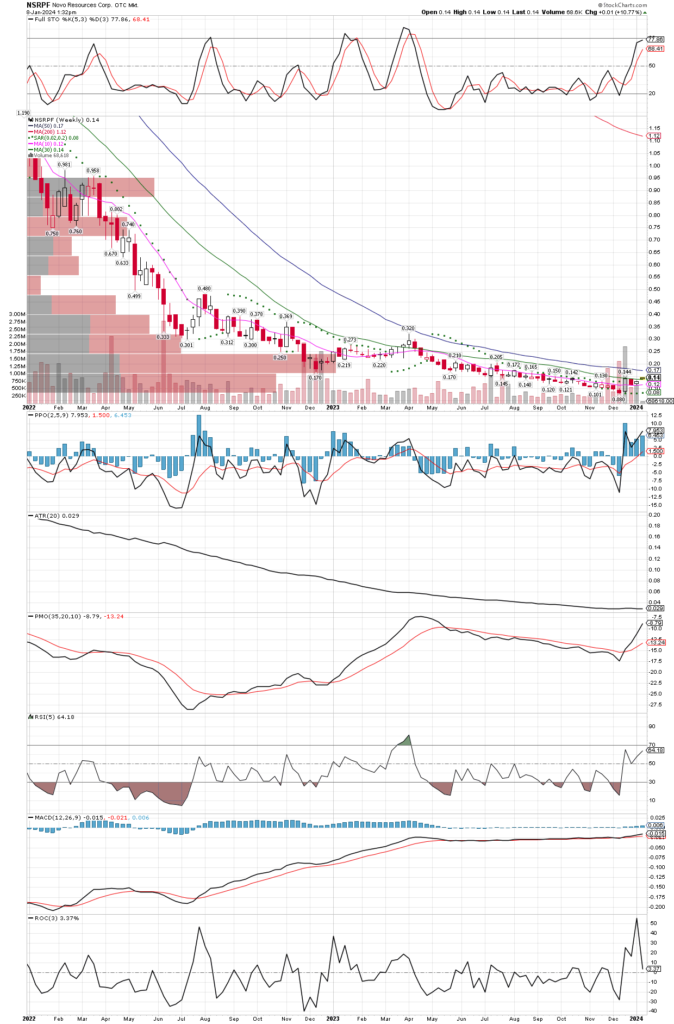
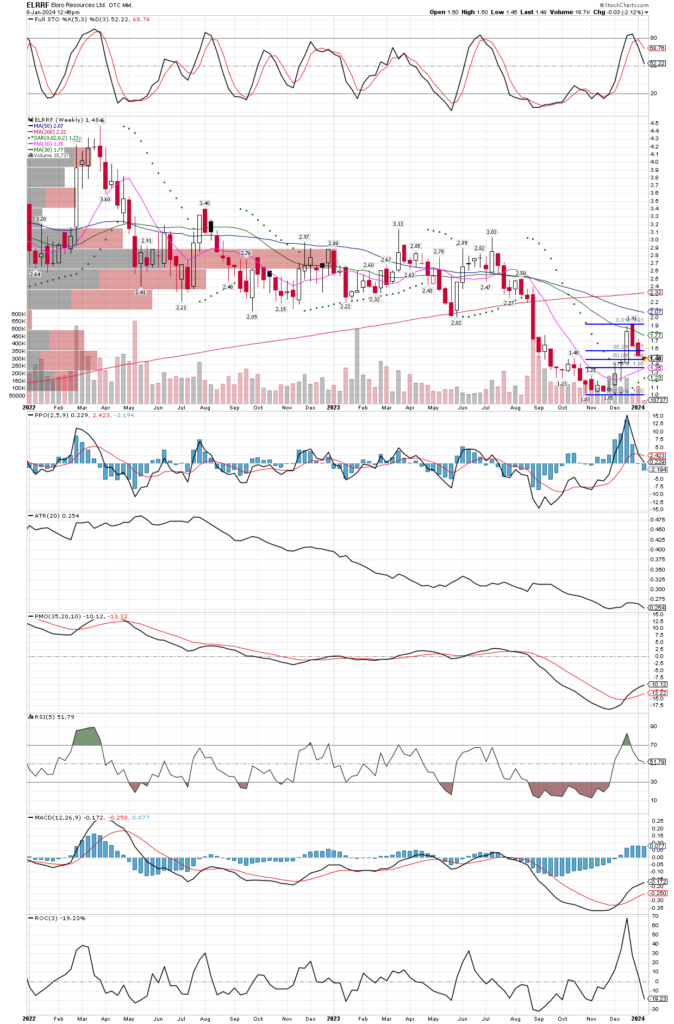
I’m buying into Novo and Eloro, symbols NSRPF and ELRRF, keeping the total risk on each quite small, since my focus remains honed in on the mid-cap producers and developers with exploration upside. NSRPF is working up over its 30 WEEK MA, while ELLRF has pulled back 50% of its recent sharp rally.

Picking Up Some JAGGF (Jaguar Mining)

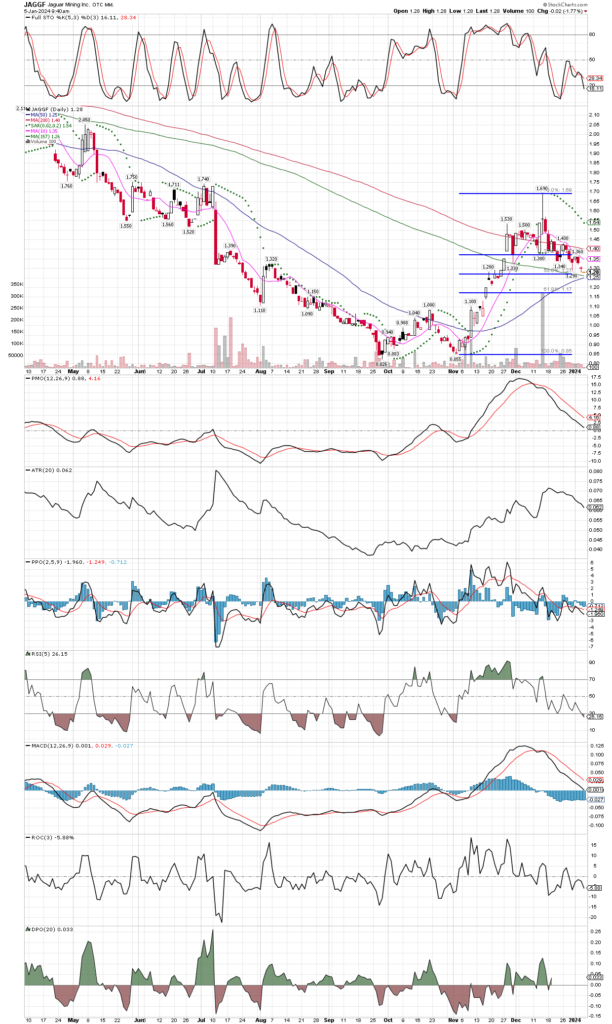
Starting a position in Jaguar Mining (JAGGF), as its pulled back to near it’s 30 WEEK MA, as well as a 50% retracement of the rally from the four year lows. it’s a miner in Brazil, and Eric Sprott is a big shareholder (over 44%), they have no debt and cash in the bank, producing gold since 2006. This entry allows for a very tight stop, so not much risk from today’s price. Note that this is a DAILY chart, so the closest thing to the 30 WEEK MA is the green moving average.

Marijuana ETF has a Buy Signal

If the MJ etf closes above it’s 30 WEEK MA today, Friday, Jan 5, 2024, we will take a position. While this is just a technical chart setup, it offers an entry with fixed, and very limited total risk (TR) of just .5% of the accounts I manage. The stop-out level would be any WEEKLY close below the 30 WEEK MA at $3.18 and rising a little each week. Having such a close stop-out level allows us to have a large position size, and since we hold the position until a weekly close below MJ’s 30 WEEK MA, we could be in this trade for awhile as long as its working, the essence of the phrase “letting your winners run.” We won’t know if we are buying until just before the close today (Friday), in which case we might buy at the close, or even on Monday morning before 11 am or so.

Adding Heavily to CDE, HL, SILJ and Other Miners

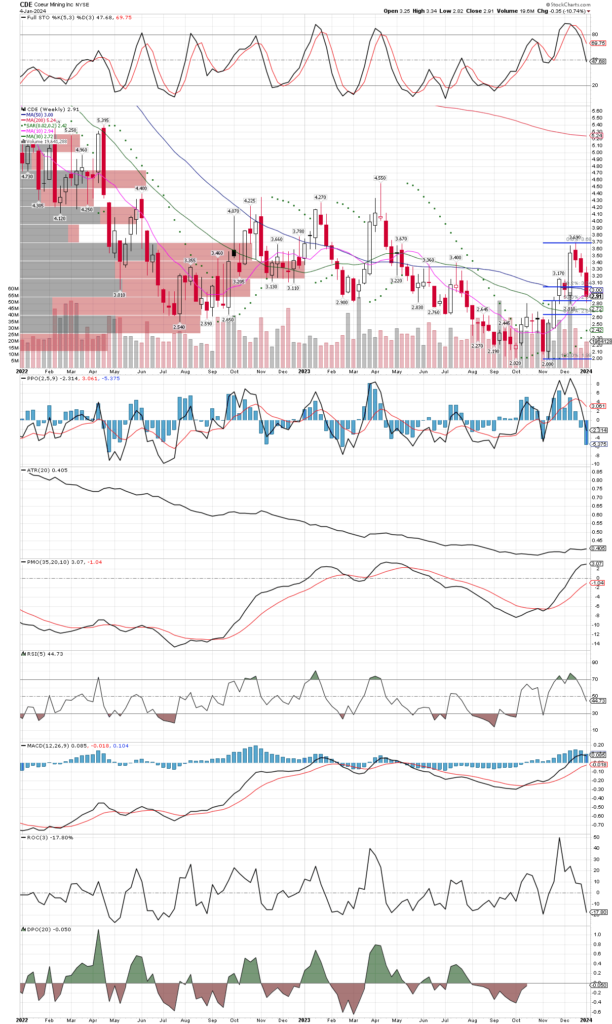
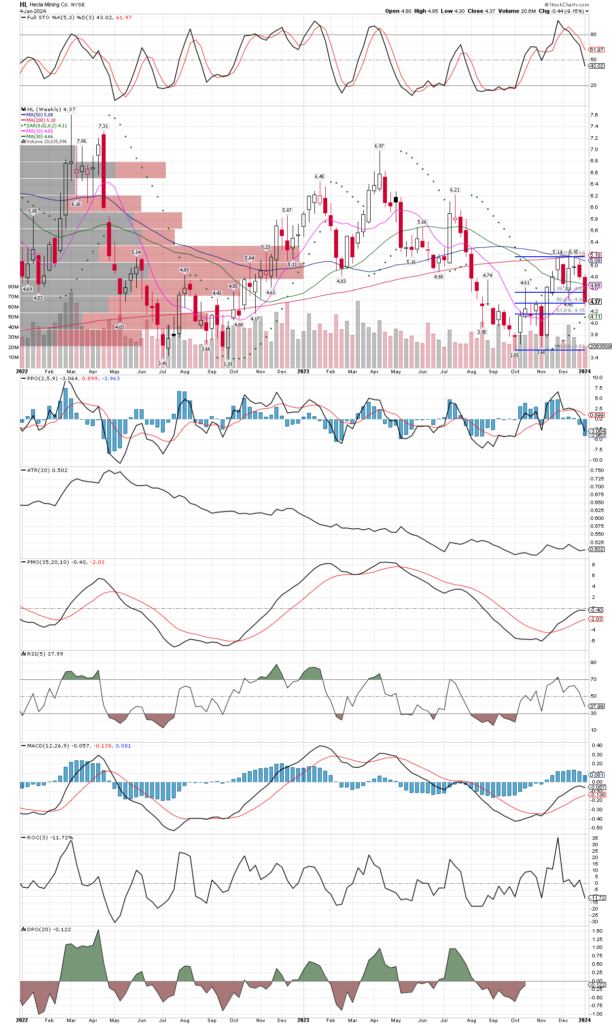
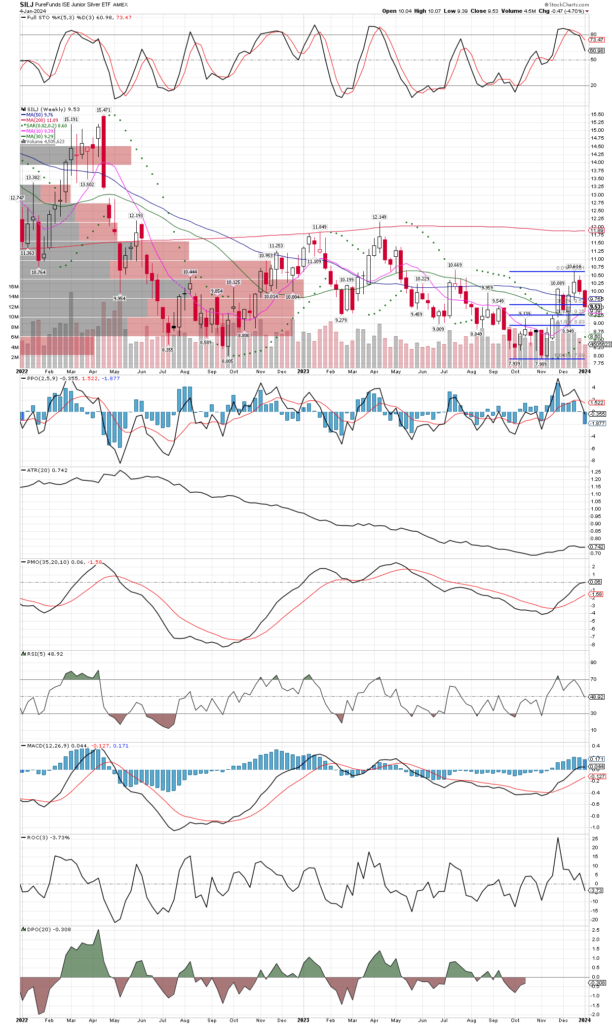
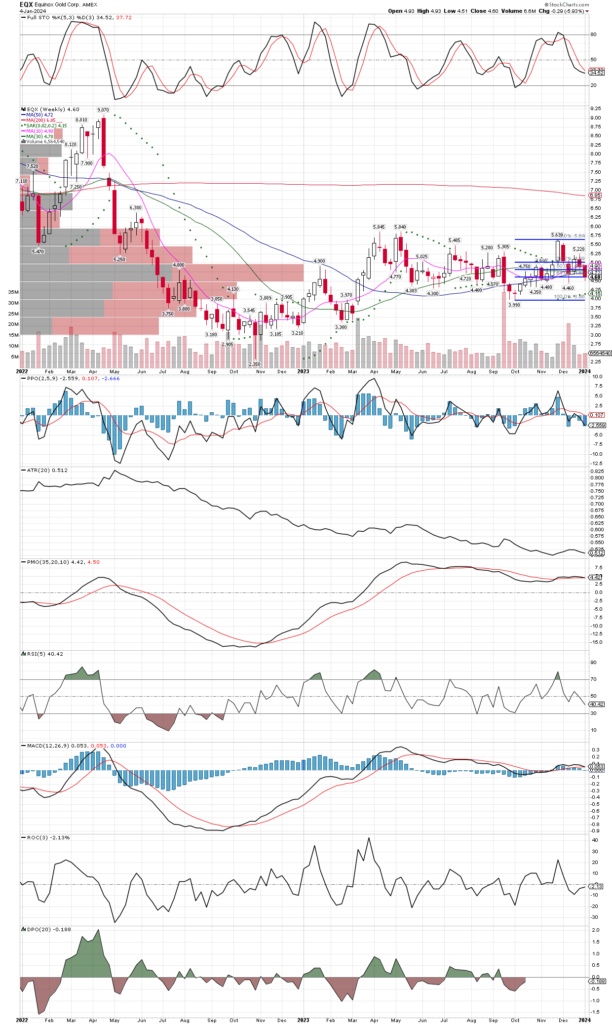
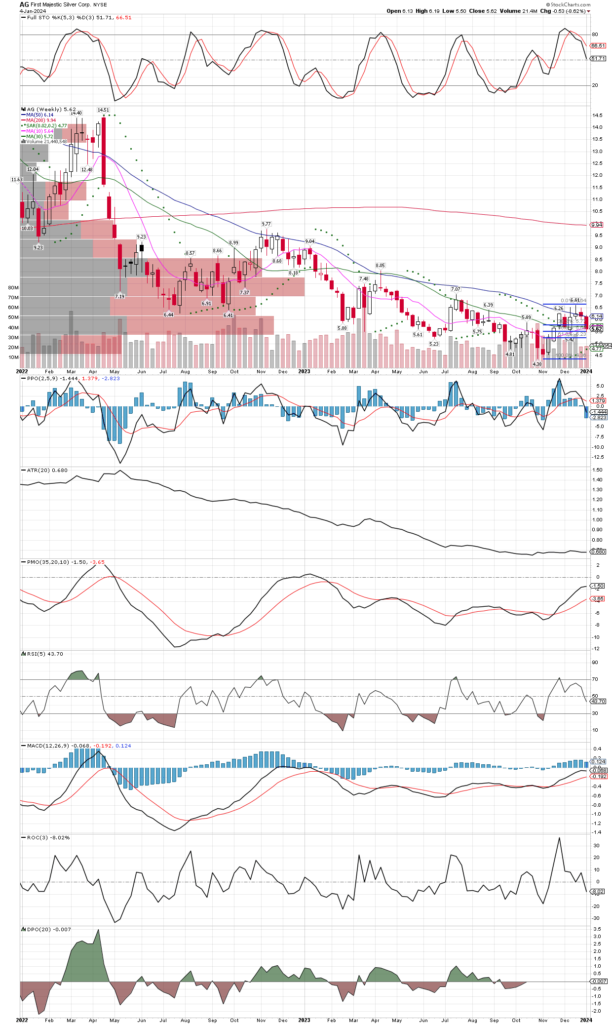
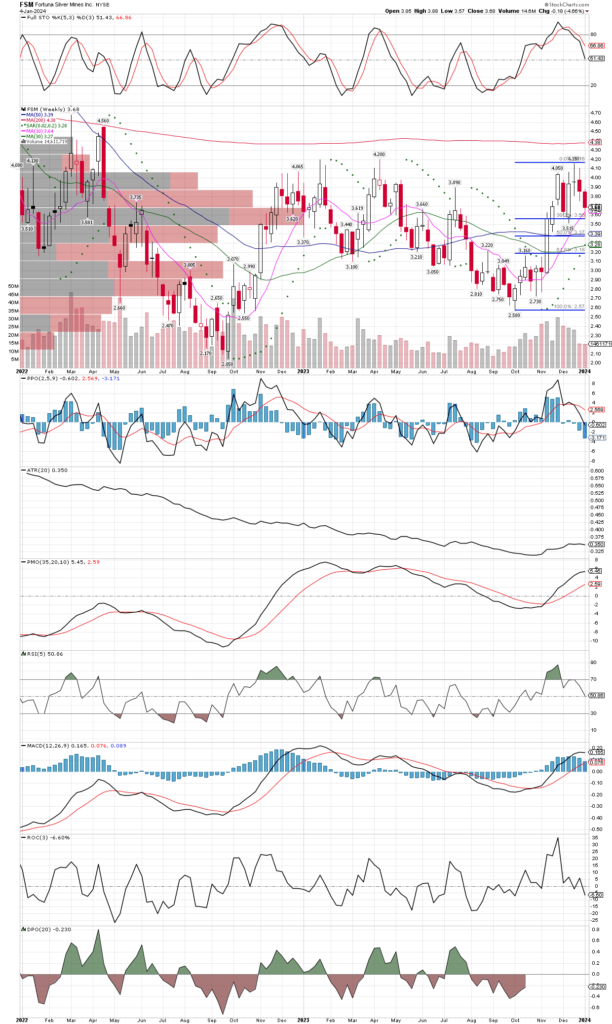
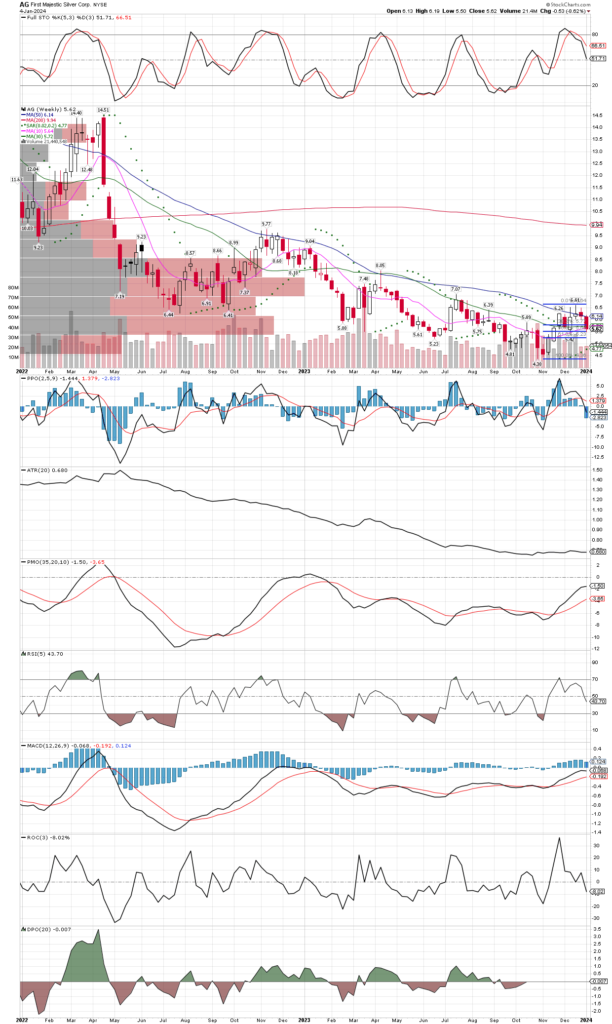
I’m taking advantage of this pull back early into the new year to add to CDE, HL, SILJ, FSM, EQX, SVM, AG, and several other miners. Many have retreated 50% or so of their recent rally, so this seems a good area to add to holdings. Weekly graphs below:

You get the picture. I have also begun to nibble on some junior explorers that were absolutely demolished in 2023, though I will stay focused on the mid-cap producers for the time being. I have a list of “penny dreadfuls” that I might buy into at some point in this bull market, but I am concerned that they will dilute shares to raise capital, after being starved for funds the last couple years. This could keep a lid on their prices. I also feel there could be general market weakness soon, maybe enough to drag down weaker stocks, so prefer established producers that are more of a safe haven.

There are some other groups that are flashing BUY signals or close to doing so, and I will cover those in a separate post.

I Was Wrong About SILJ Never Going Below $10 Again

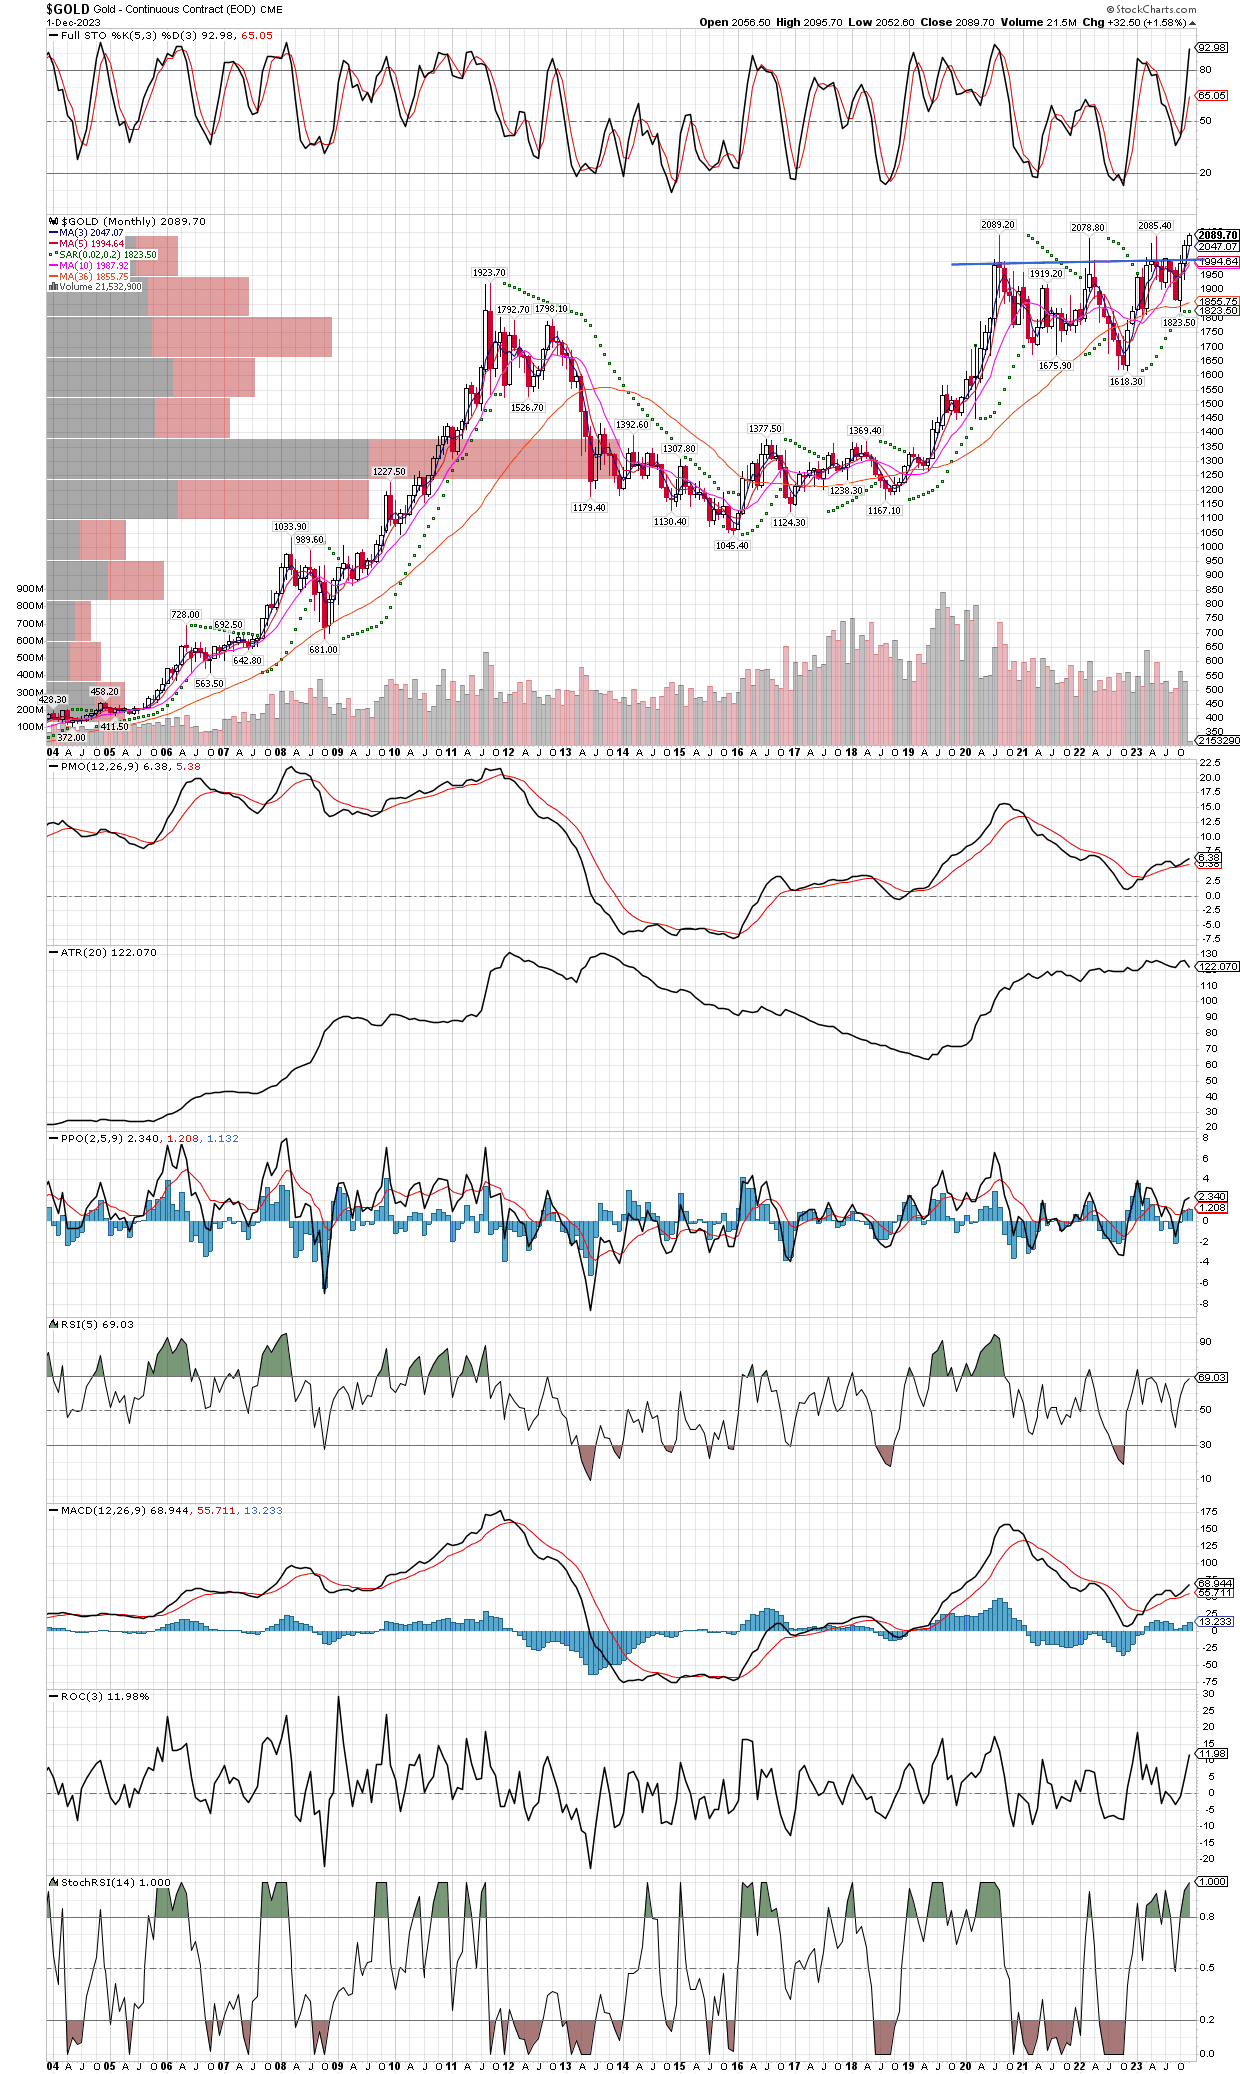
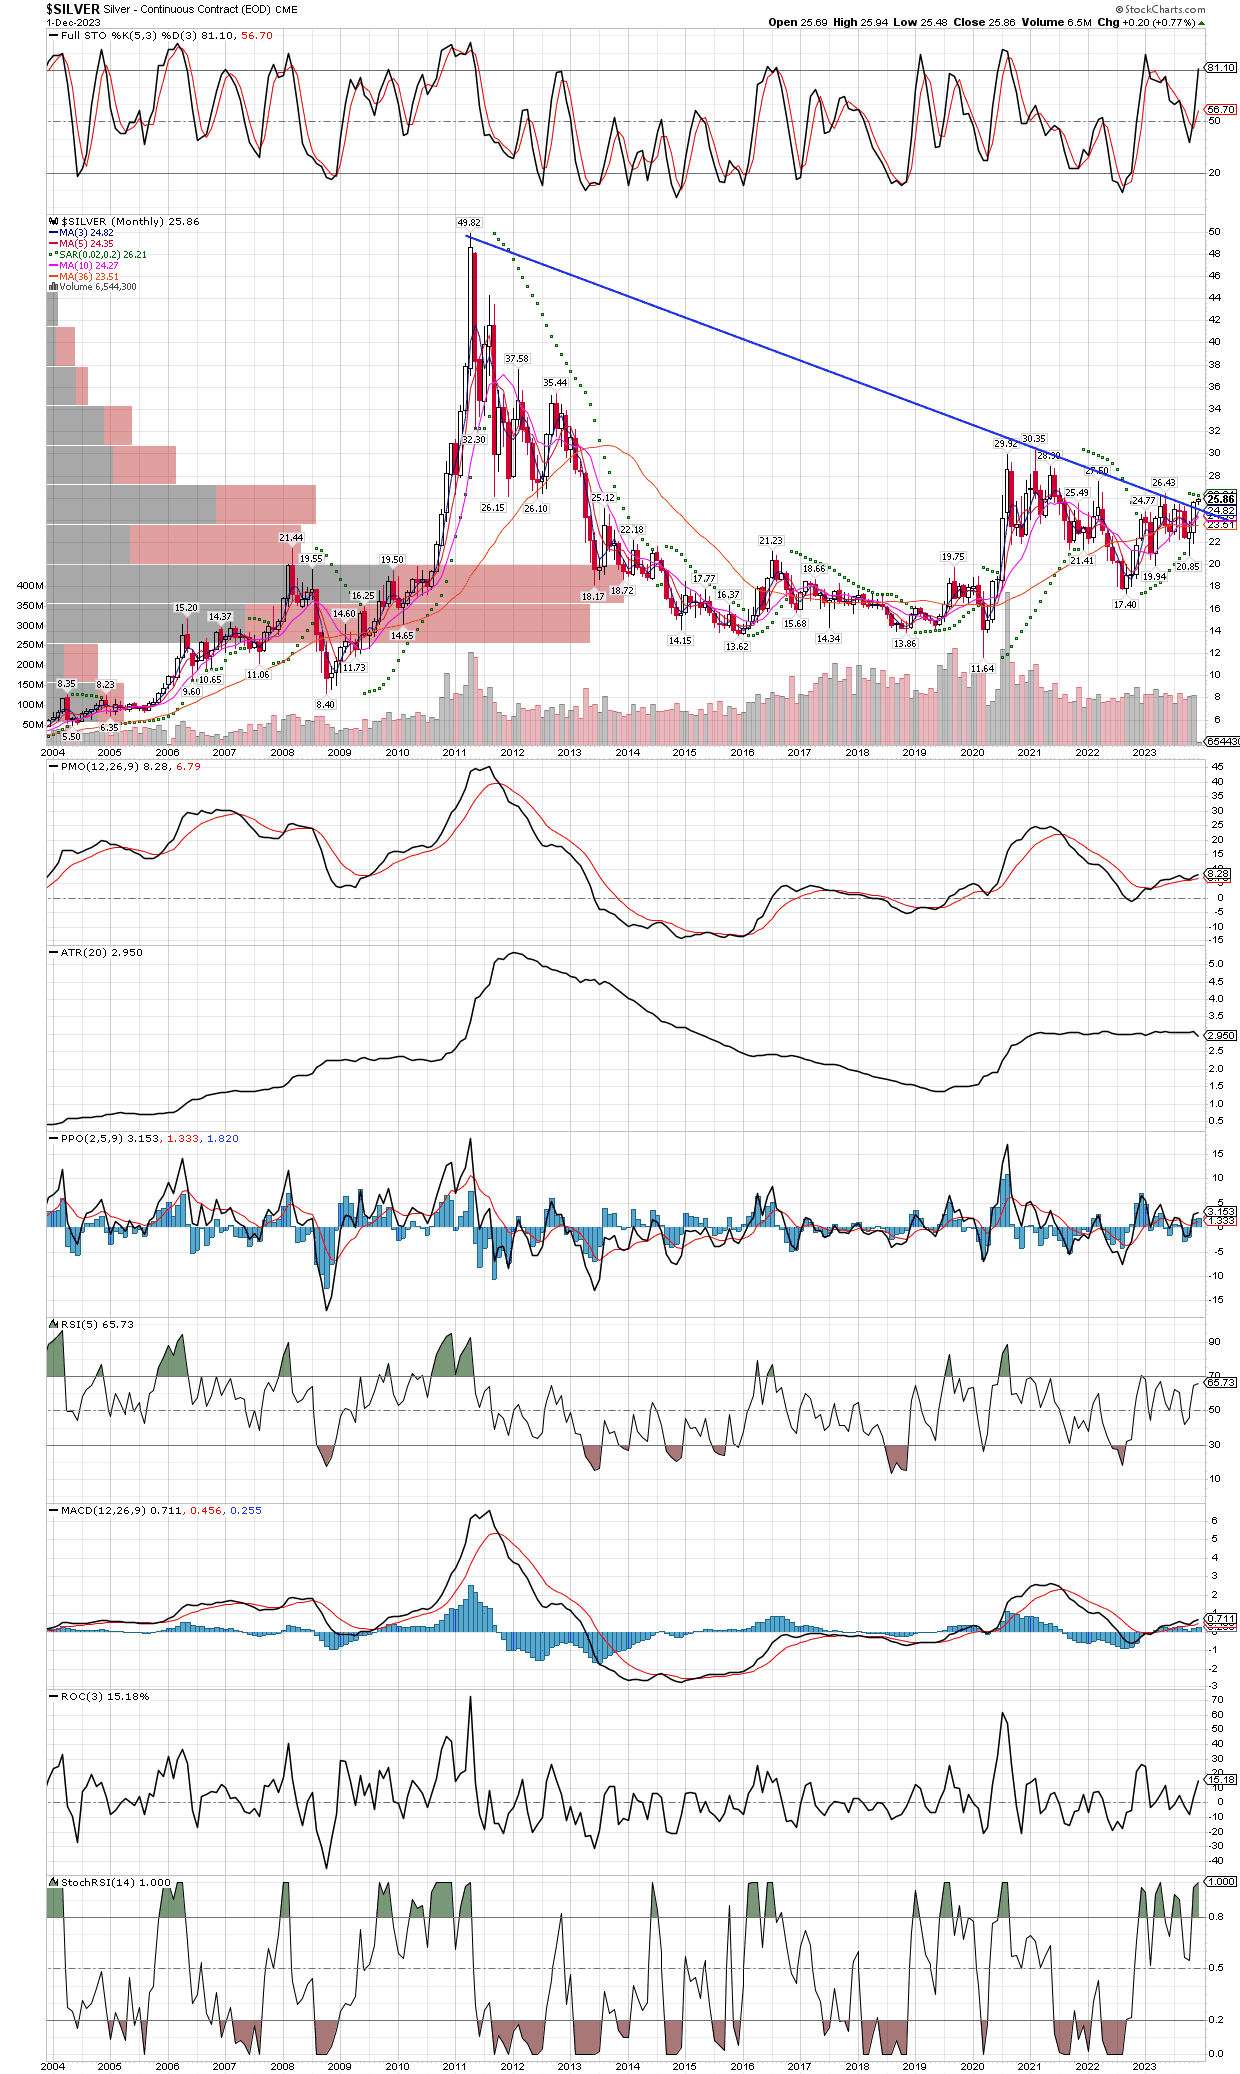
I was wrong, SILJ didn’t just visit $10 again, it went down to $8, in one of the worst maulings miners have seen, defying all logic on valuations, focused only on the Fed’s tightening (raising) of interest rates. We were stopped out of some positions, but remain very heavily invested as we recently bought back in, even added to positions via LEAP options that expire in January 2026. It was a rough ride and unexpected on my part, as each time they looked as if they turned the corner, they were beaten lower again, even greatly underperforming the metals themselves. I will get into the details more soon, since we have gotten mostly re-invested for yet another try, I have more time to share observations here as we head into the end of the year. For now, let me just post two long term (monthly) chart going back twenty years each, to give the reader an idea as to why we went back in heavy recently on SILJ and some individual miners.

$GOLD has a very clear, long tern cup and handle pattern that has finally culminated in an all time monthly closing high. Its a clear breakout, and while I won’t surprised nor the least bit concerned if gold pulls back some time soon, this chart tells us gold is making its move to a new, higher trading range that has yet to be defined on the upside. It’s very bullish.

$SILVER is doing some tricks of its own, and just recently started to outperform gold, another sign the secular bull market has kicked in again. As many have pointed out, silver goes up later than gold, but much farther and faster. Considering it is still only half its all time price high seen twice before, in 1980 and 2011 at $50, silver could truly make some eye-popping gains of several hundred percent. I will remind readers that in 2016, silver only rose 50% from the lows, but maybe of it’s miners were up 500% or more, even the SILJ etf rocketed over 380%! This is why were are heavily invested in silver and gold miners (most silver miners get half their revenue or more from gold, so they are diversified between the two), and the best part is that they are the standout group when everything else is getting demolished. I have little doubt that while silver might take a breather and consolidate even for a year or two around $50, it will likely go way past that level ,offering several hundred percent returns just on the physical metal, imagine what the miners will do in that scenario? Best to own some, if not a lot, like us.

Commodities vs. Stocks

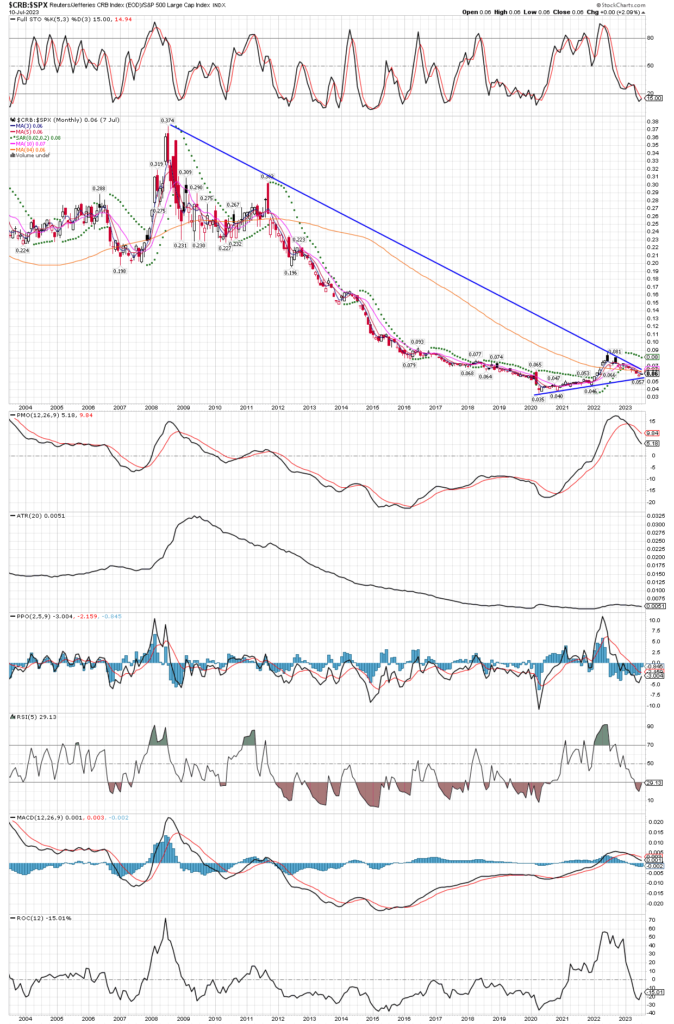
Here is a monthly chart of the $CRB commodity index vs. the $SPX S&P500 index, going back twenty years. Two things to note, first is that the big run higher with inflation from 2021 is hardly a blip on the chart. The second thing that jumps out at me is how much potential upside commodities have, after what appear to be just the first leg of a new commodity bull. Once the ratio gets over the downtrend line, commodities could rocket higher. The ratios stayed in a range from 2003 (as far as this chart can go back) until it broker lower in 2012, at a level OVER 3x higher than where it sits today! Just getting back to that area would be a bull market to behold in commodities and the stocks of companies that produce them. I maintain that we haven’t seen anything yet, and nothing like what we will see over the next several years.

Commodities have a long way to run on the upside

SIGN UP FOR UPDATES

NO SPAM, EVER!