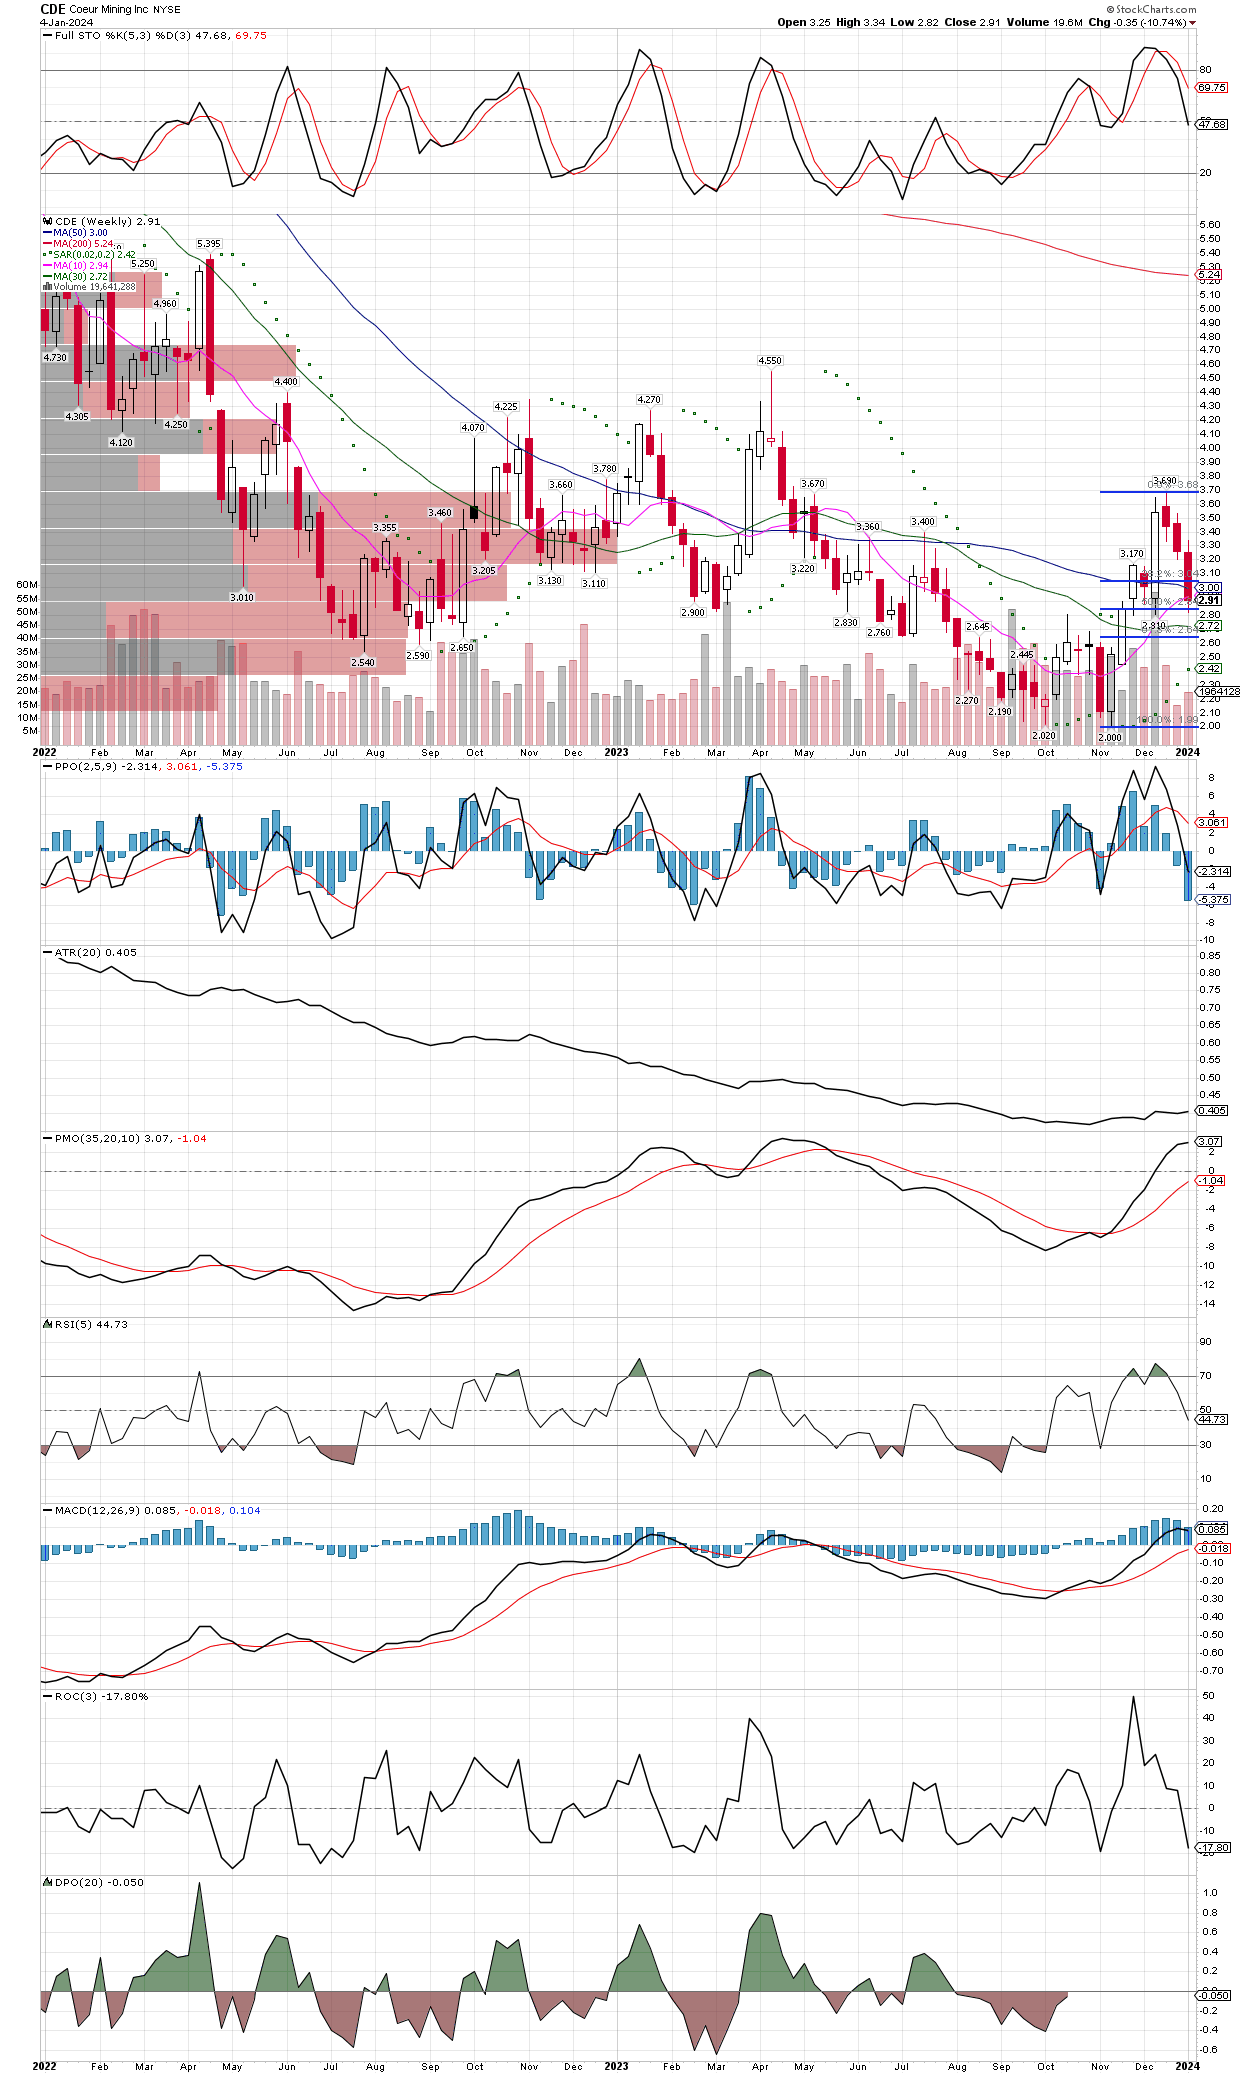
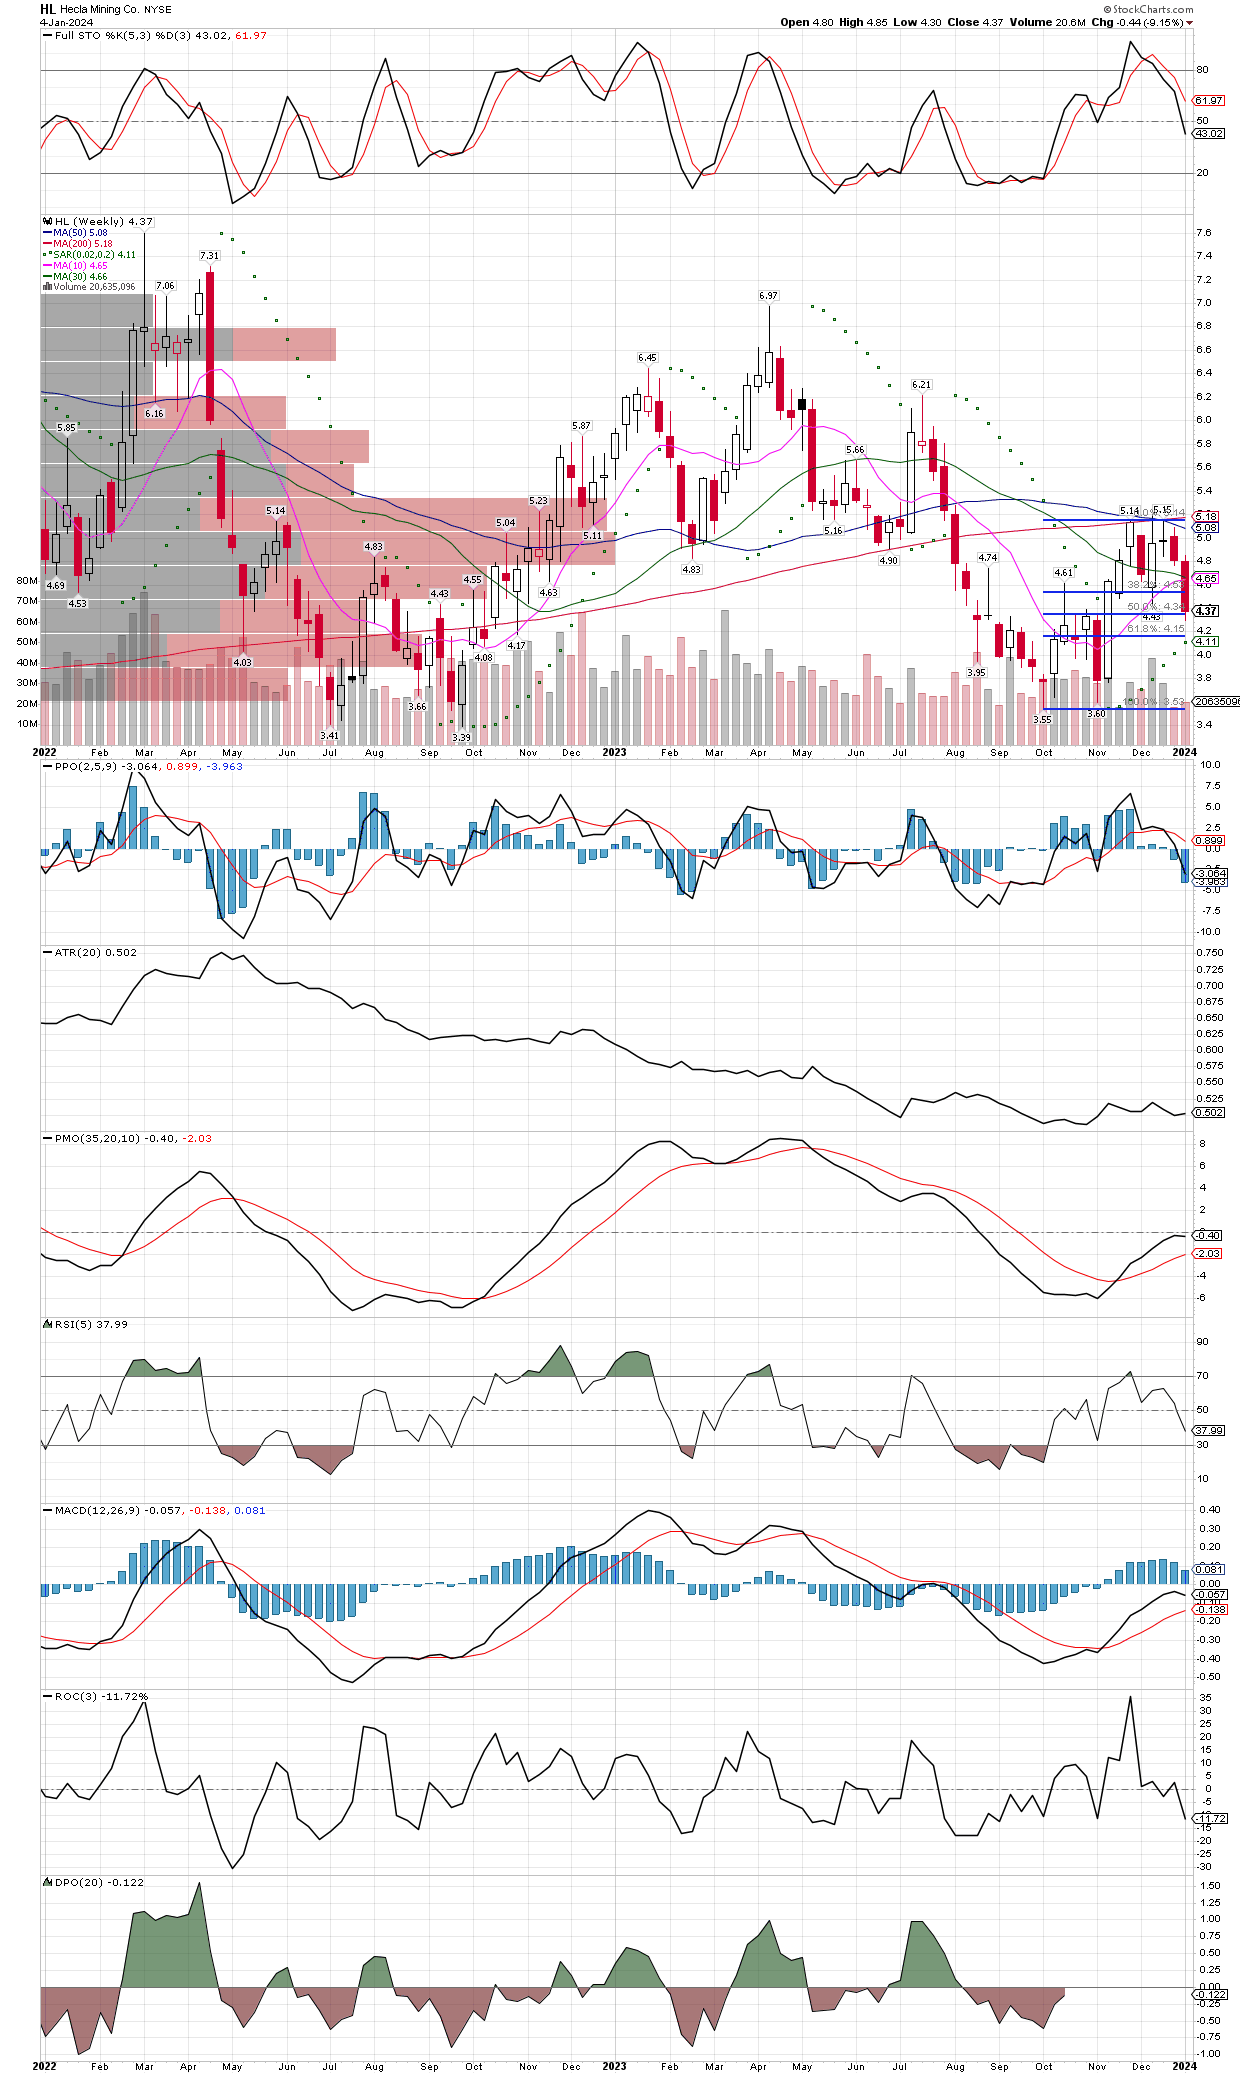
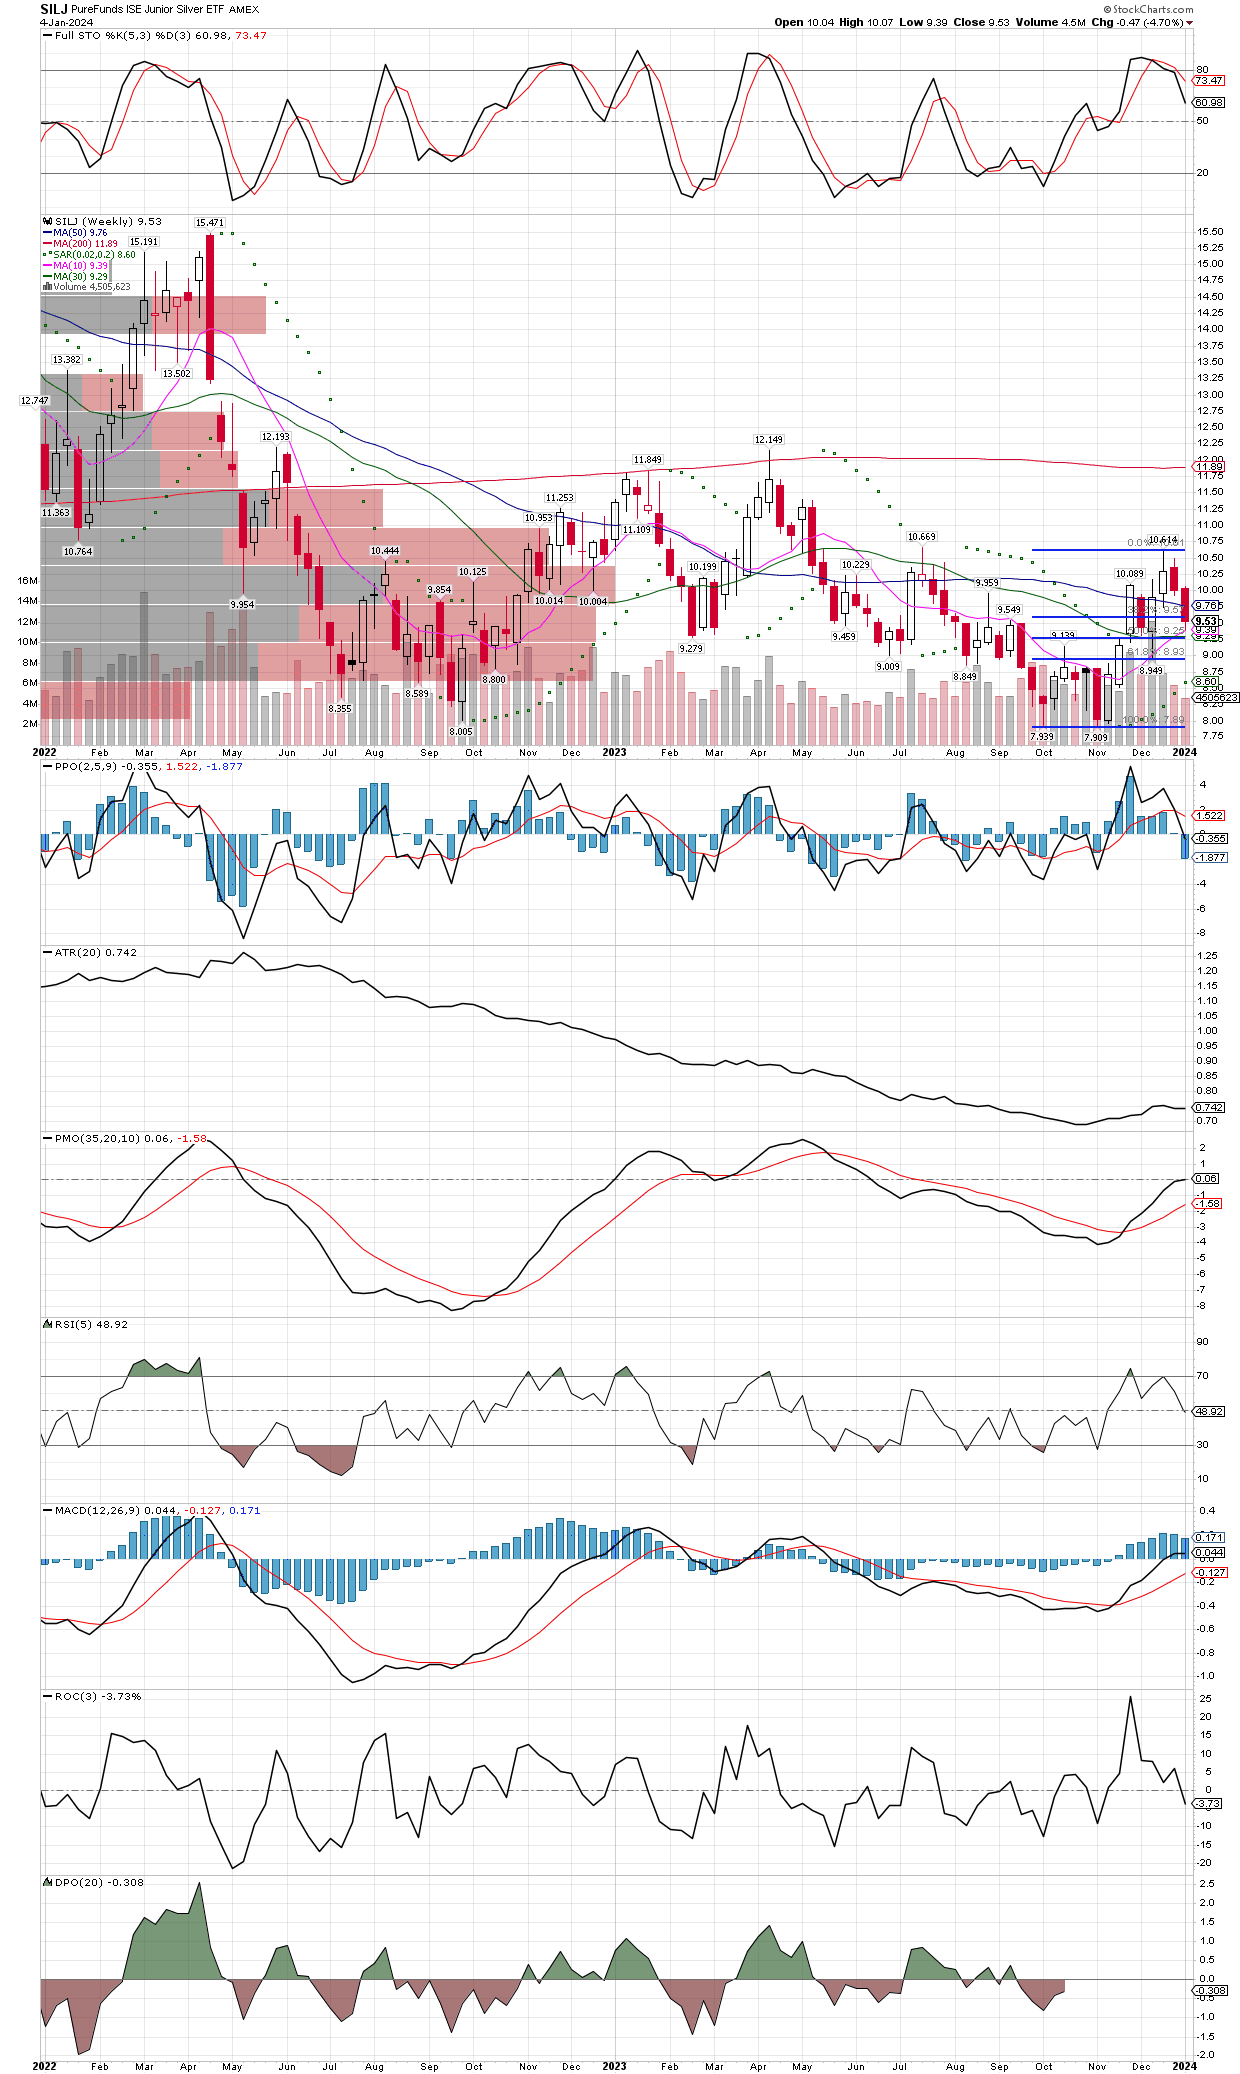
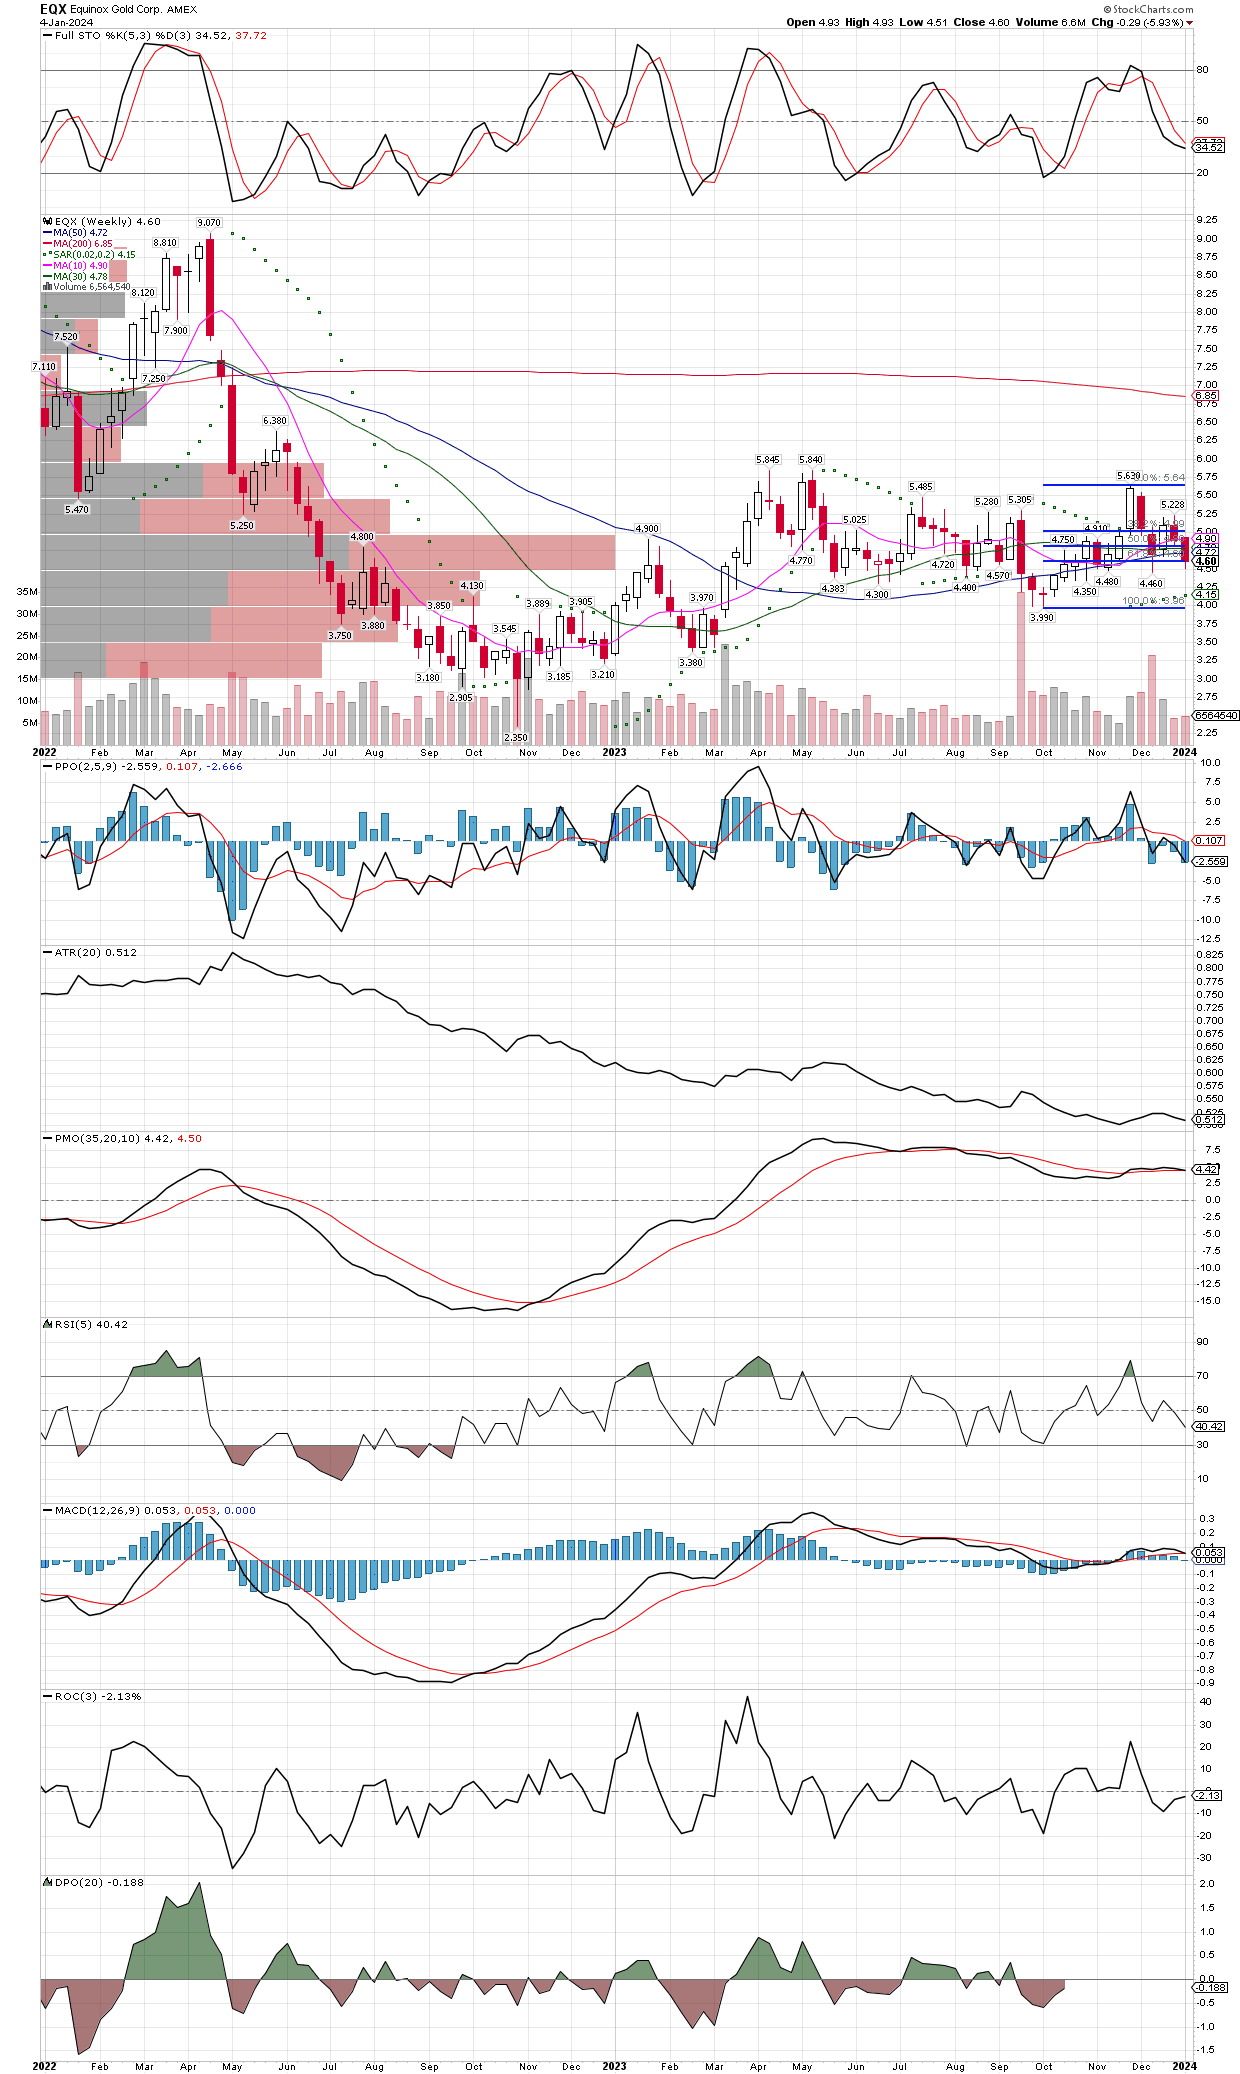
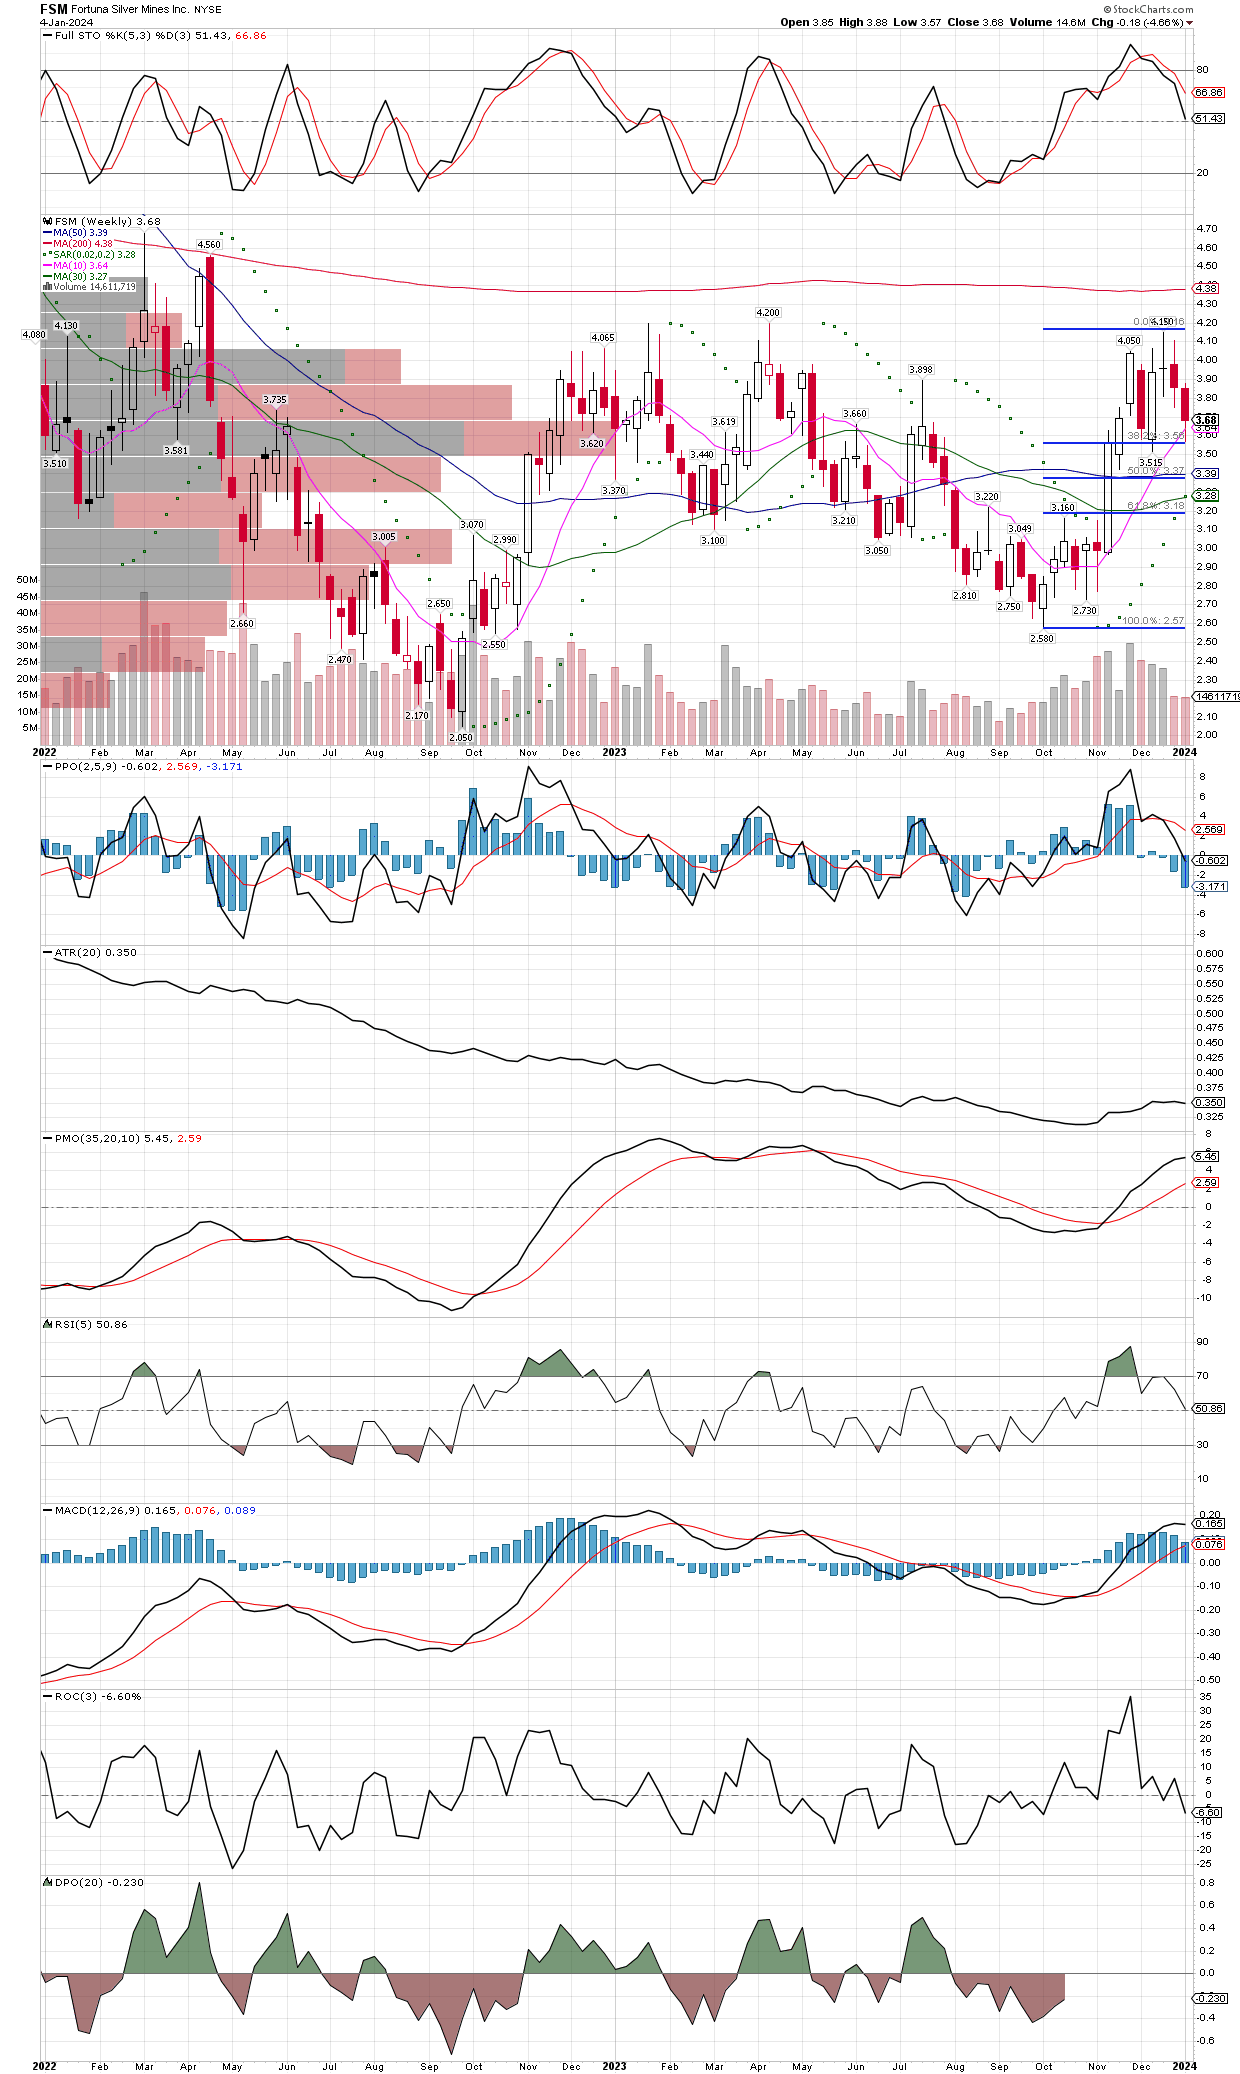
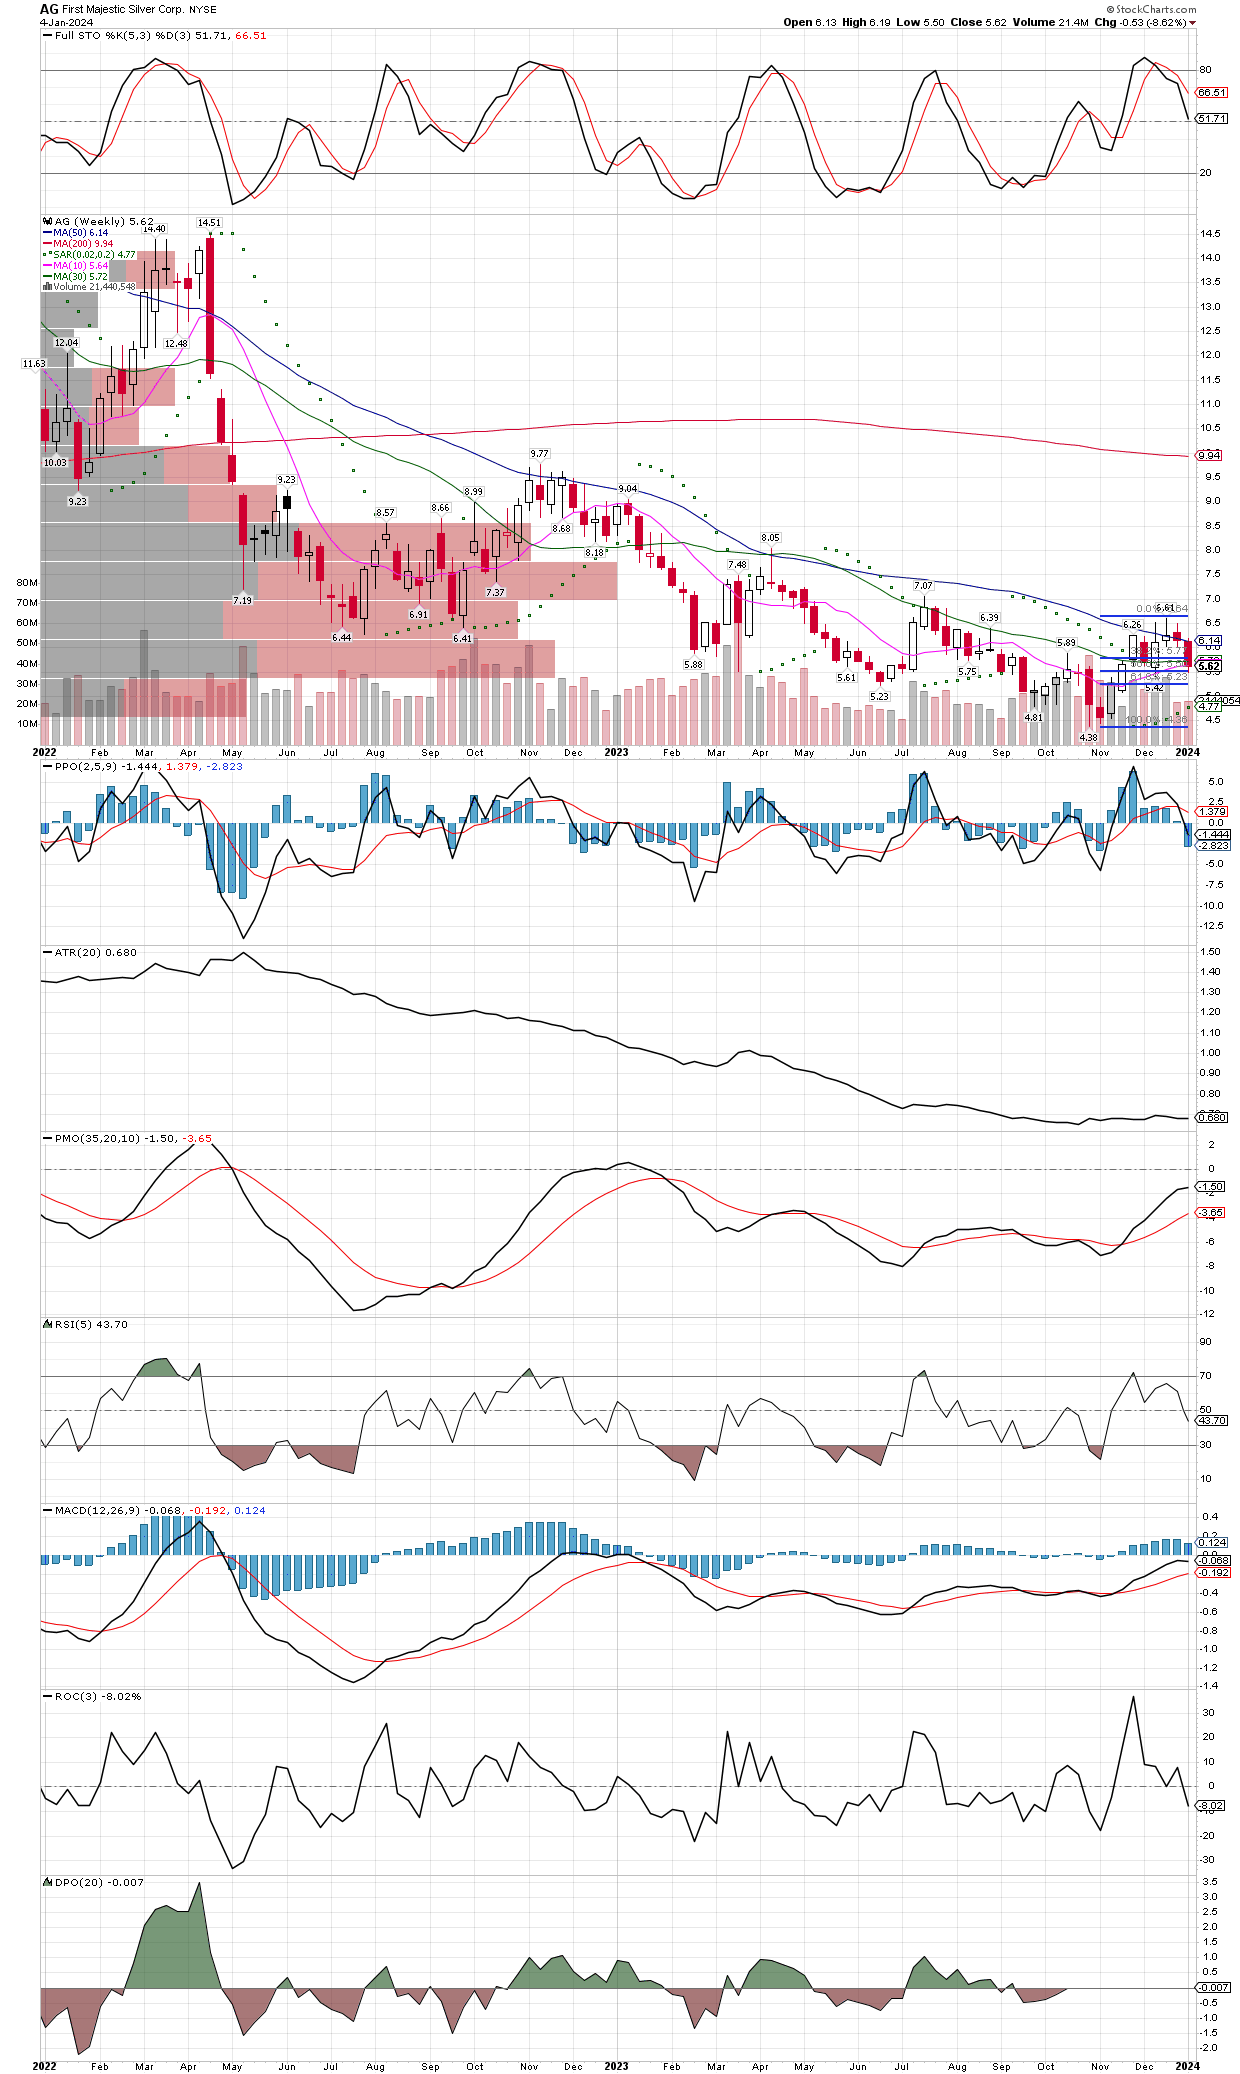
I’m taking advantage of this pull back early into the new year to add to CDE, HL, SILJ, FSM, EQX, SVM, AG, and several other miners. Many have retreated 50% or so of their recent rally, so this seems a good area to add to holdings. Weekly graphs below:
You get the picture. I have also begun to nibble on some junior explorers that were absolutely demolished in 2023, though I will stay focused on the mid-cap producers for the time being. I have a list of “penny dreadfuls” that I might buy into at some point in this bull market, but I am concerned that they will dilute shares to raise capital, after being starved for funds the last couple years. This could keep a lid on their prices. I also feel there could be general market weakness soon, maybe enough to drag down weaker stocks, so prefer established producers that are more of a safe haven.
There are some other groups that are flashing BUY signals or close to doing so, and I will cover those in a separate post.
I was wrong, SILJ didn’t just visit $10 again, it went down to $8, in one of the worst maulings miners have seen, defying all logic on valuations, focused only on the Fed’s tightening (raising) of interest rates. We were stopped out of some positions, but remain very heavily invested as we recently bought back in, even added to positions via LEAP options that expire in January 2026. It was a rough ride and unexpected on my part, as each time they looked as if they turned the corner, they were beaten lower again, even greatly underperforming the metals themselves. I will get into the details more soon, since we have gotten mostly re-invested for yet another try, I have more time to share observations here as we head into the end of the year. For now, let me just post two long term (monthly) chart going back twenty years each, to give the reader an idea as to why we went back in heavy recently on SILJ and some individual miners.
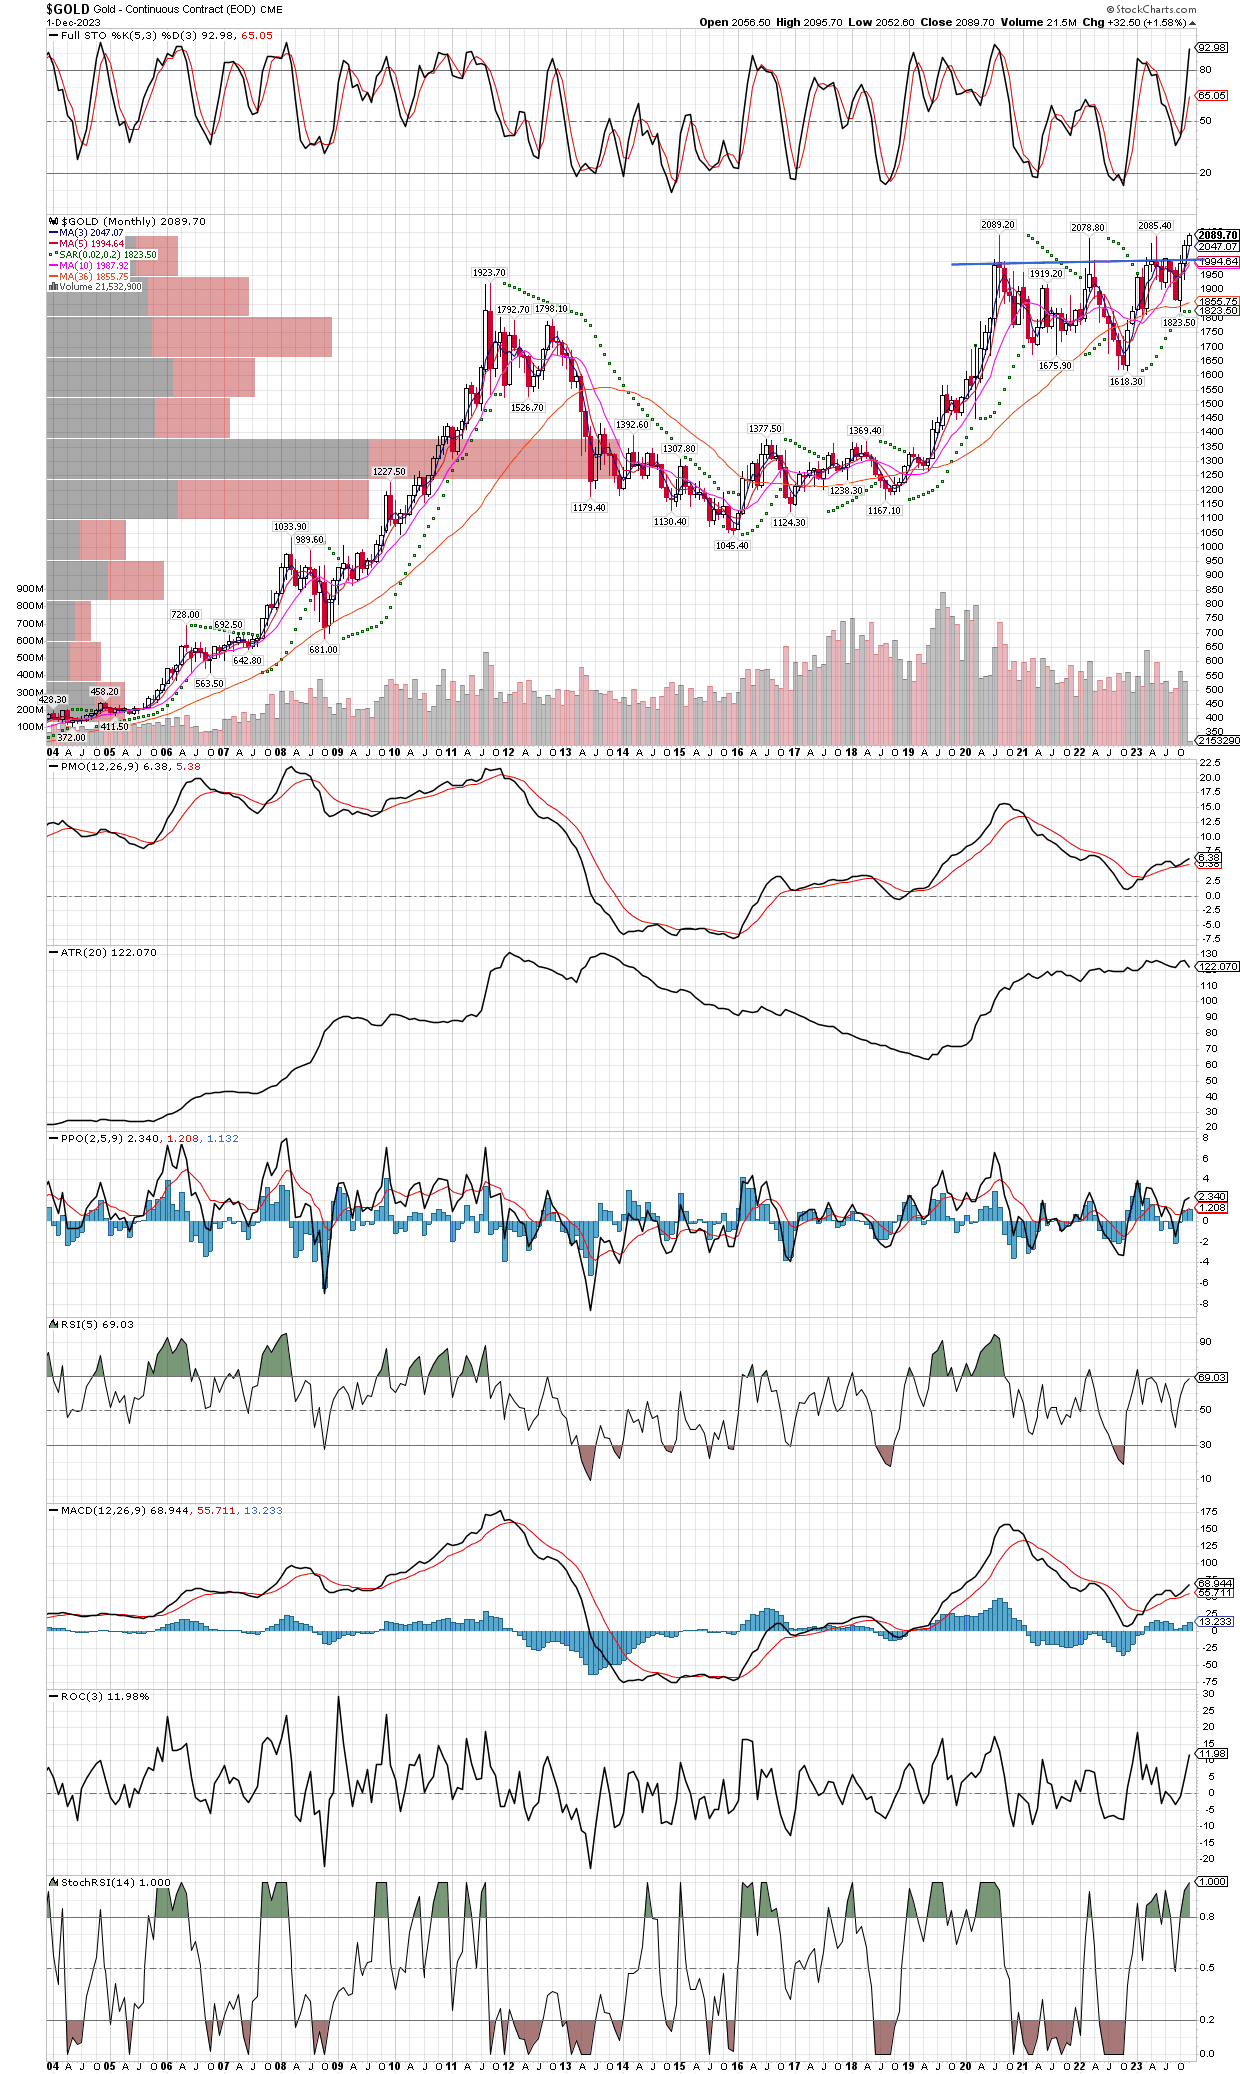
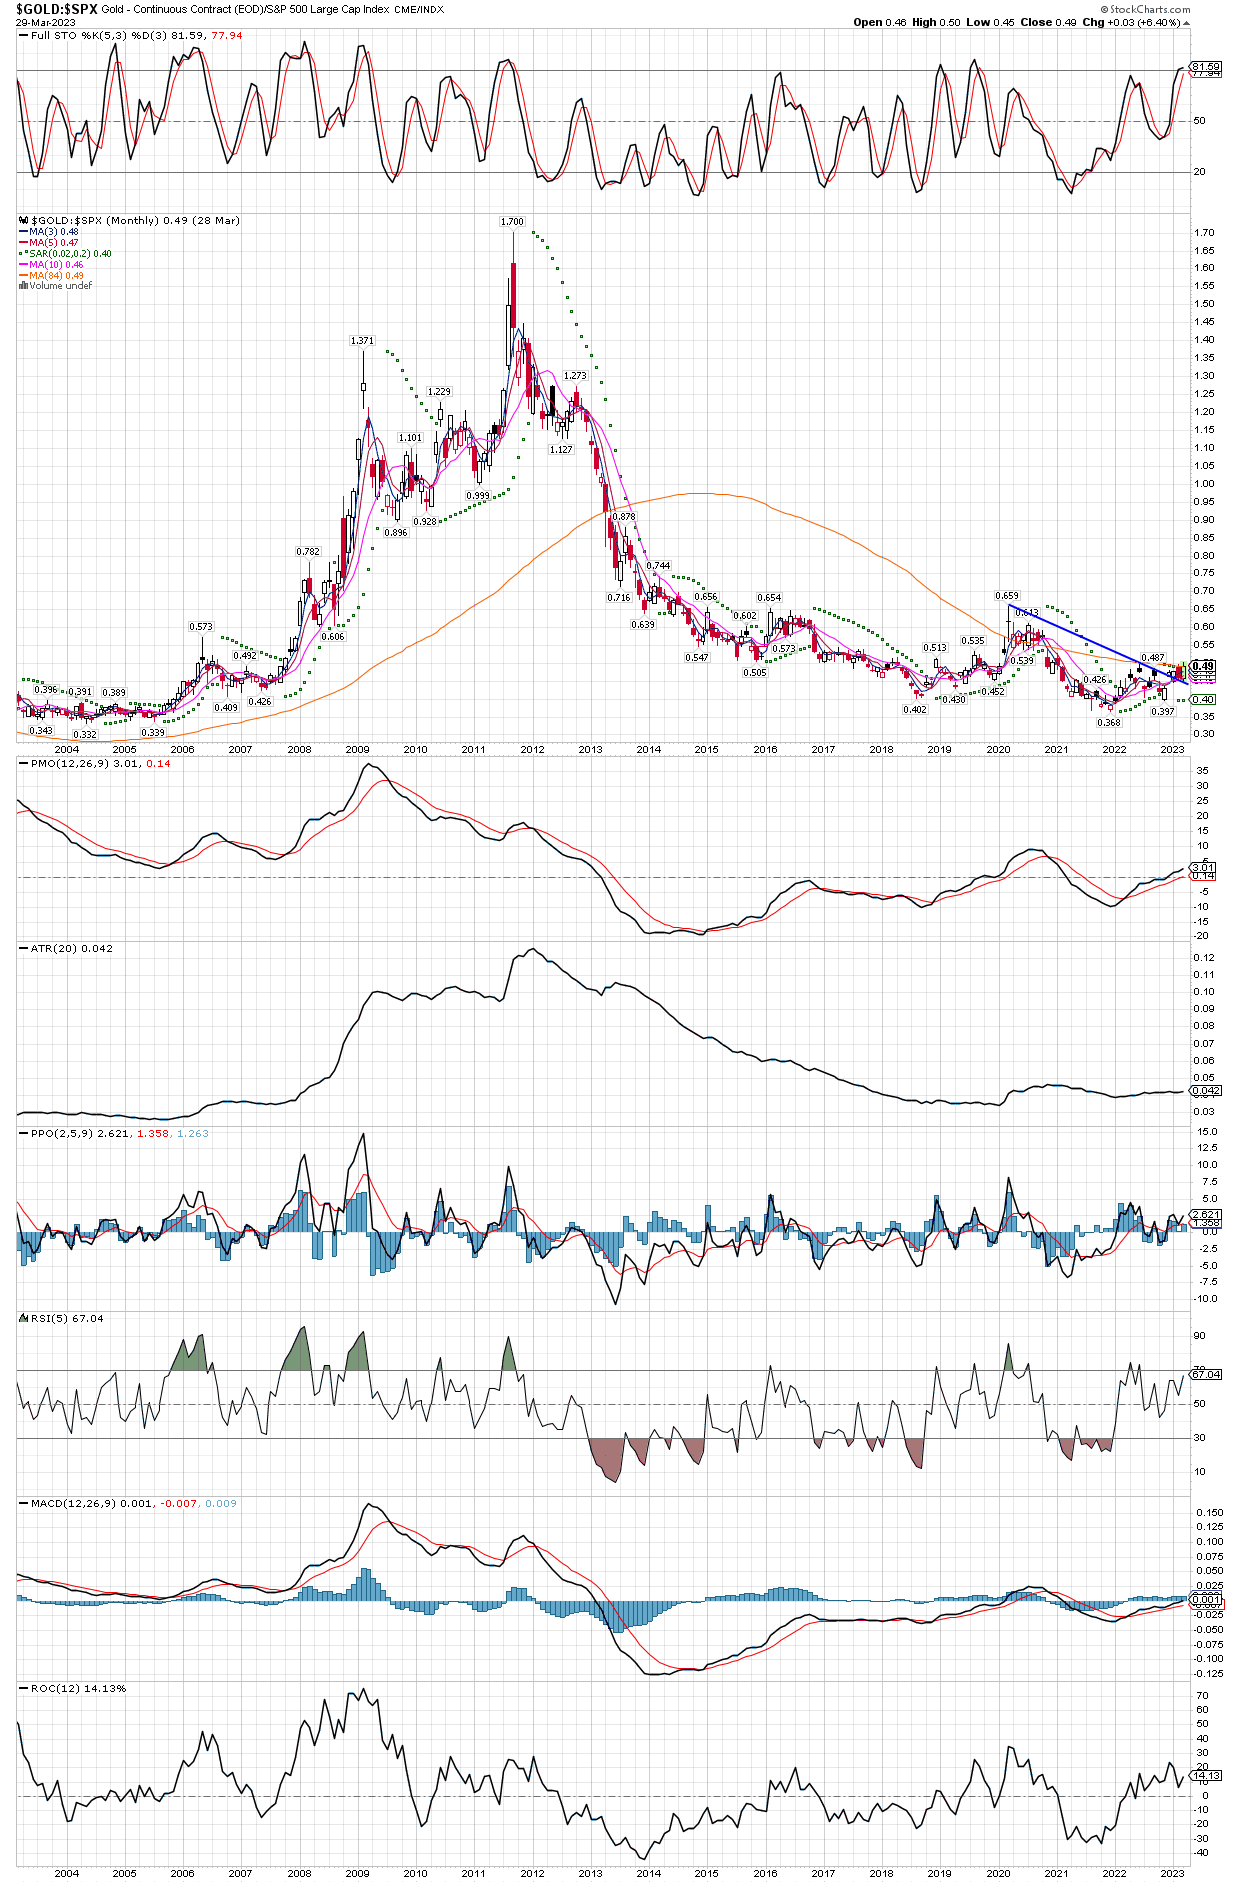
$GOLD has a very clear, long tern cup and handle pattern that has finally culminated in an all time monthly closing high. Its a clear breakout, and while I won’t surprised nor the least bit concerned if gold pulls back some time soon, this chart tells us gold is making its move to a new, higher trading range that has yet to be defined on the upside. It’s very bullish.
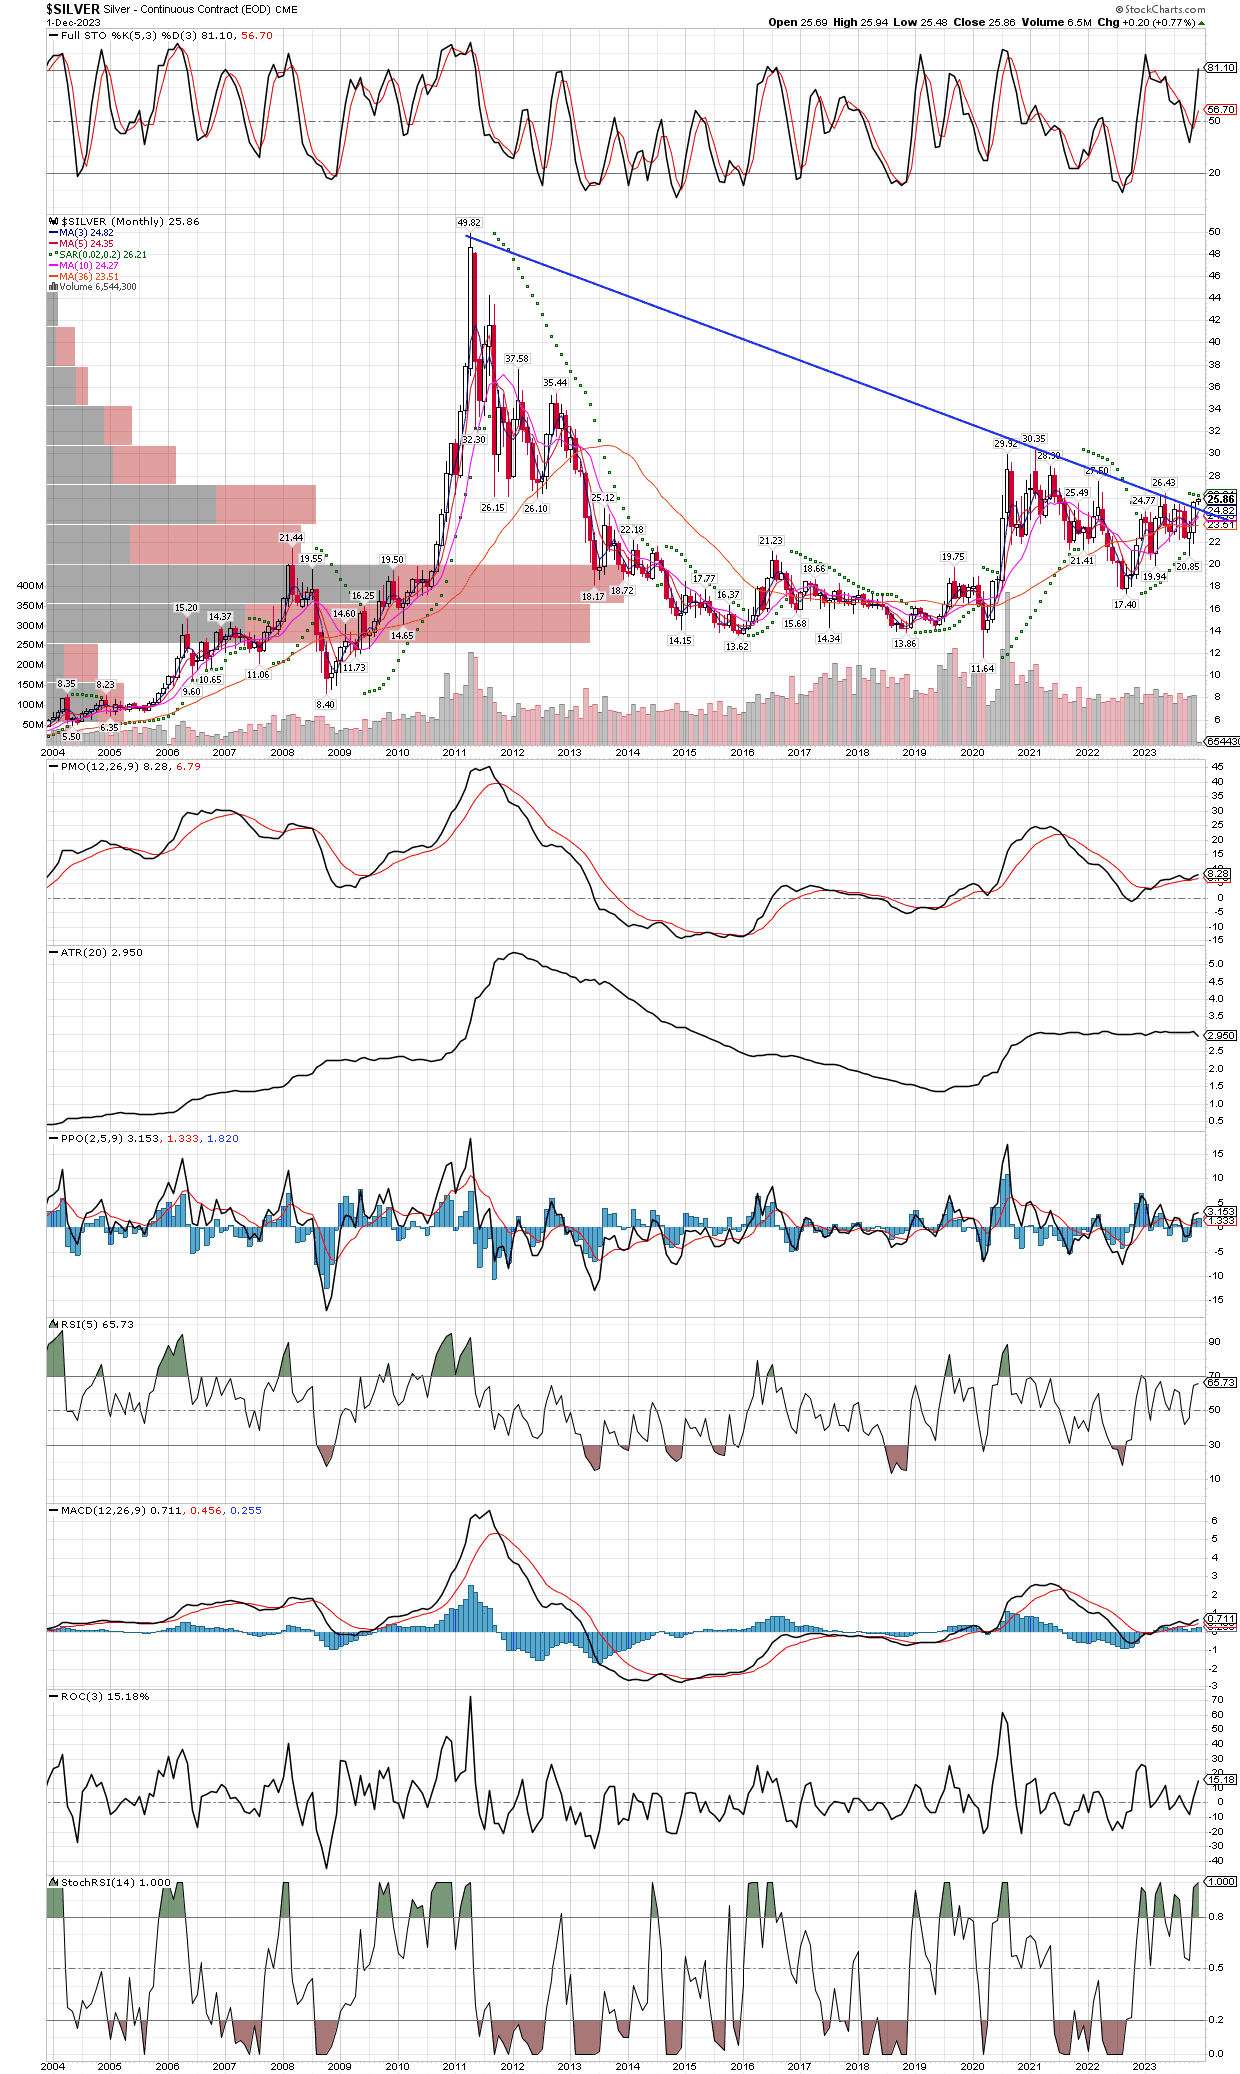
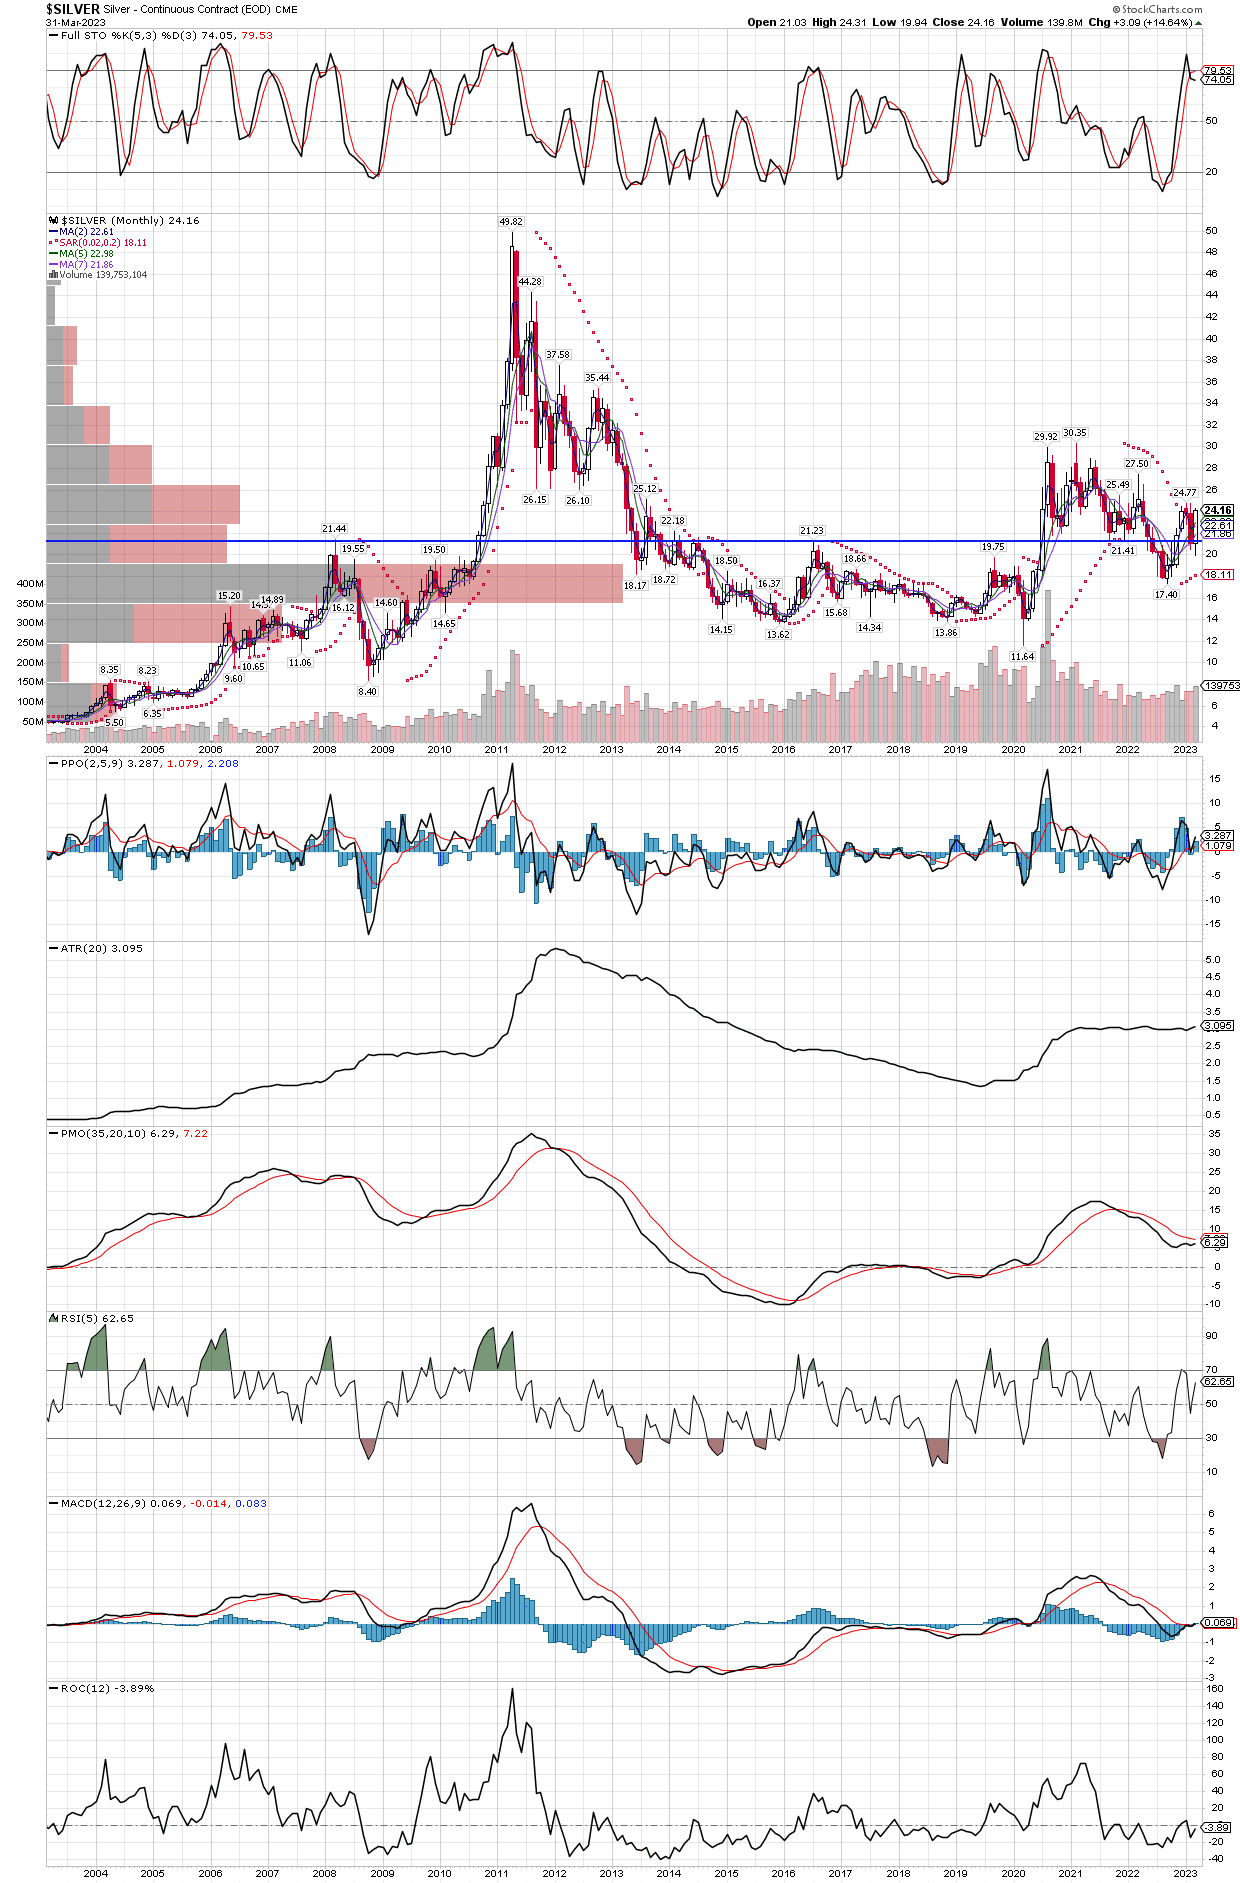
$SILVER is doing some tricks of its own, and just recently started to outperform gold, another sign the secular bull market has kicked in again. As many have pointed out, silver goes up later than gold, but much farther and faster. Considering it is still only half its all time price high seen twice before, in 1980 and 2011 at $50, silver could truly make some eye-popping gains of several hundred percent. I will remind readers that in 2016, silver only rose 50% from the lows, but maybe of it’s miners were up 500% or more, even the SILJ etf rocketed over 380%! This is why were are heavily invested in silver and gold miners (most silver miners get half their revenue or more from gold, so they are diversified between the two), and the best part is that they are the standout group when everything else is getting demolished. I have little doubt that while silver might take a breather and consolidate even for a year or two around $50, it will likely go way past that level ,offering several hundred percent returns just on the physical metal, imagine what the miners will do in that scenario? Best to own some, if not a lot, like us.
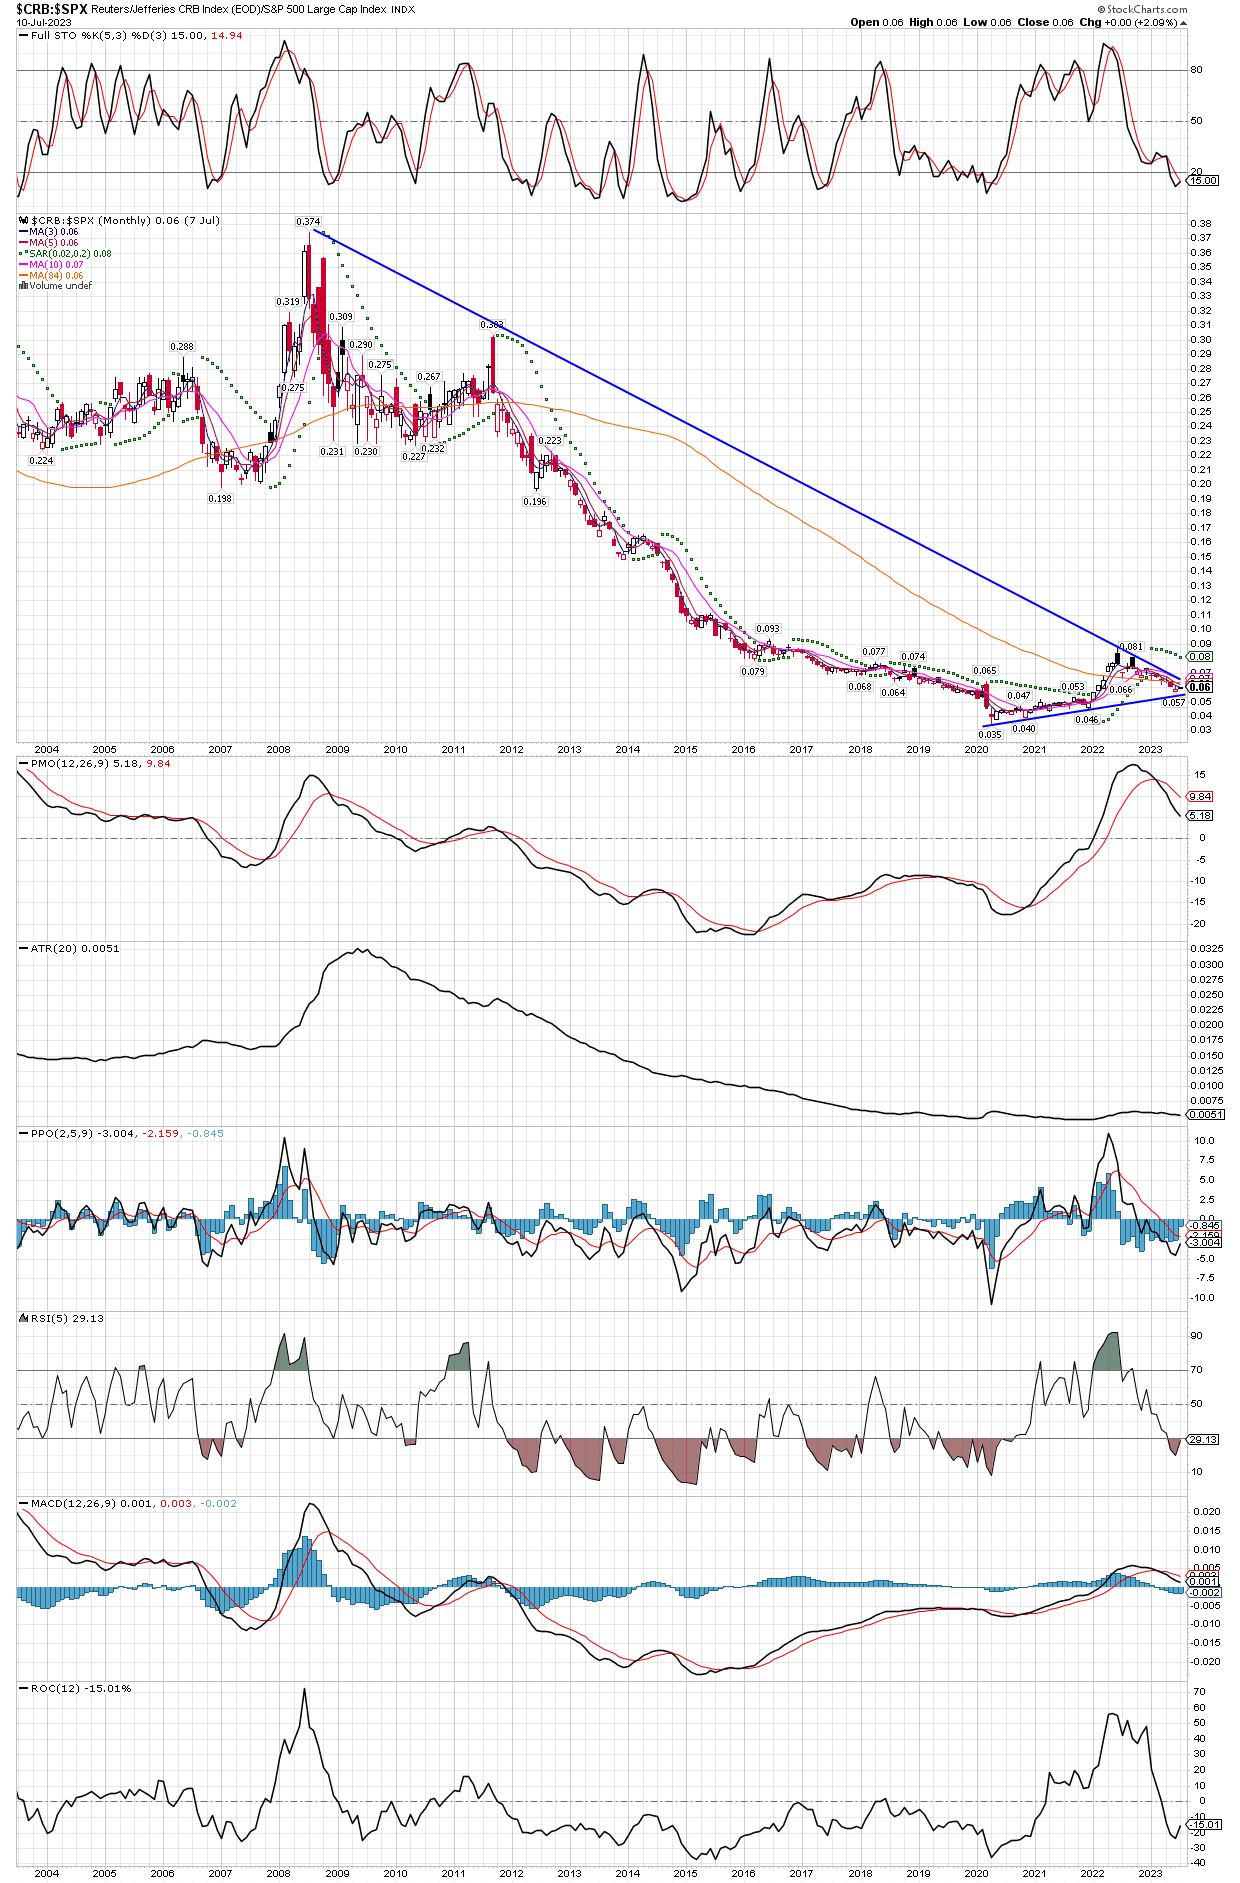
Here is a monthly chart of the $CRB commodity index vs. the $SPX S&P500 index, going back twenty years. Two things to note, first is that the big run higher with inflation from 2021 is hardly a blip on the chart. The second thing that jumps out at me is how much potential upside commodities have, after what appear to be just the first leg of a new commodity bull. Once the ratio gets over the downtrend line, commodities could rocket higher. The ratios stayed in a range from 2003 (as far as this chart can go back) until it broker lower in 2012, at a level OVER 3x higher than where it sits today! Just getting back to that area would be a bull market to behold in commodities and the stocks of companies that produce them. I maintain that we haven’t seen anything yet, and nothing like what we will see over the next several years.
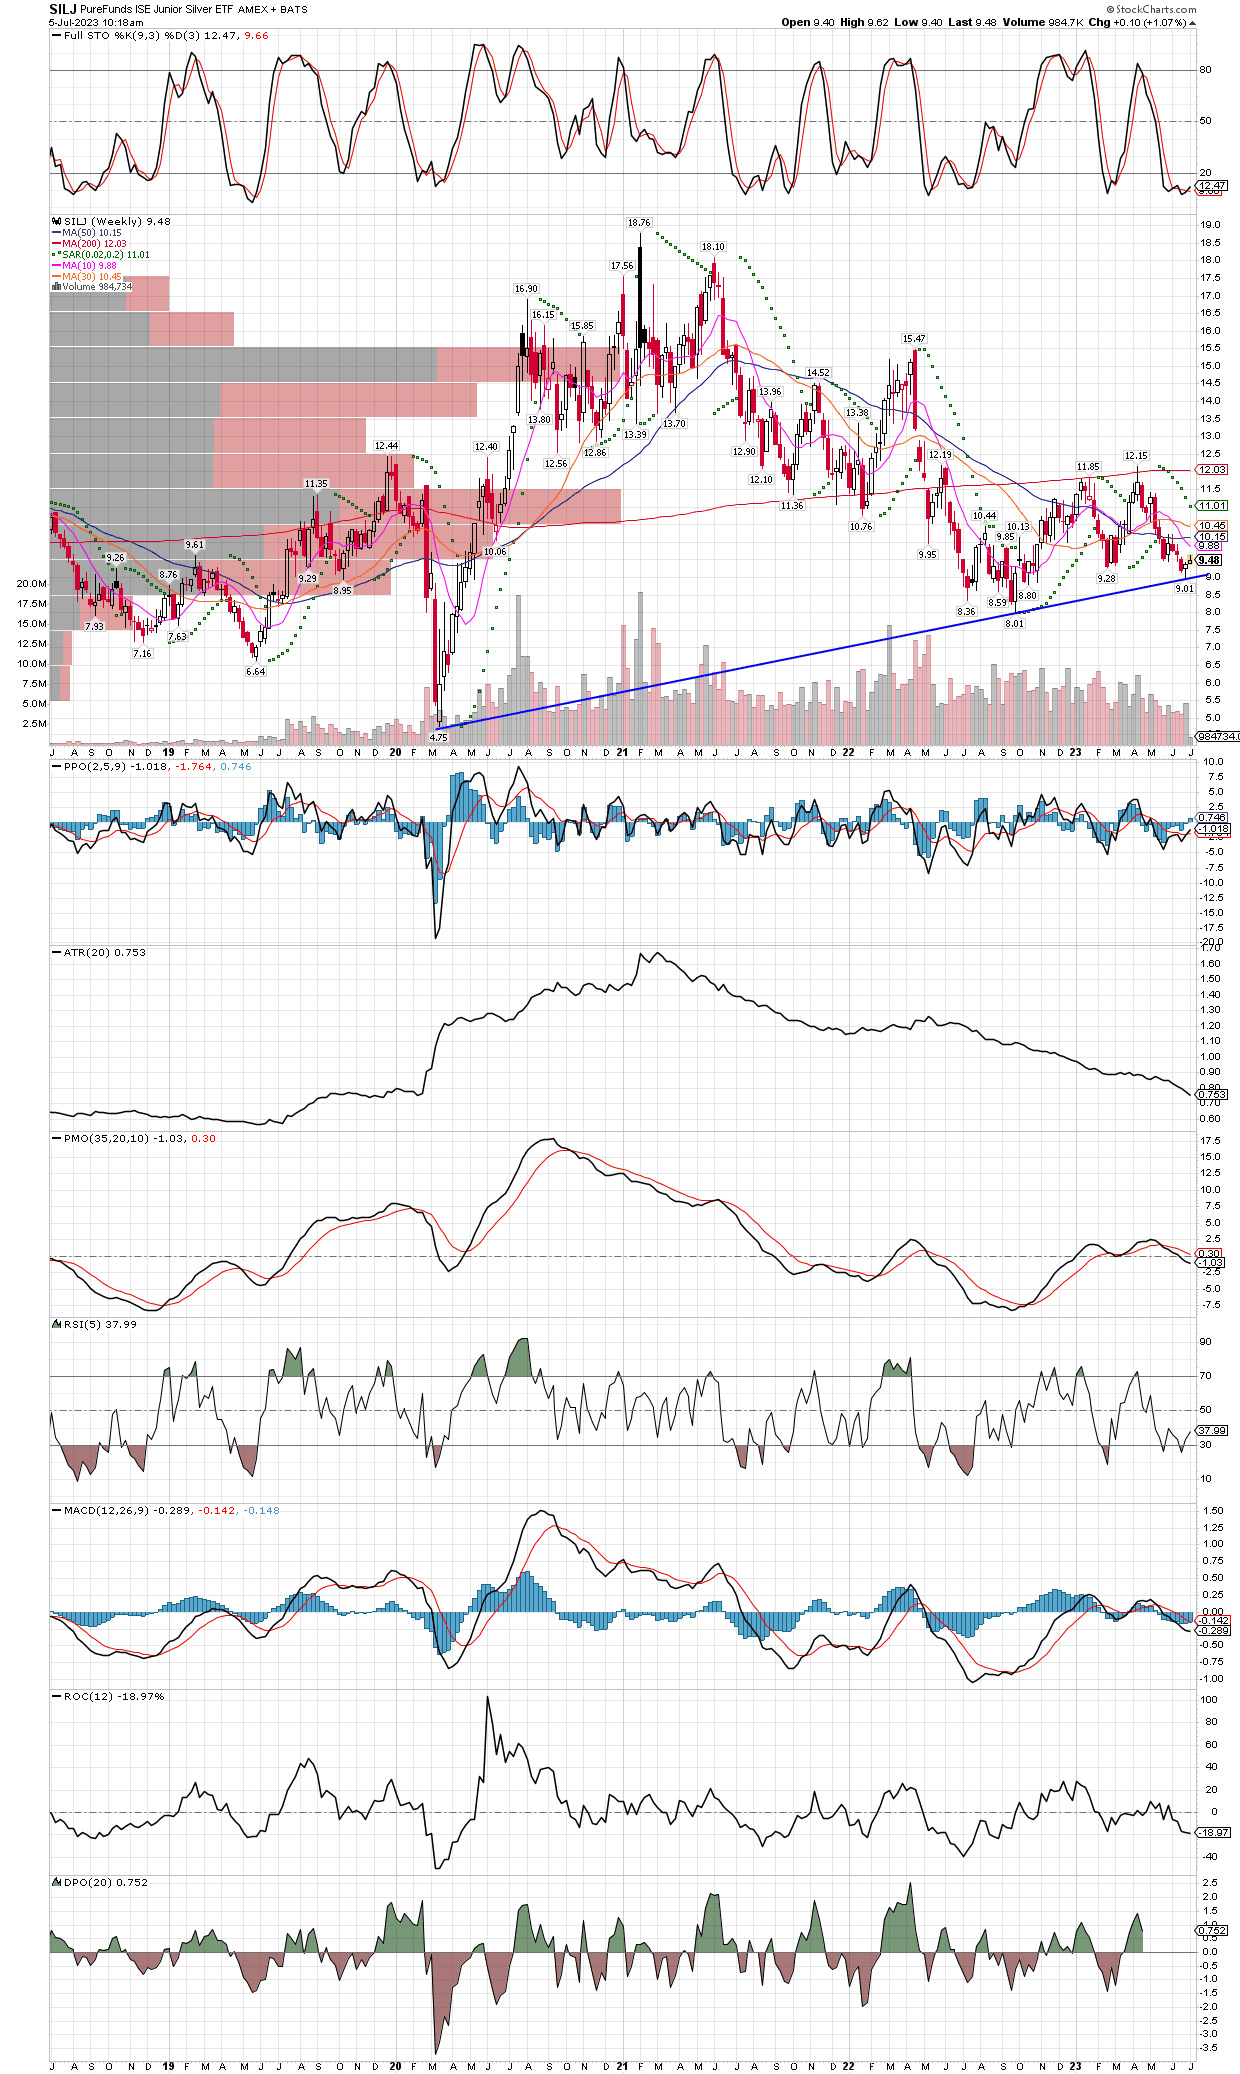
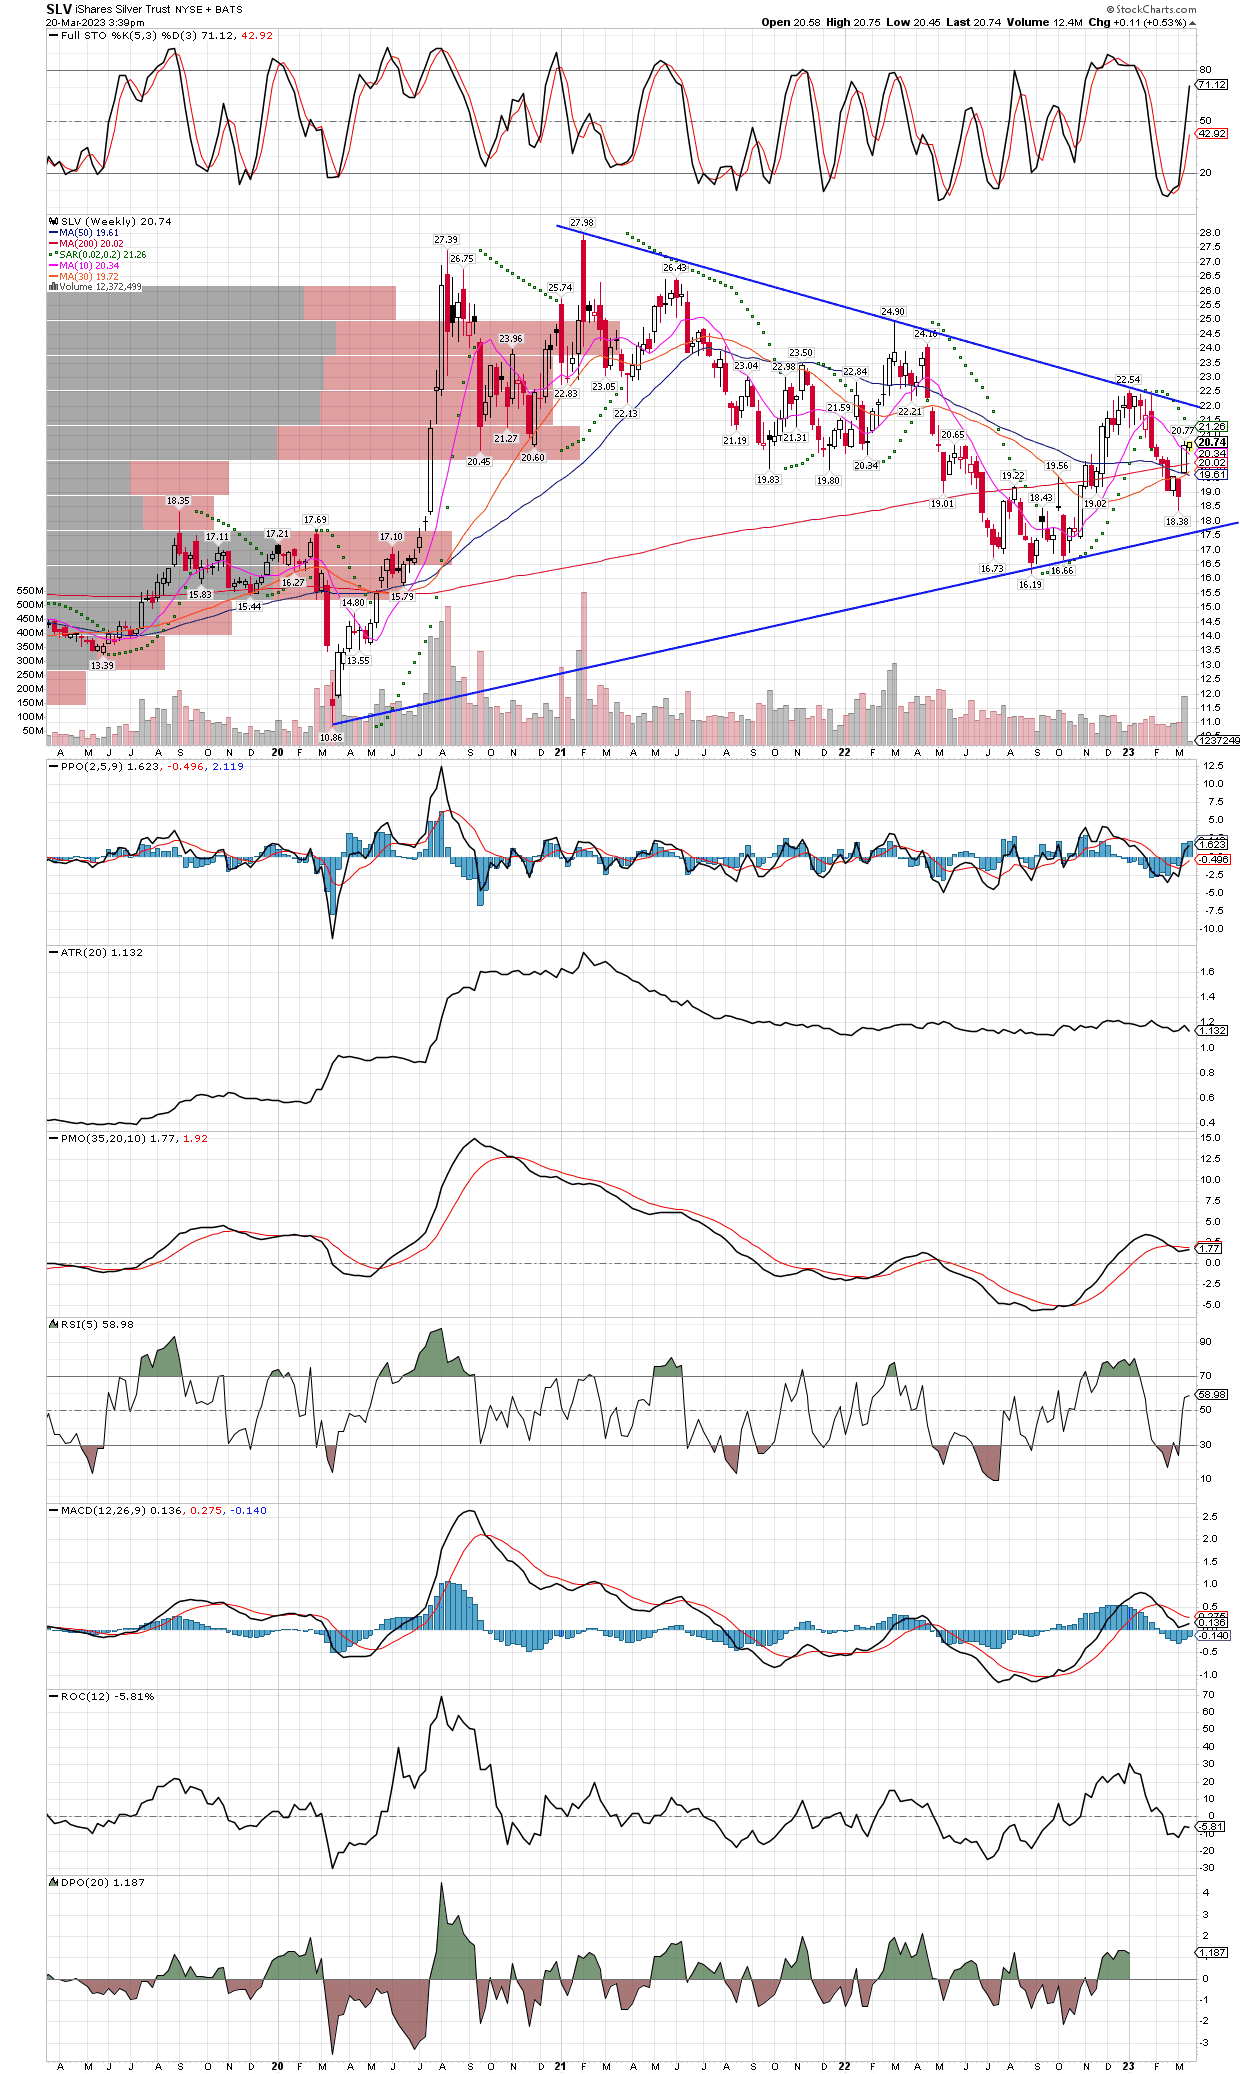
The uptrend line on the weekly chart of SILJ was tested, let’s see how big of a bounce it gets, now that we have passed the seasonally worst time on average for miners in June. The winds should be at our backs until the third week of September, if history is any indication. Also, the miners have confirmed new daily cycles, and have already made swing lows on the weekly charts, now we wait for them to get over their 10 week MA to confirm a new intermediate cycle as well.
Miners are experiencing a decent pullback on the daily charts, now sporting oversold technicals like stochastics and RSI which is usually a good time to add. I am doing some nibbling here on the SILJ and trying to add to some individual miners are well, like EXK.
An 11% correction after a nice run is an area where I like to add to positions.
While I don’t make trading decisions off the COT reports, I found this very interesting.
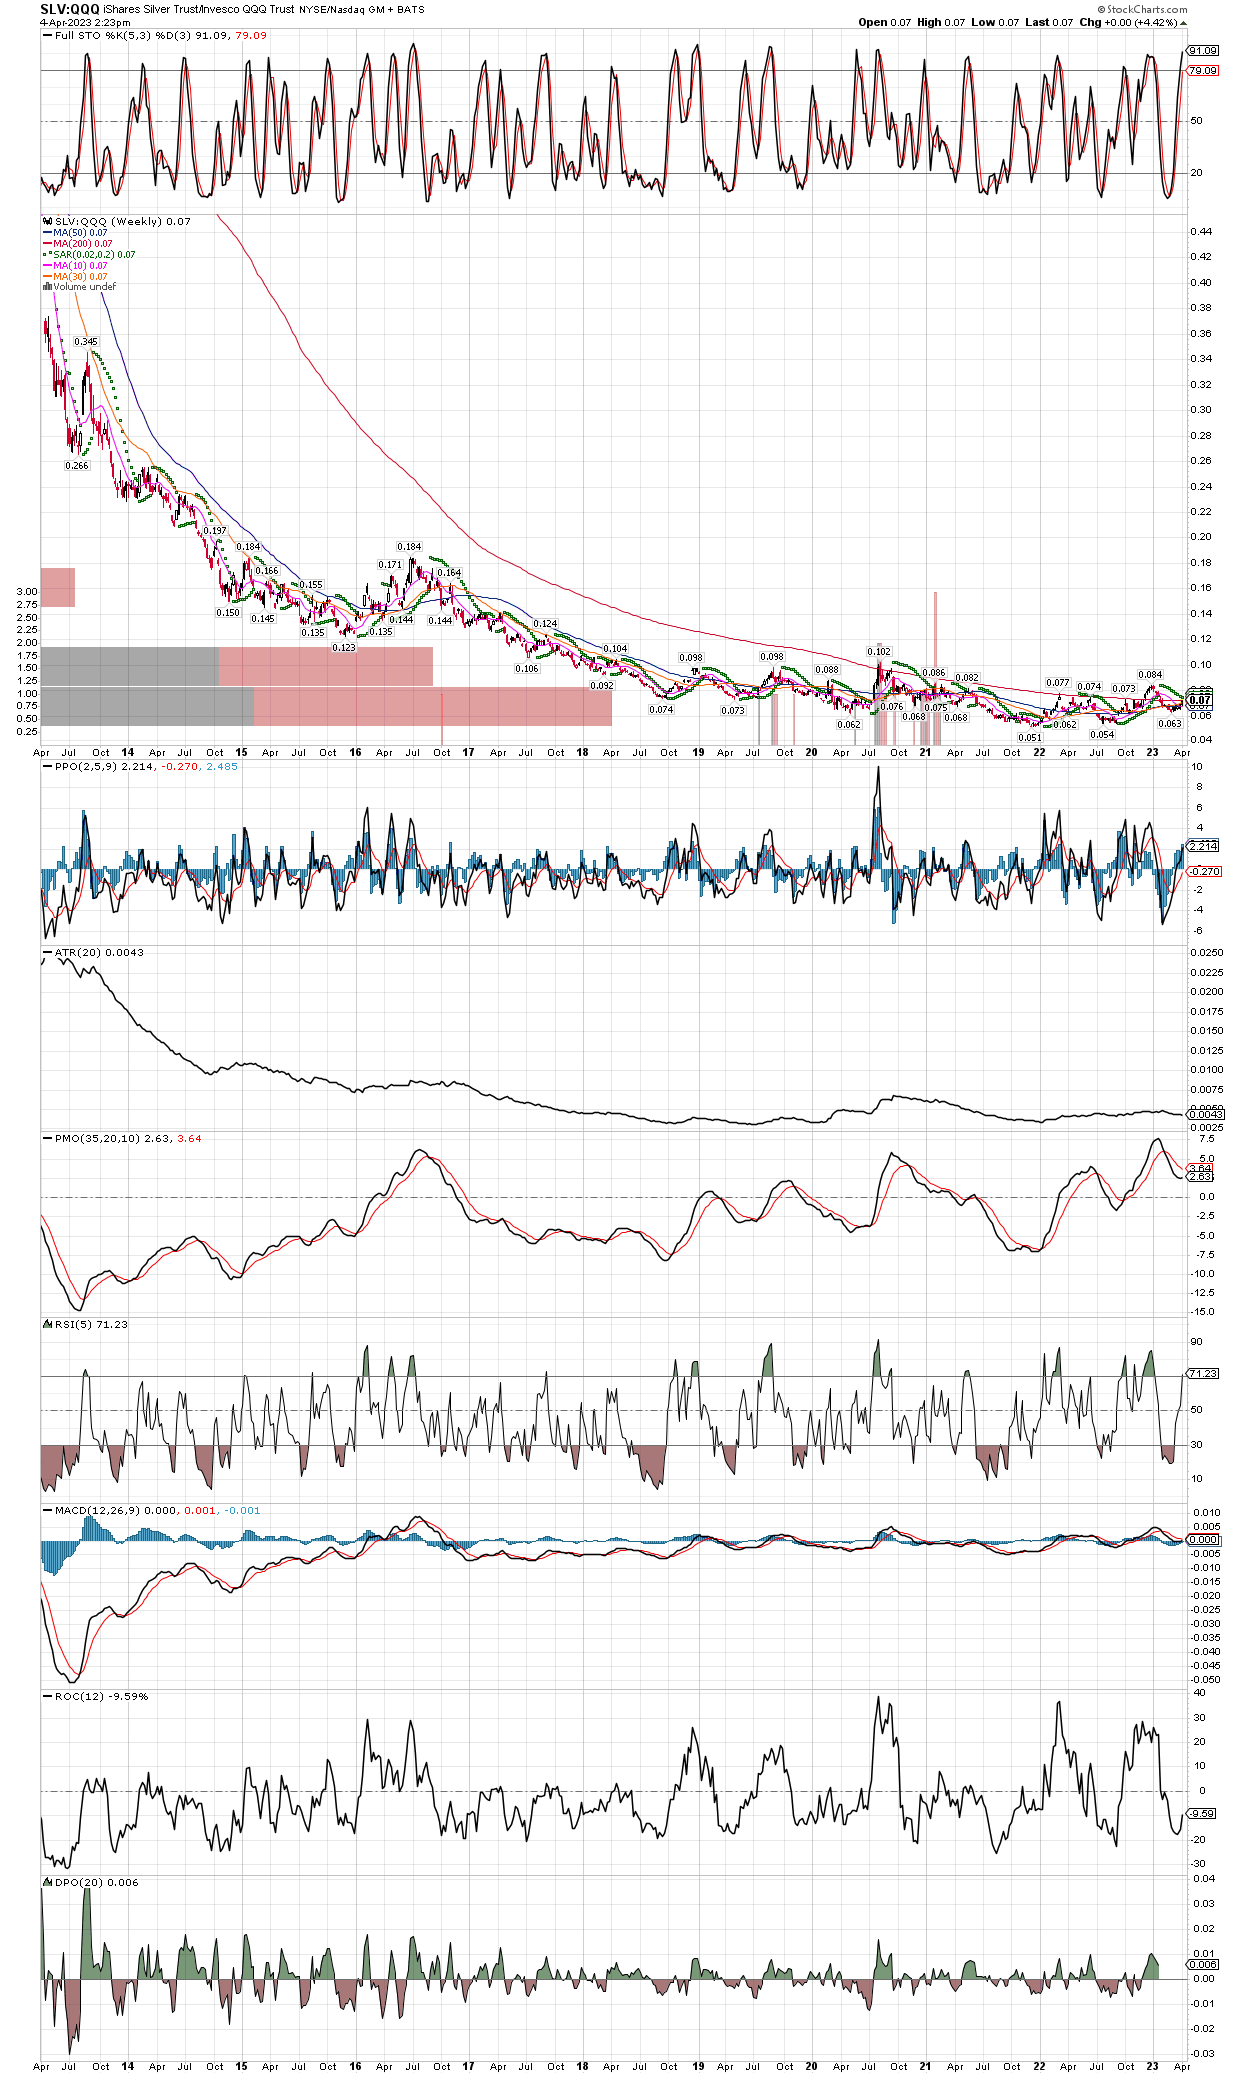
This chart goes back ten years showing SLV divided by the QQQ’s (Nasdaq market). It trends for long periods, could a breakout higher above all the moving averages lead to a big uptrend in silver and the miners? I think so, and we are getting there now, with the 200 week MA also flattening out before starting to trend higher.
Just a quick post looking at the $Silver futures monthly chart, going back twenty years. It shows strong support in the $21-$22 area, and no resistance once it gets over the $27-$28 level. Everything I pay for, both goods and services, have at least more than doubled in the last two years, so there is no reason to not think silver will do the same and take out it’s all time high near $50, and quite likely go much higher from there. With gold at $2000 again already, silver could be the best investment on the planet at the moment.
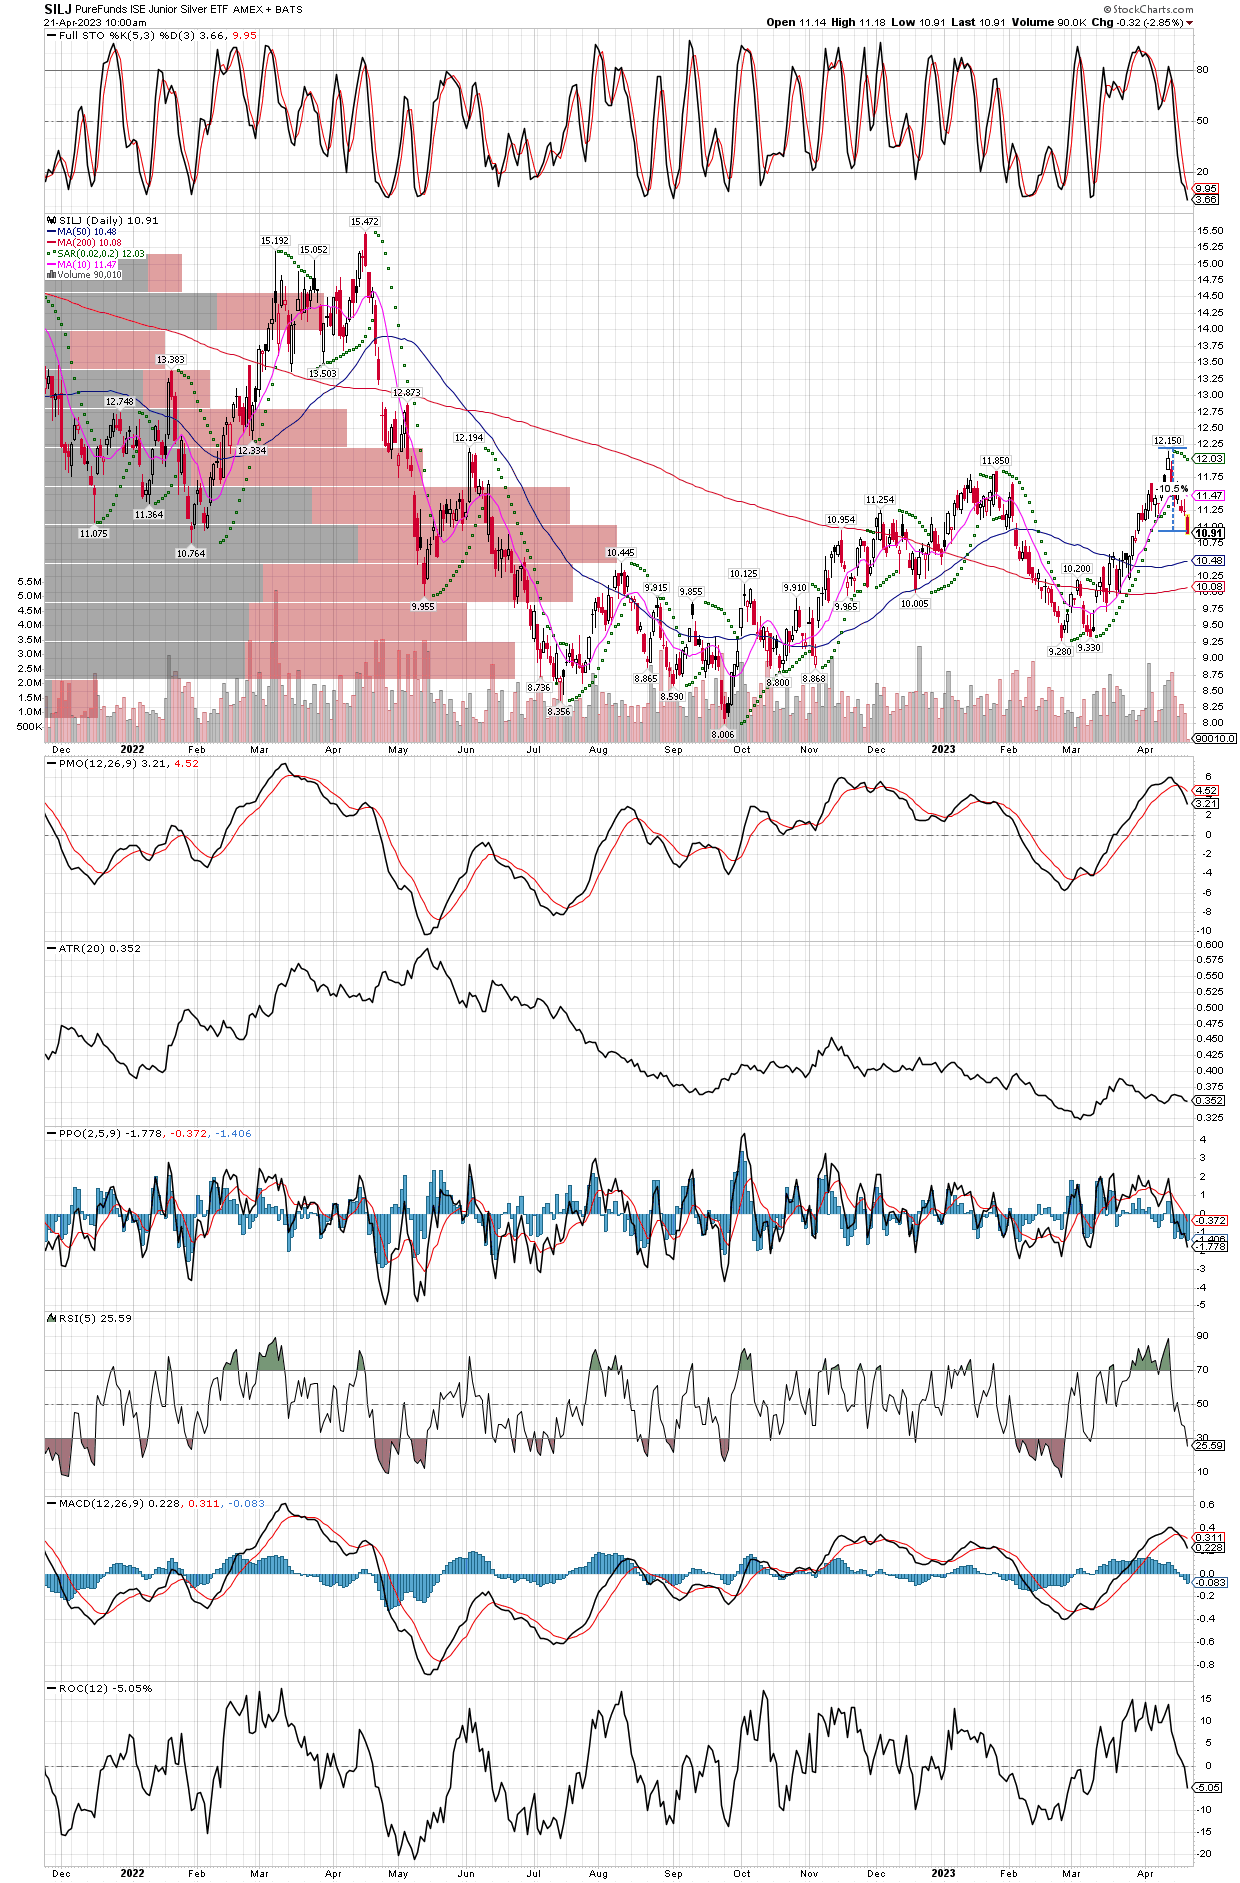
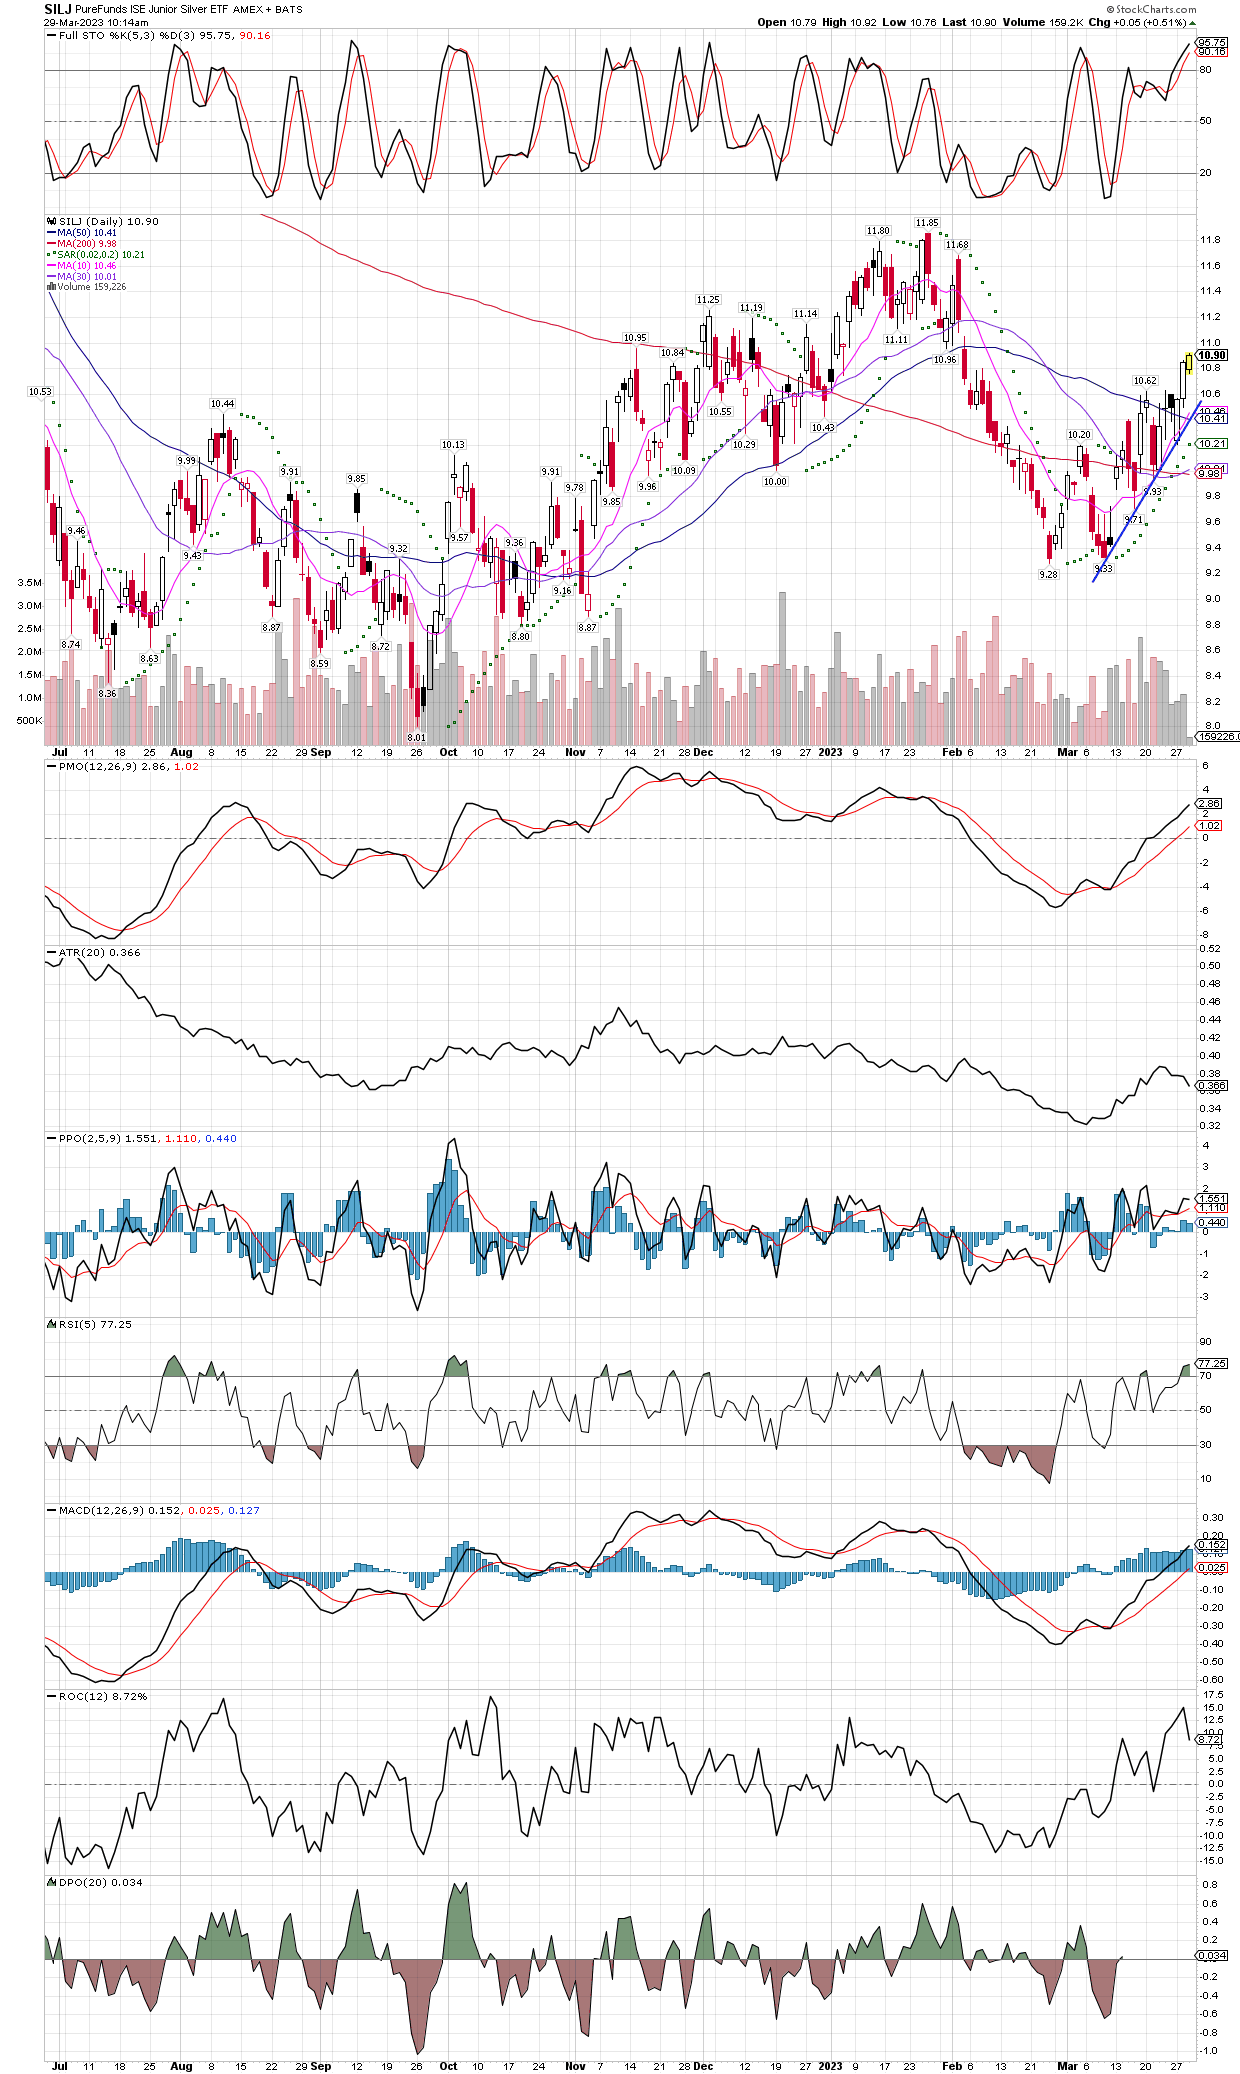
I am going to go out on a limb, and say that SILJ will not go below $10/share again in this bull market. I will discuss the chart in a minute, but so many things have been happening lately with banks going belly up in both the US and Europe, real estate prices now souring, and inflation still a big problem, that the fundamentals supporting precious metals are now better than at any time since the late 70’s. Combine these observations with the technicals on the charts, gold trading near all time highs, etc, and its a recipe for a rip-roaring bull market. I saw this morning that Equinox gold is selling forward some of its gold production, about $200 million worth, in order to fund their newest mine build. Normally selling production forward is something shareholders don’t like, we want the exposure to higher metals prices in the future, but here is where the EQX news gets interesting. They sold gold for approximately $2175/ounce, deliverable between 2024 and 2026, which shows the buyers think gold will be north of that level, and well into new all time highs! Not only did they not have to dilute shareholders to fund the new mine, they are getting prices for their gold that have yet to be seen on the futures markets, suggesting the real price of gold is much higher than what leveraged paper exchanges are showing. Let’s hope this starts a trend in the industry, where producers raise funds at prices much higher than current paper metal prices. Importantly, it is still too early to focus on junior explorers, in my opinion, this option would not be available to them as it has to be a miner already producing the metal, this means the small juniors will still have to dilute shareholders, so I am sticking with mid-cap producers for the time being in the SILJ etf. Here is the Equinox article https://www.equinoxgold.com/news/equinox-gold-announces-up-to-200-million-in-gold-prepay-and-gold-purchase-and-sale-arrangements/
Now lets look at the charts. SILJ’s 200 day MA is flatlining and about to turn higher, as the GDX etf just did today. We are also in a new intermediate cycle, about 3 weeks in so far, so should expect to see generally higher prices for many more weeks. Besides the steep trend line I have drawn also sitting on the 10 day MA, SILJ could find support at the 50 day MA around $10.40, and especially at the 200 and 20 day MA´s down at $10, on any pullback. With the 200 day MA about to trend higher, I feel fine predicting the bull is back in force, and SILJ won’t go below the $10 level again for the rest of this bull market.
Next, let’s take a peek at a ratio chart of $GOLD vs. the $SPX. I must mention I got the idea from Patrick Karim, a fine technical analyst over at NorthStar BadCharts, but I sometimes find his charts hard to read the fine print, so I made my own ratio chart with the broken down trend line. Not only has gold broken out vs. the S&P on a long term, monthly chart, as Patrick suggests, the ratio is breaking above the very important .49 level he determines by using the 84 month MA. In short, he suggests a monthly close over .49 is a historic breakout, one of only four that have happened in the last 100 years or so. It would usher in a new, big bull market in metals and miners, and the end of the month and the quarter is just 3 days away. Gold itself might even achieve an new all time closing high on the monthly and quarterly charts, so very exciting things are occurring, all with the backdrop of failing banks and the Fed expanding its balance sheet again!
There has been so many headlines lately that its hard to keep up! It doesn’t matter, when one has a plan. Gold, silver, and miners have been the only things rising lately, so will likely entice investors to get involved at some point soon, and considering we are very early in the new intermediate cycles for metals and miners as we are probing breakout areas, this could be the start of something big.
Besides adding to several precious metals positions over the last few weeks, I just started to nibble on uranium miners via the URA, URNM, and URNJ etfs. I will cover the new stake in uraniums in the next posts, but I have only started and my major focus in on precious metals and their miners at the moment. The fundamentals are in place with big banks going belly up daily, and while the central banks so far are still getting involved with printing money to soften the blow, there are other things vaporizing overnight like crypto bank Silvergate Capital, institutions that are unlikely to get bailed out. The Fed is now trapped, plain and simple, if they choose to continue to fight inflation by raising rates, that will continue to bury the banks and the economy. And if the Fed changes course and starts making more fiat currency out of nothing, with inflation rates already very high, this tact will cause inflation to get much worse. All one has to do is ignore the distractions and panic, and be out of banks and most paper financial assets, instead be invested in real assets, tangibles like gold and silver, as well as their miners since they also own the physical commodity already safely buried in the ground. Other commodities are fine as well, like uranium mentioned above, but in the immediate future as the economy tanks, things like energy and base metals will see demand destruction and pressure on prices quite possibly. I want to own copper miners at some point, but unlike uranium miners, coppers have not yet pulled back enough and consolidated long enough yet to turn me into a buyer. Still I would own just about anything commodities over financial assets at this stage of the game, though I would not trade futures contracts any longer with the credibility of the exchanges in serious doubt. I will stick with the miners of commodities, and physical metals when it comes to gold and silver.
Over $22 on SLV gets really interesting, and Gold is already approaching all-time highs!
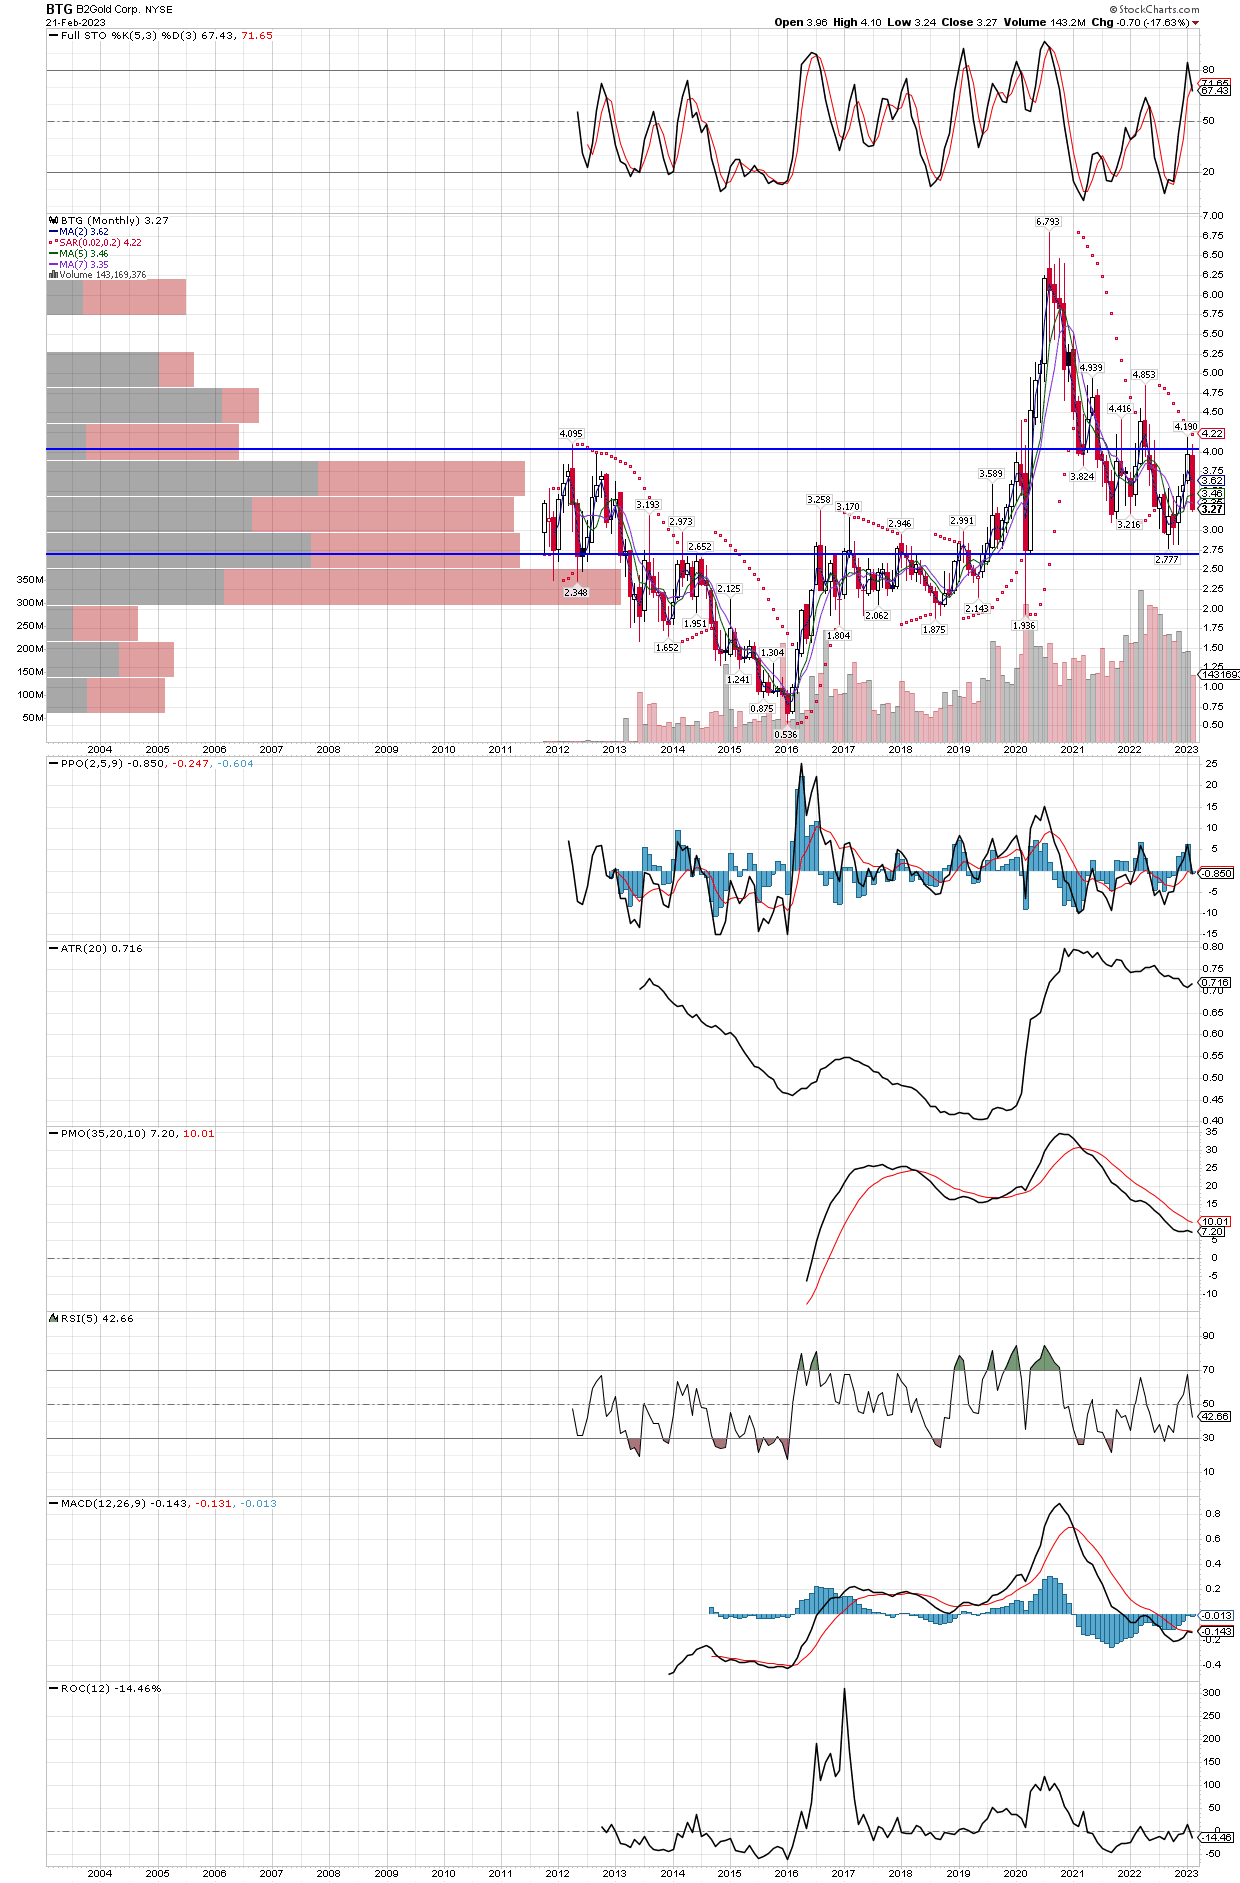
B2 Gold (BTG) pays a 4.82% dividend as of last night’s close, and is in an area I don’t mind buying. A return just to the recent high two months ago would be a 30% gain, and a return to the all time high made in 2020 would be well over a double from here. I like that it made all time highs in the last couple years, it will likely do it again as their free cash flow continues to grow. Below is the monthly chart, and while I prefer the stochastics to be oversold, they still have not reached overbought so the shares still have more upside potential. And the weekly chart does show the stochastics to be oversold already, so I have no problem buying into a roughly 25% decline that has occurred over the last four weeks
Getting paid 4.82% while we wait for BTG to make new all-time highs again