Gold vs. S&P 500

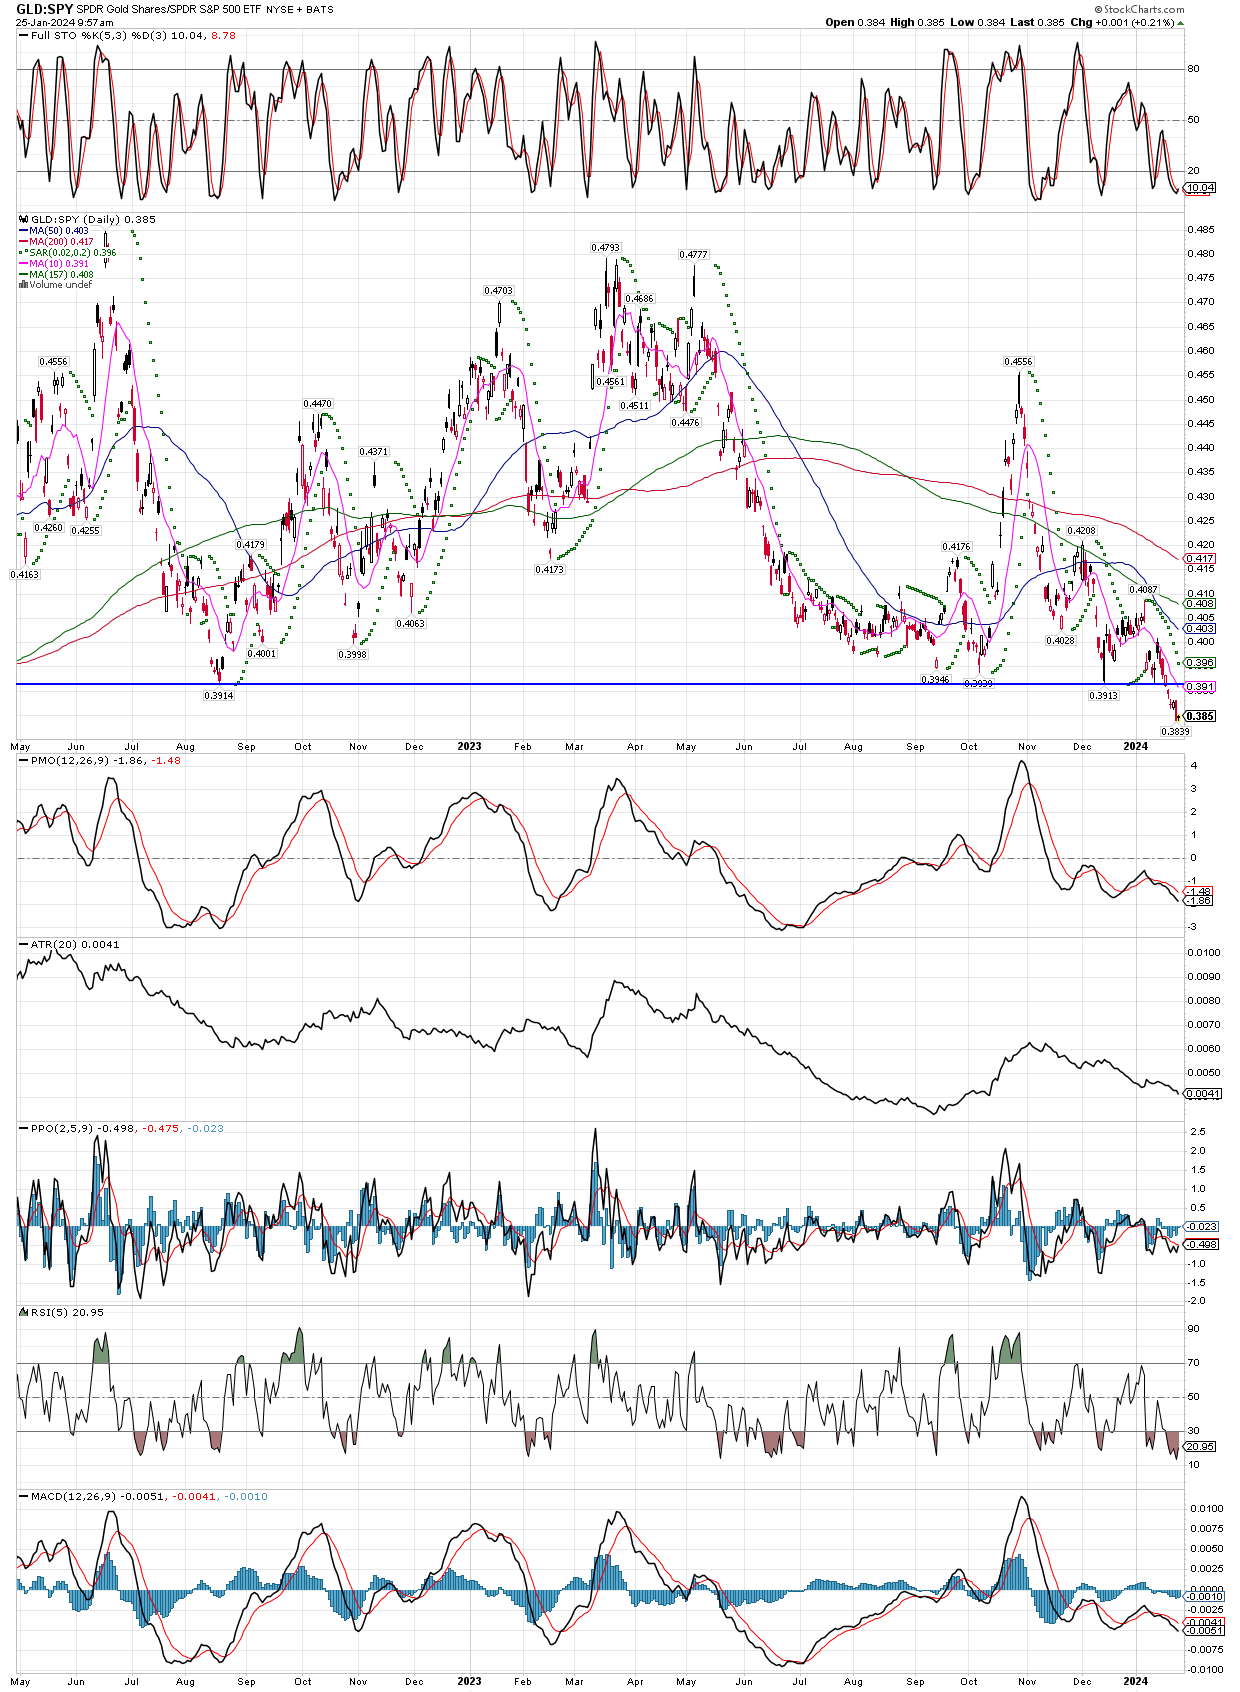
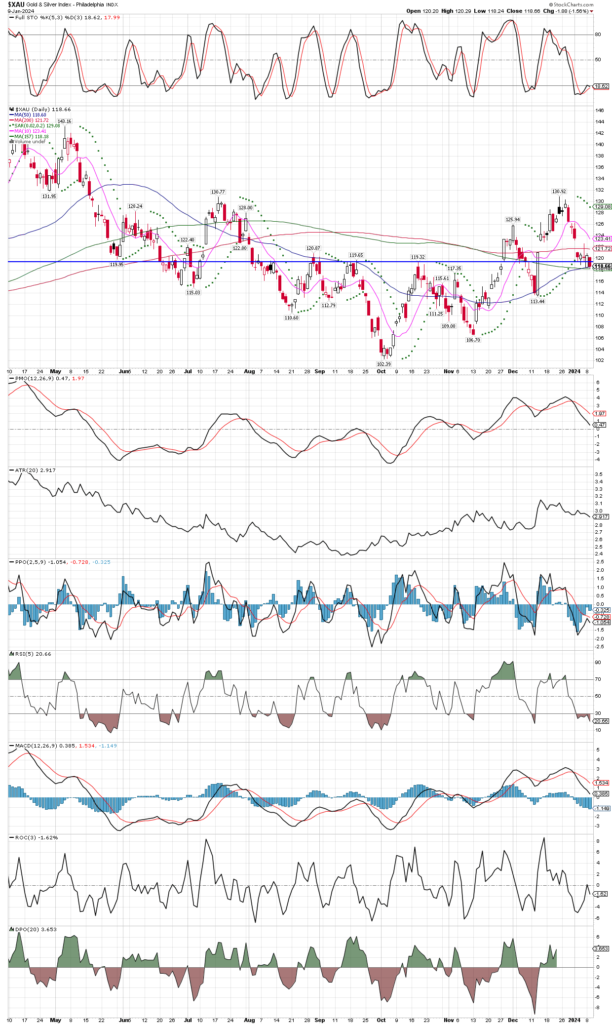
The gold vs S&P 500 ratio is the lowest it has been in the last couple years, and while the SPX is mostly just seven stocks, even those seven will correct at some point. Doing the rounds today, I couldn’t help but notice how many metals bulls are on the sideline, expecting the miners and metals to get hammered along with the stock market first, before they can start a serious bull run. While this might turn out to be the case, it doesn’t always work that way, and with so many people singing the same tune, it makes it more likely that it won’t play out that way.

With that in mind, I pulled up a chart of gold vs. the S&P, and either everybody else is correct, or we could be witnessing a classic false breakdown in the ratio. I cannot say which it will turn out to be, but I am more comfortable with my mining stocks after seeing this chart, and the stochastics are very oversold as well. So a bounce in this ratio should see gold start to outperform stocks in the near term, then we just have to wait and see by how much and for how long. If its a strong enough reversal in the ratio, the patiently waiting bulls will have to make a tough decision whether to chase higher prices, or wait for a pullback to buy. With so many people in agreement that miners going lower before they mount a big run, its possible they get left behind, its exactly how bull markets shake off as many riders as many riders as it can. Many see the bull coming, but can’t ride it.

Copper Mining Stocks

The copper stocks are rebounding after four weeks of selling lower, and if they close the week right here or higher, will give a buy signal. Let’s see what Friday afternoon brings, being a strong close would get me to buy them Monday morning. There is also junior copper mining etf COPJ, that I will look at, but this signal applies to COPX.

Additionally, the base metals etf DBB has had a solid enough week to put it back up over all its weekly moving averages, so maybe they ending their year long consolidations after a large pullback?

Marijuana Stocks and Natural Gas

The MJ etf continues to hold strong, will look to start a position at some point into a small selloff, preferably with oversold stochastics or other technicals on a short term chart. Natural gas has not yet triggered a buy signal for us, but looks as though its trying to establish a bottom. It could be worth a shot right here, but to get larger positions, I would want to see an uptrend get started. The violent spike the selloff might be the start of a trend change, more so with that lower low that looks to have reversed itself, if it can stay in this area or higher by Friday’s close.

Some Junior Explorers To Buy?

As mentioned before, I will not get too heavily invested in the more speculative junior explorers at this time, since I think many will have to dilute shareholders to raise cash, especially if they see a decent rally first. Still, I am interested in opening positions in the better ones, with a few more shown below. While keeping my exposure to “juniors” via the SILJ etf, which is actually more accurately described as a mid-cap producer etf. I see this area as the safer play as they already have cash flow to fund their exploration, but are still small enough they could be bought out, or grow quickly as they continue to increase their metals reserves. For those with more risk tolerance, starting small positions in the following companies might be a good idea. Go back and check the charts over the last five years (weekly), just to get an idea of just how much devastation has occurred in this group!

I will most likely wait until Friday afternoon to start buying these, as their weekly stochastics are continuing their move lower, but not yet oversold. However, if they mover lower sharply during intraday trading before Friday, I will have “stink bids” in below current prices where I hope to get buy orders filled.

There are several others too, I will try to post a couple charts each day of what I perceive to be some of the better junior exploration companies out there, but remember that these will be smaller positions with far less total risk to portfolios to start. If they work out, I might step in to buy much larger positions, but will keep the overall risk fixed at my pre-determined level, so they will have to prove themselves before I pyramid up in a position.

Marijuana Stocks Might Have Bottomed

Putting aside personal beliefs on whether one should or should not consume marijuana, no doubt there are many people who do. Besides, a buy signal is a buy signal, so if the MJ etf holds up into the end of this week, I might buy some for myself and the accounts I manage. Or, I could wait until about 10:30 am Monday morning to make sure it respects its moving averages just below the current price. Below are the daily and weekly charts, the weekly shows a long period of sideways movement after a massive collapse the last few years, and if we can get in near the moving averages we have much lower risk. I will use the 30 WEEK MA as my tell.

Natural Gas (UNG) Rocketing Higher

We have been patiently waiting for natural gas to come back to life after a near 80% decline from its highs the last year or two. Yesterday the UNG etf traded 4x its usual daily volume, only stopping when running into serious resistance near the 50 and 200 day MA’s. We will be keeping an eye on natgas, as the long, drawn out sideways action after a huge decline might be coming to an end. Let’s see how it holds up, but if it can get above those critical MA’s and then use them as support over the next weeks and months, we will certainly get long. To be determined is which vehicle to use, the futures, the UNG etf, or possibly and natural gas stock etf like FCG, though the latter didn’t react to the big up day in gas, so maybe that is a tell that we will have plenty of time to do our buying. For now, keep your eyes on this chart.

XAU Index Daily Chart

Since I typically focus on long term charts, here is a chart of the XAU daily going back nine months. I quickly drew the horizontal trend line since it jumped out at me, that this might be a good area to buy/add and get on board the bull market.

Buying Novo Resources and Eloro Resources

I’m buying into Novo and Eloro, symbols NSRPF and ELRRF, keeping the total risk on each quite small, since my focus remains honed in on the mid-cap producers and developers with exploration upside. NSRPF is working up over its 30 WEEK MA, while ELLRF has pulled back 50% of its recent sharp rally.

Picking Up Some JAGGF (Jaguar Mining)

Starting a position in Jaguar Mining (JAGGF), as its pulled back to near it’s 30 WEEK MA, as well as a 50% retracement of the rally from the four year lows. it’s a miner in Brazil, and Eric Sprott is a big shareholder (over 44%), they have no debt and cash in the bank, producing gold since 2006. This entry allows for a very tight stop, so not much risk from today’s price. Note that this is a DAILY chart, so the closest thing to the 30 WEEK MA is the green moving average.

Marijuana ETF has a Buy Signal

If the MJ etf closes above it’s 30 WEEK MA today, Friday, Jan 5, 2024, we will take a position. While this is just a technical chart setup, it offers an entry with fixed, and very limited total risk (TR) of just .5% of the accounts I manage. The stop-out level would be any WEEKLY close below the 30 WEEK MA at $3.18 and rising a little each week. Having such a close stop-out level allows us to have a large position size, and since we hold the position until a weekly close below MJ’s 30 WEEK MA, we could be in this trade for awhile as long as its working, the essence of the phrase “letting your winners run.” We won’t know if we are buying until just before the close today (Friday), in which case we might buy at the close, or even on Monday morning before 11 am or so.

SIGN UP FOR UPDATES

NO SPAM, EVER!