February 5, 2024
February 2, 2024
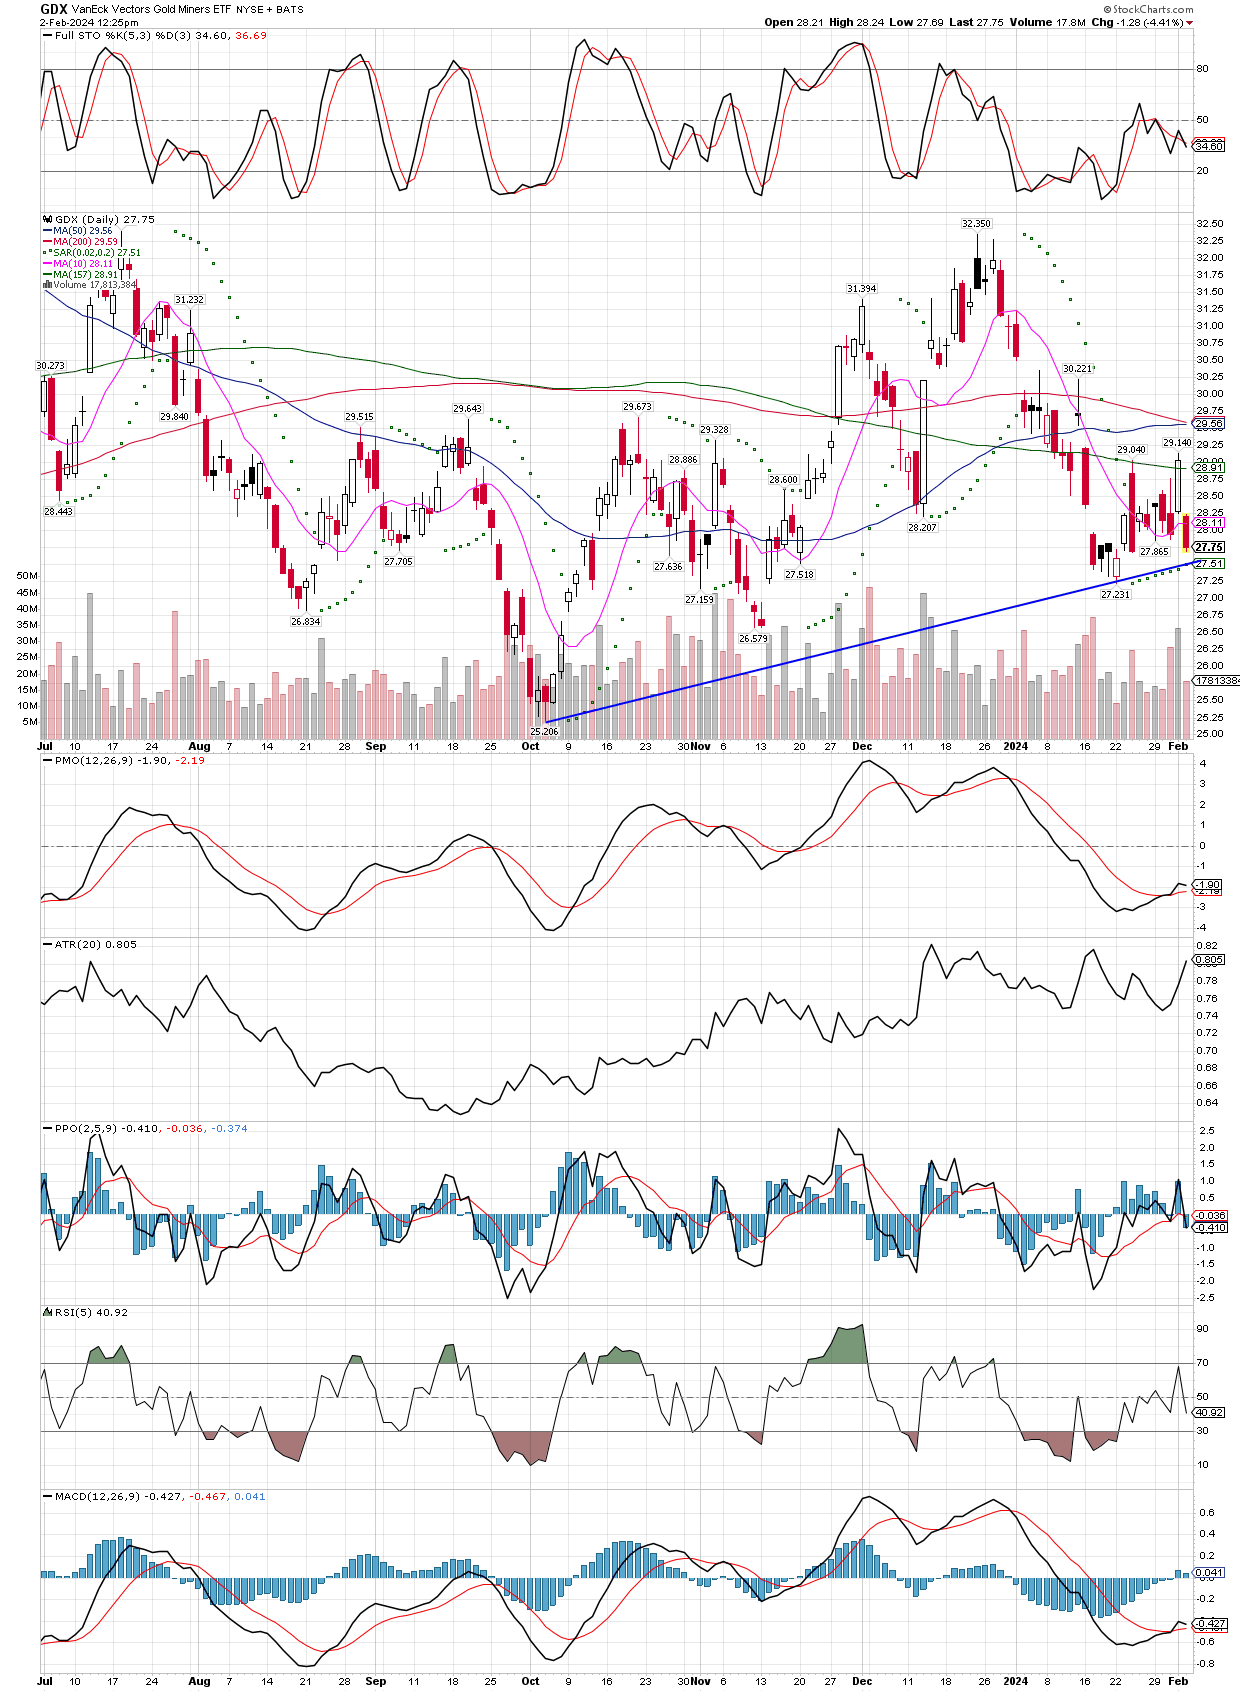
Just a quick daily chart of the GDX, they say a trend line isn’t valid unless it has at least three points of contact. I took the liberty to draw one, wondering if the third contact it is nearing now, will be where it halts it’s recent decline? In the meantime, I took advantage of the pullback today to nibble here and there on several of the holdings in our portfolios, keeping my overall TR fixed as a percentage of my portfolio. Essentially this give me less room on the downside before I have to stop out, because I have the same amount of dollars at risk over larger position sizes, but it also gives me more shares to ride higher if I am correct and they change course soon.
February 1, 2024
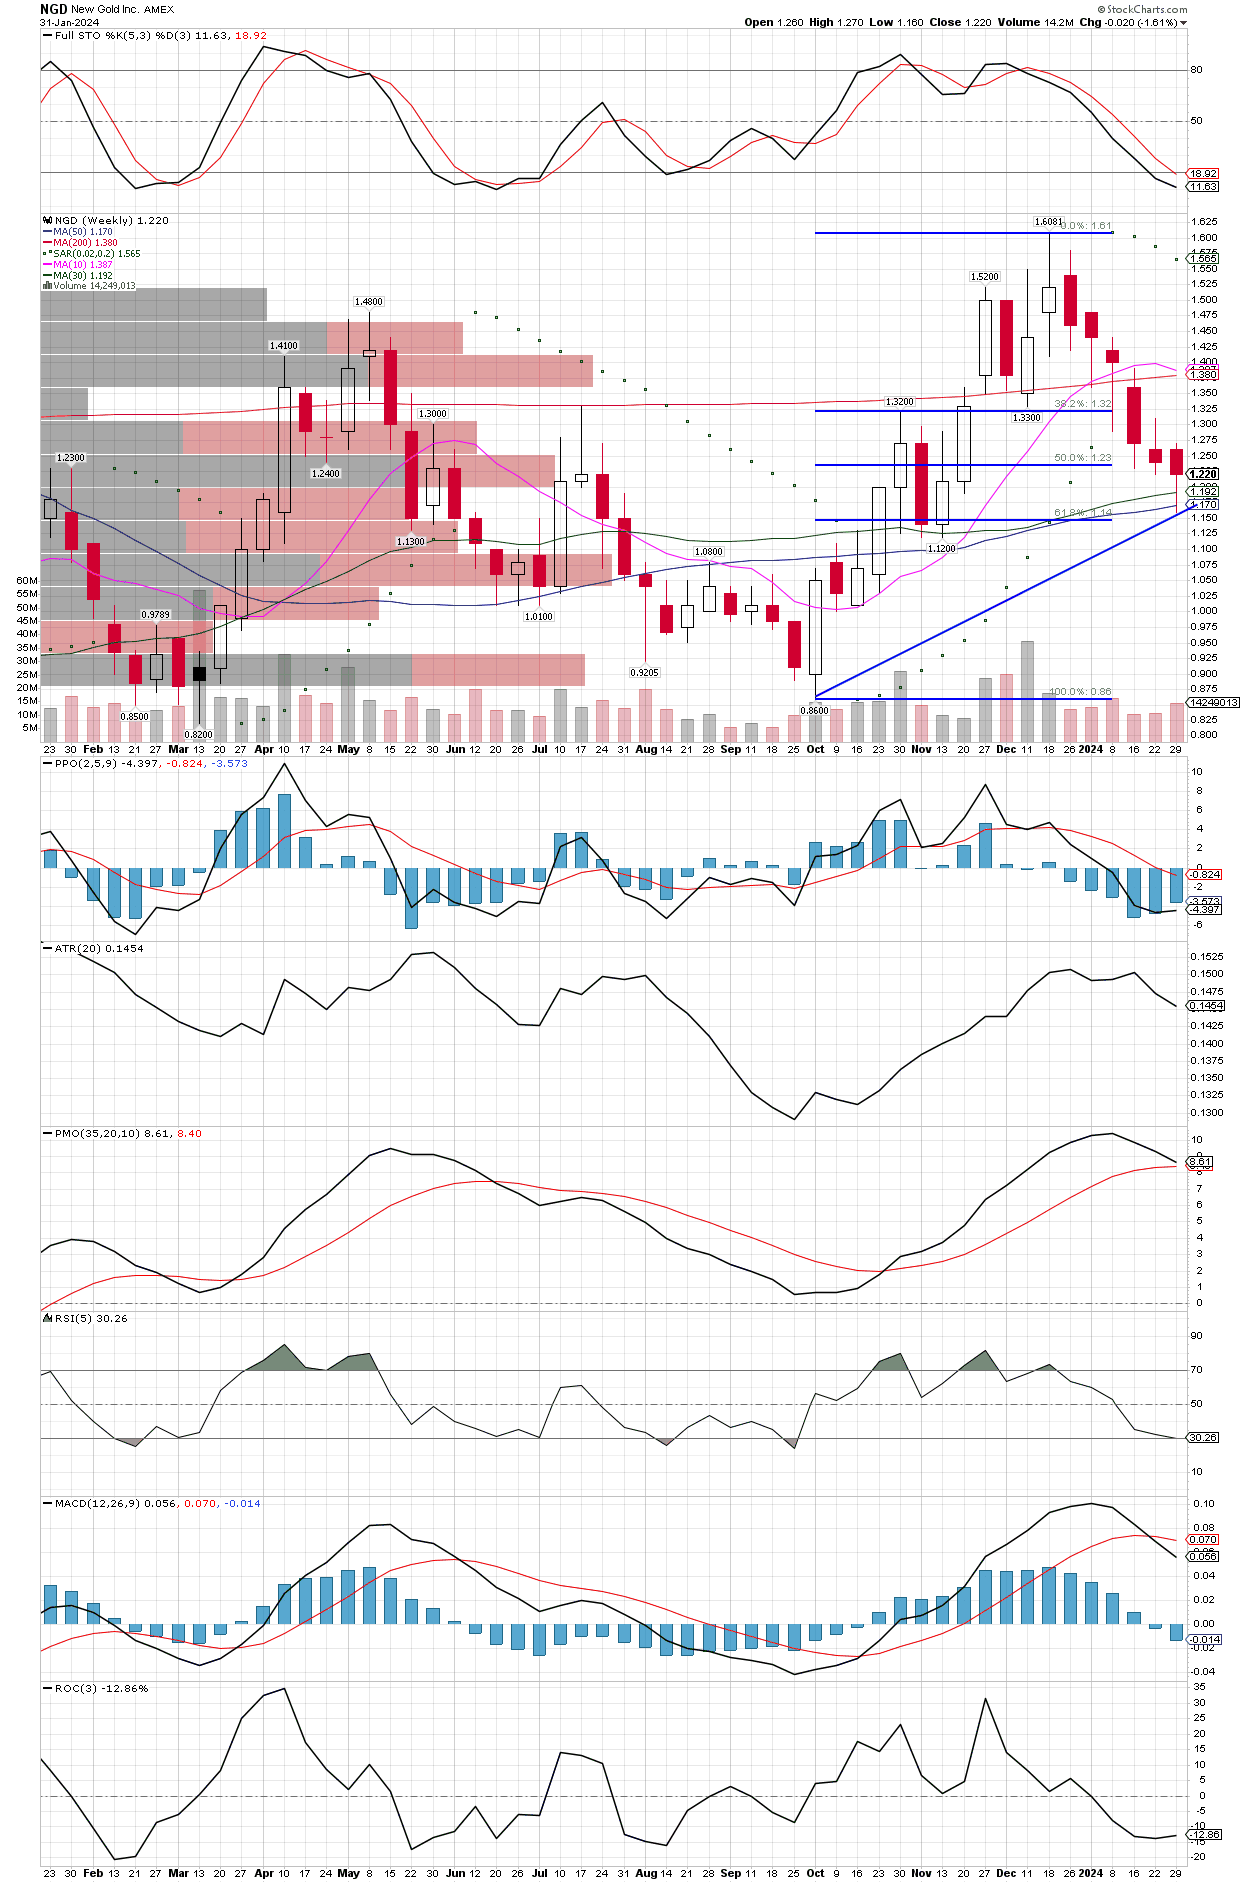
New Gold was bought yesterday before the close of trading, below are both daily and weekly charts. In the current price zone seems like a good area for the stock to find support, both the trend and the stochastics suggest. I also like how the moving averages are shaping up on both charts. Essentially, we are buying a strong stock after a good-sized correction, realizing that metals prices (fundamentals) will still be the most important factor driving the stock price. I consider this a mid-cap producer with exploration potential that could increase reserves.
January 31, 2024
Yesterday I shared the portfolio changes, but when I want to clarify how I invested the SILJ proceeds. The equal-weighting I mentioned was within similar companies, the mid-caps vs. junior explorers, but I invested 75% of the funds into the mid-cap producers, only 25% in the junior explorers, and in each group the fund were equal weighted in each miner. So the bigger miners split 75% among them, the juniors only 25%, and I chose to equal-weight the positions in each, meaning the mid-caps’ positions are 3X more each than the amount invested in each junior explorer. I figured the 75/25 split was appropriate to compensate for the higher risk in the juniors.
January 30, 2024
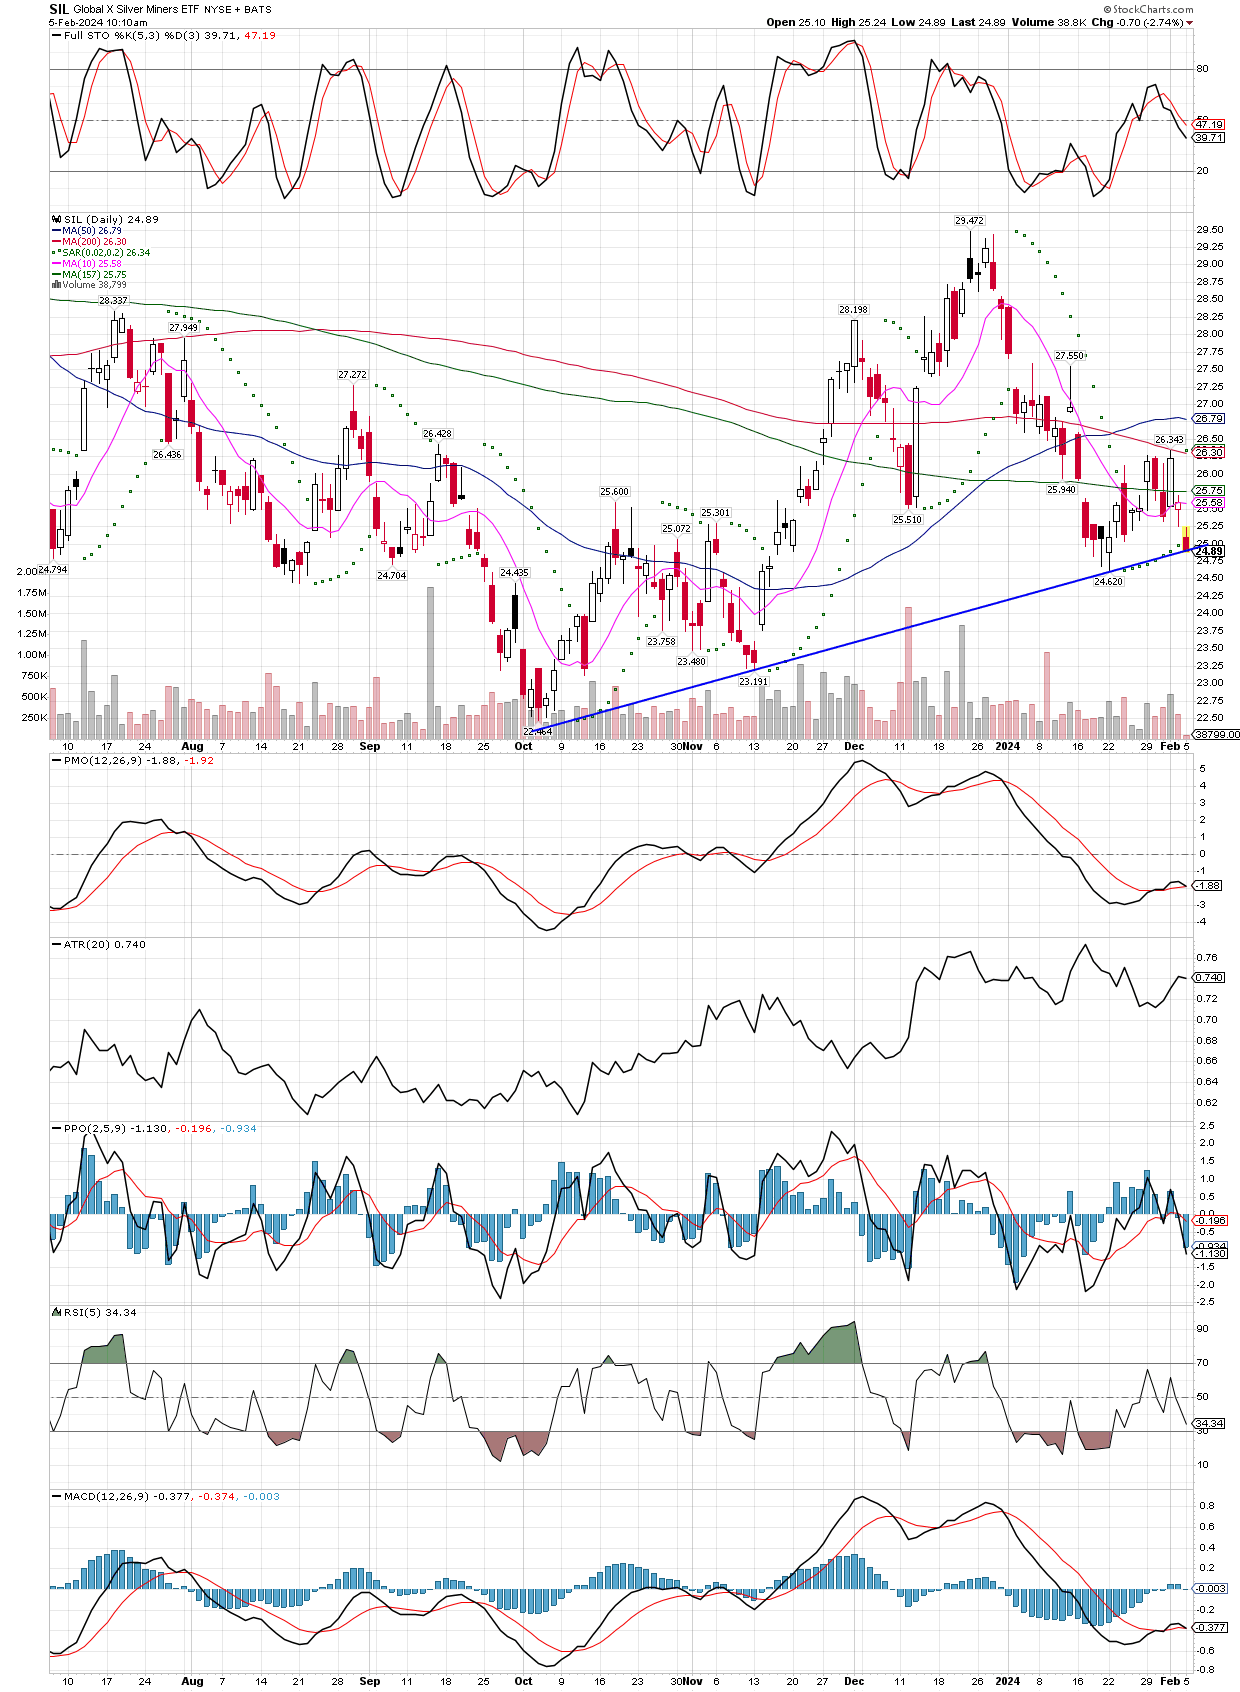
Today I decided to sell out of SILJ after the fund was changed over to Amplify funds from the ETFMG managers it had before. I didn’t like their new portfolio as much, so I put the proceeds from the SILJ into a basket of 16 individual miners I prefer and some PSLV, the physical silver etf managed by Sprott, Inc. Many of the miners I bought have been mentioned here in articles over the last year, but some are new.
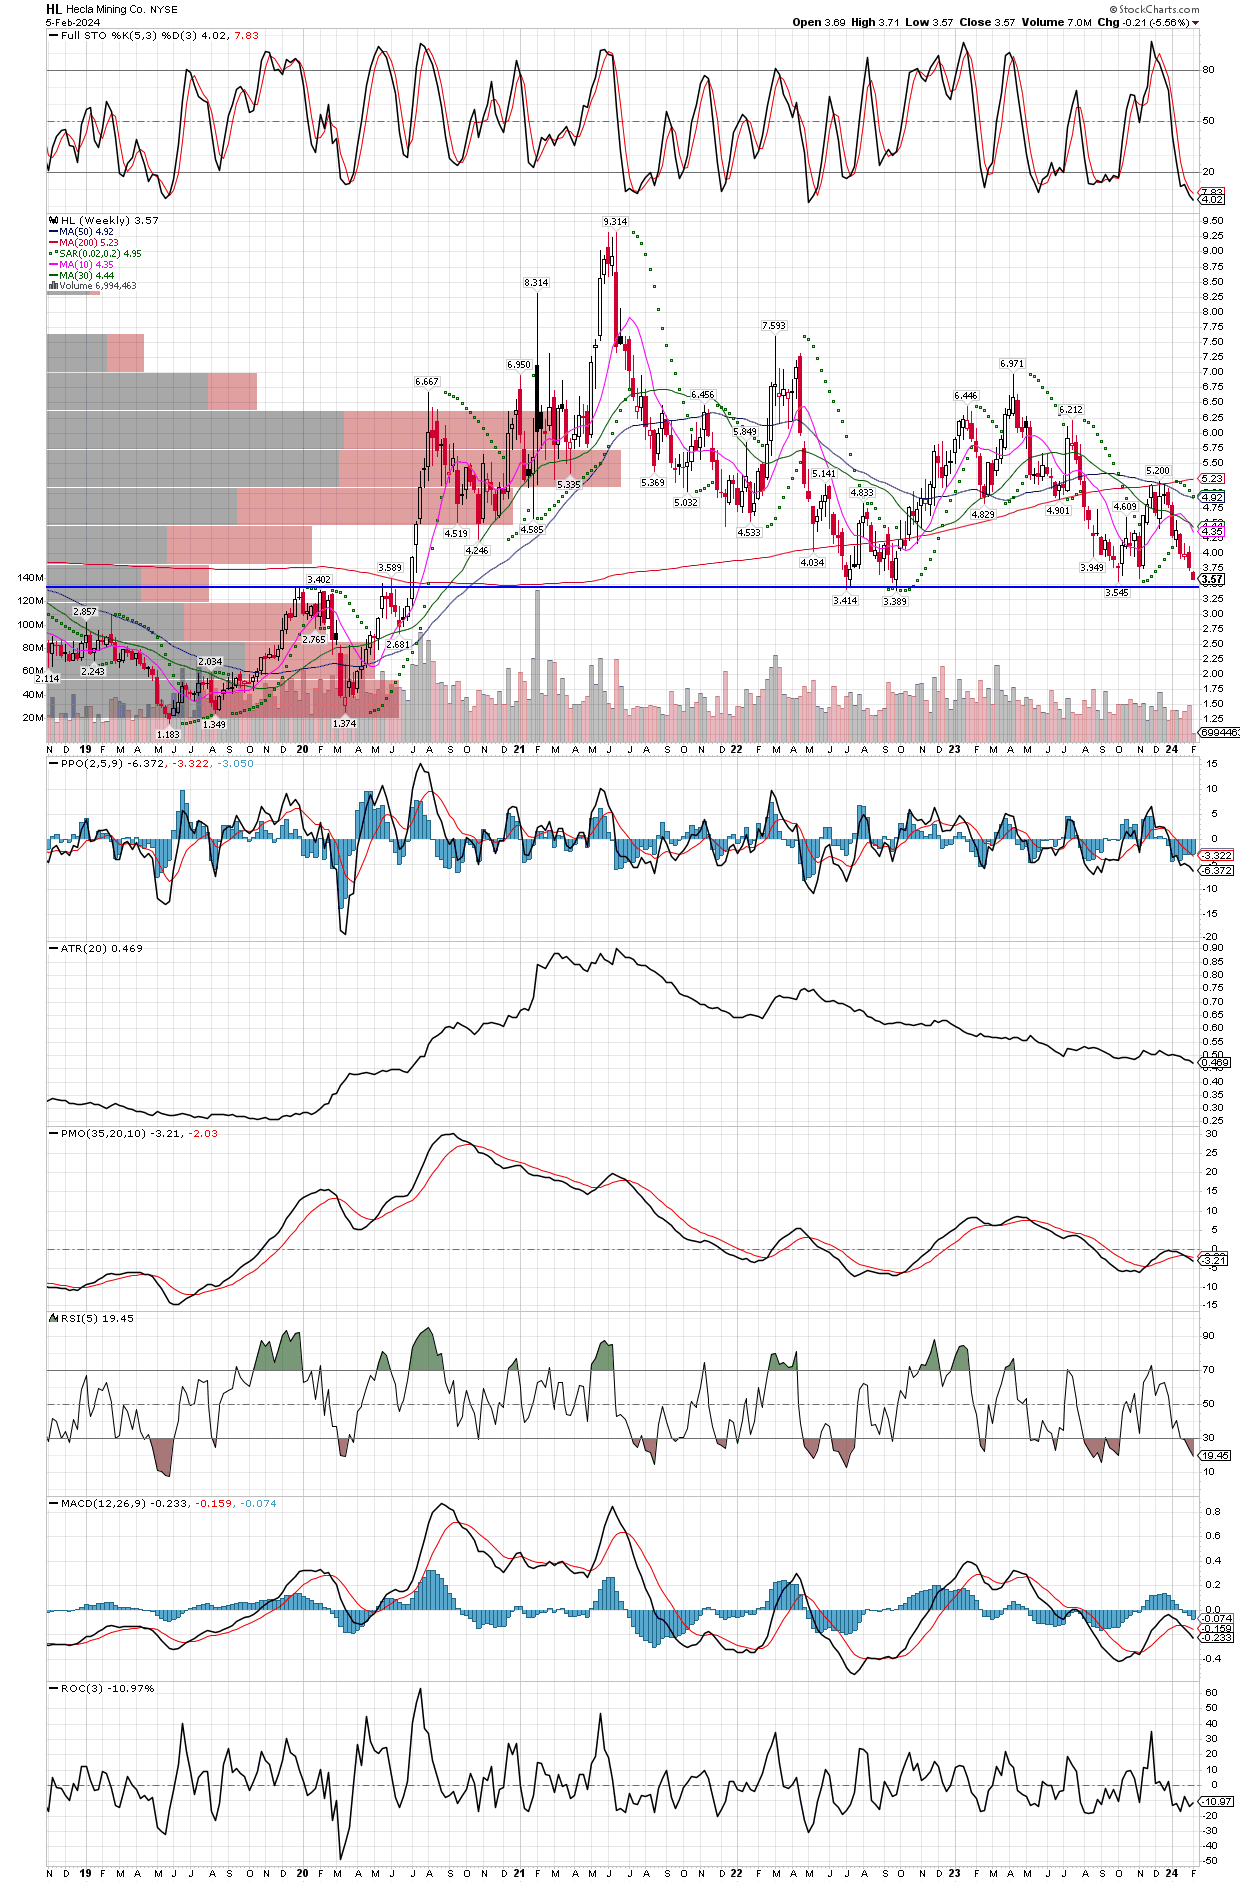
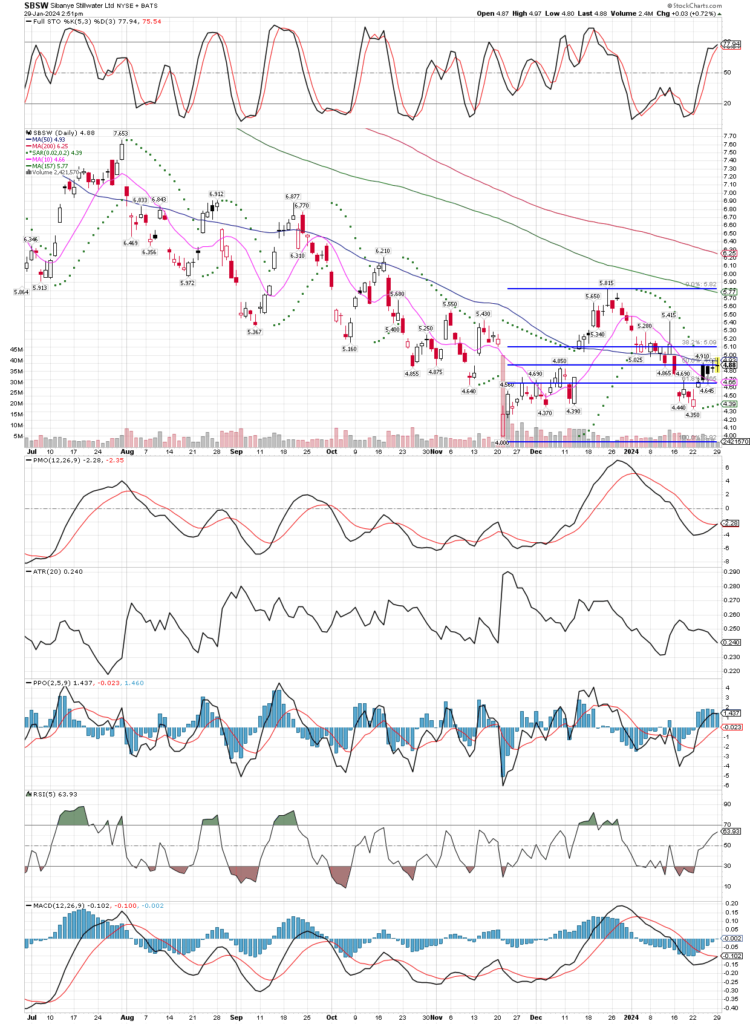
I equal-weighted the following names, HL, CDE, EQX, FSM, PAAS, SBSW, SVM, DSVSF, SILV, AYA.TO, ORLA, GLGDF, EXK, JAGGF, GATO, and DV.TO plus the PSLV. I will add to these positions into declines, and might buy some new names if the opportunity presents. I have some other junior explorers/producers I did not add to today, like NSRPF, MGMLF, and IRVRF, but I want to stay focused on the mid-cap producers at this point.
January 29, 2024
January 26, 2024
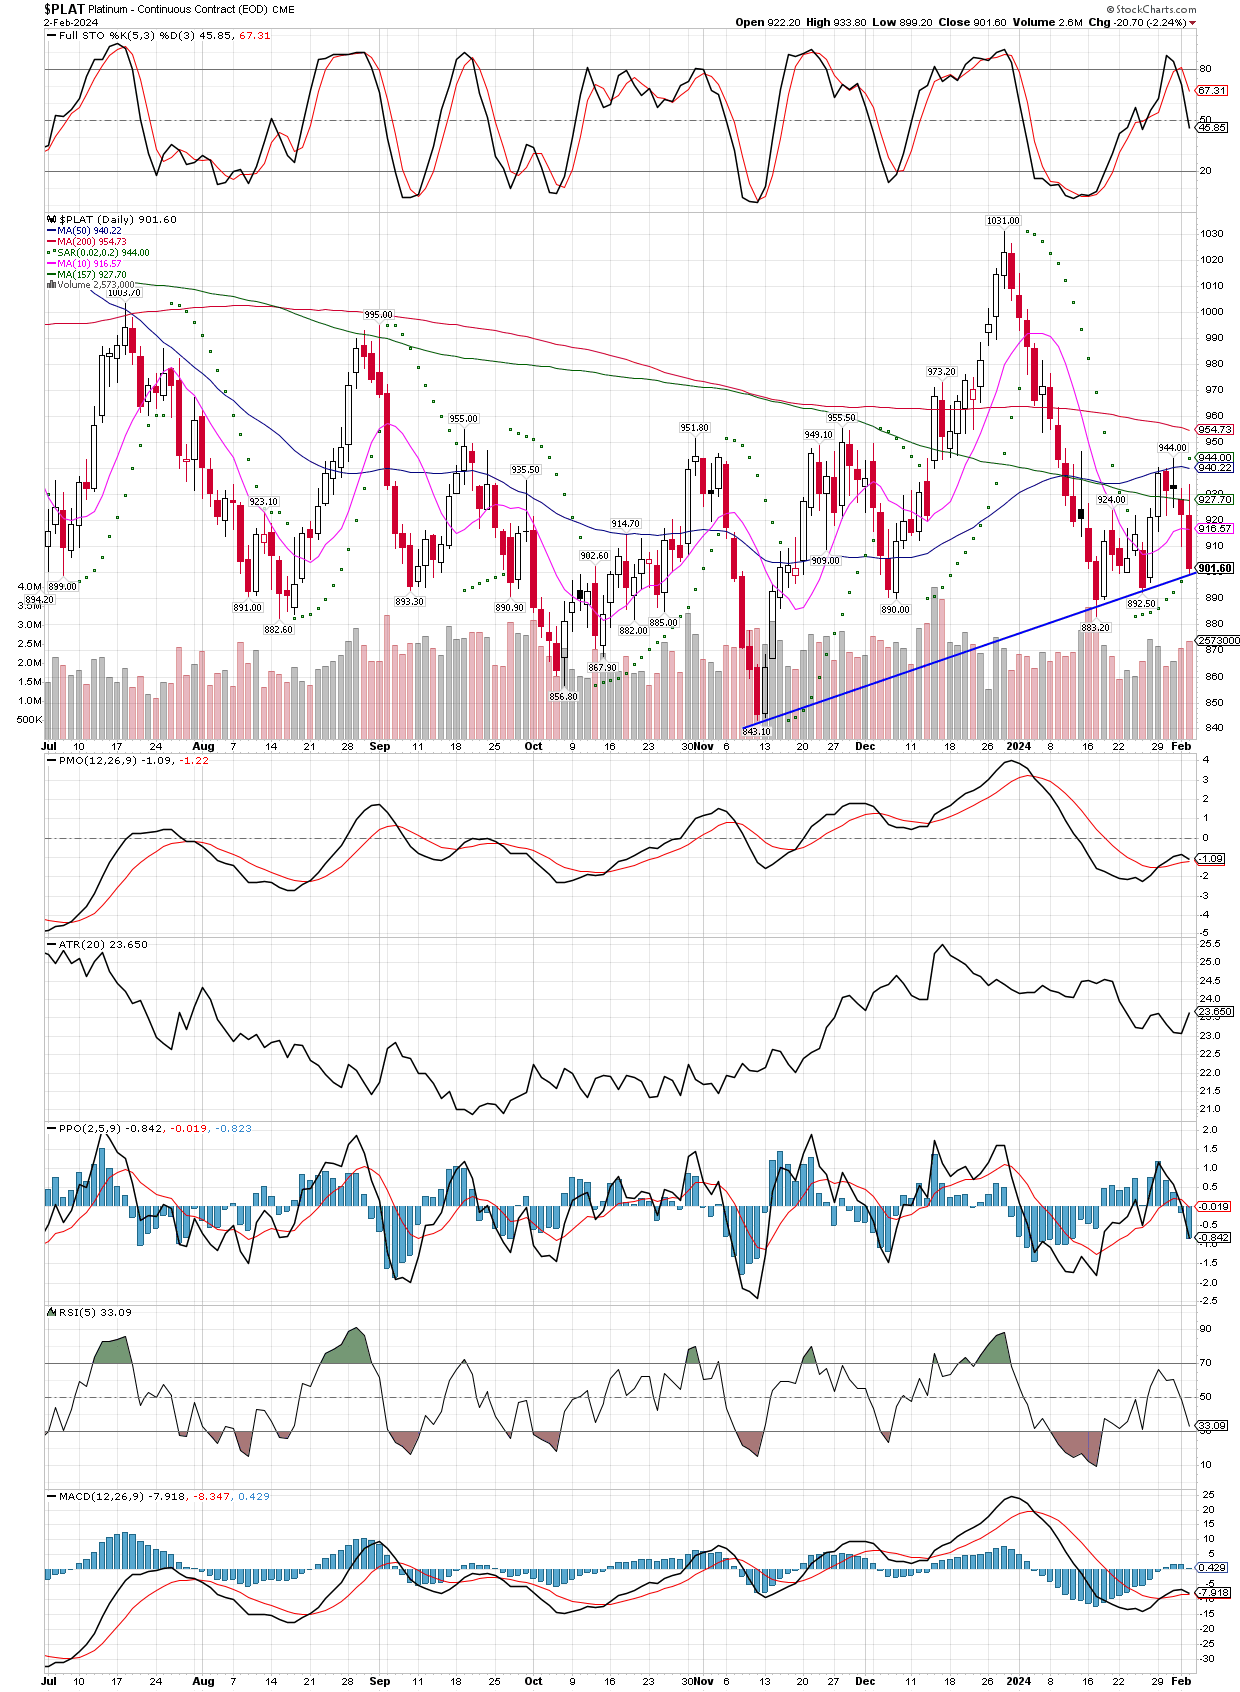
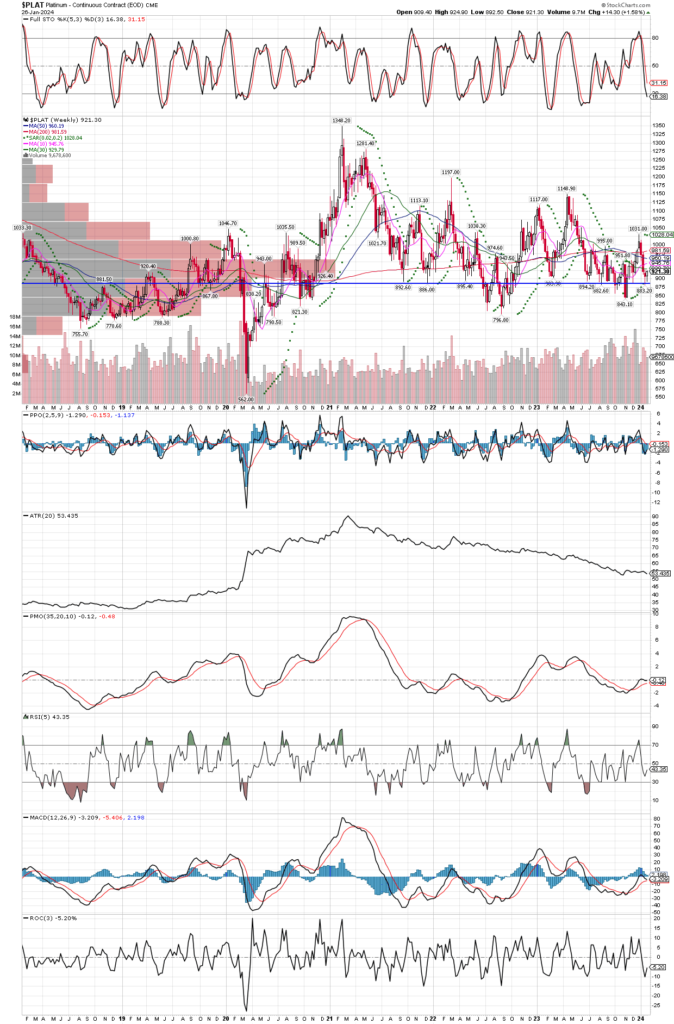
I was looking to place a horizontal trend line at the area with most contacts, and it looks to me that platinum might now be at the lower end of a wide range, and a possible buy. I will also look into palladium this weekend, and if it is similar, will be inclined to buy some miners in that group as well. A stock like SBSW is trading at just 4X earnings of $1.05 last year, a valuation that is hard to ignore.

