SILJ Rally in 2016

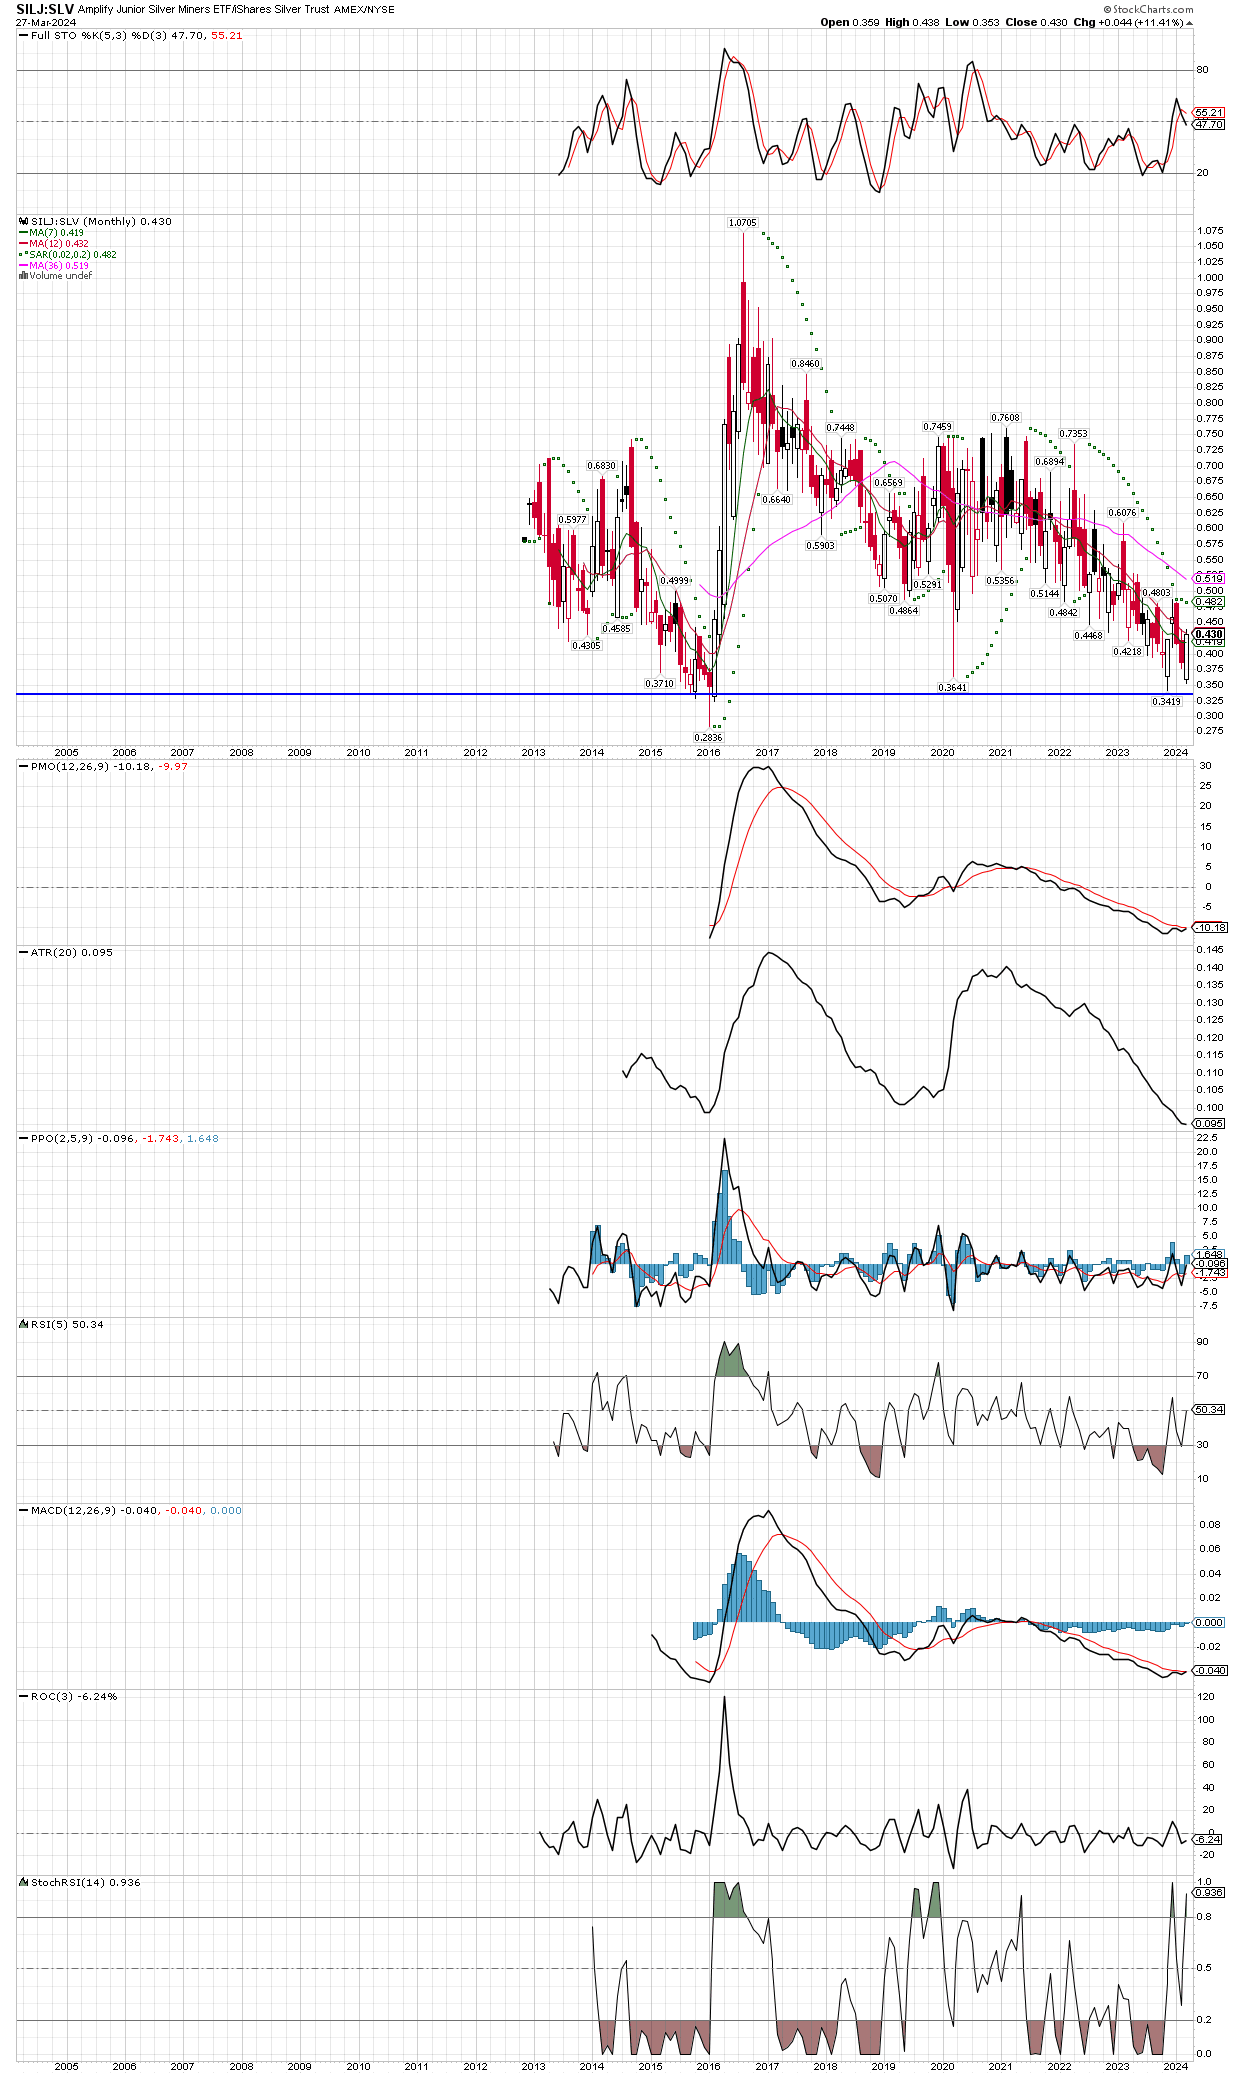
In this chart I examine the sharp 2016 rally in miners, specifically the SILJ etf, so that we might know what to expect in a similar bull market move. The blue arrows are the rallies, measured as how far SILJ rose above it’s 200 day MA, while the red arrows mark the corrections that took place after the sharp moves higher. It seems that in 2016, SILJ would rally 105%-120%, before selling set in and it dropped between 20%-25%. Also of note, the worst corrections occurred near the end of that bull run, so maybe that will be the tipoff this time around as well. Notice the red correction zone that lasted about the entire month of May, and brought prices down about 24%, but only after SILJ rallied 120% above it’s 200 day MA, maybe something else we should be prepared for in this new bull market?

With SILJ currently sitting just 22% above its 200 day MA, the takeaway is that there is still lots of upside potential in this rally. Also notice how many times SILJ stretched over 100% above the 200 day MA, over the course of the 8 month bull run. I would encourage people not to take profits too soon, the miners rally so sharply at times that it’s almost impossible to get back in!

GDX Breakout on Monthly Chart

GDX has decisively broken the down trend established in 2021, and depending on how loosely one draws the trend line, it could be argued it started back in 2011 when metals and miners peaked. Either way, our accounts are up another 4%-6.4% today, as many miners make new bull move highs along with both silver and gold. On a side note, I started a position in Cotton futures yesterday that I will look to add to, if it can start rallying.

Patrick Karim’s Take On Gold

Just read his latest post on Twitter, so will add his updated take on gold and his projections. Make sure to bookmark his site and visit often, very useful and I have no affiliation or relationship with him in any way, I just genuinely like his charts for long term perspectives.

Silver Possibilities From Patrick Karim

I have found Mr. Karim to be correct more often than not, and more so on his very long term observations, which I define as 2+ years. I have linked to his recent twitter post regarding the implications for much higher silver prices after the recent breakout, pay particular attention to his “volume defined base”, and the fact this indicator suggests its potentially clear skies ahead, up to the $40 level conservatively, or the $62 level on the metal if things get bonkers. Bookmark his site, they do some fine charting and get the long term trends correct.

Other Commodities like Cotton

The chart below shows weekly data for the last 10 years. After a signifcant run out of the 2020 lows, cotton futures manages to triple over the next two years. Then we get the classic correction, followed by a correction lasting roughly a year and a half. Corrections can last longer, sometimes even three years, but the recent breakout early this year suggests the correction might be over. In that case we wait for a pullback to the breakout are of 90, then start acquiring a position. I am looking to add cotton futures for myself and client accounts in this area where it currently sits in the 88 region. As always, position sizing is the most important aspect of trading, and cotton has a weekly ATR (average true range) about $4.60, so size accordingly, knowing each contract trades in roughly a $2,300 range each week.

SILVER IS ROCKETING!

Today was the best day of the rally so far, with accounts jumping 7.5%-10%, after an already stellar month of March. Notice the huge volume flowing into the SLV etf, which I only for charting purposes, I do NOT recommend anybody invest in this particular etf for silver exposure. Much better to buy physical metal, miners, and the PSLV etf (Sprott physical silver fund). While the metals and miners are getting heated in the short term, there is a LOT left in this bull. It will be something to behold, and most have not yet gotten involved. At this stage of the bull, all dips should be bought, as they typically don’t last long.

$HUI Weekly And Monthly Charts

The $HUI gold miners index shows lots of potential upside, once it can get back over it’s 200 week moving average in the 257 area. A move just back to the 2020 highs would be 51% from Thursday’s close, and seems highly likely to me. From there, if miners and metals can continue making new highs, we should expect to see the highs on the monthly chart taken out. The down trend line on the monthly chart, no matter how its drawn (bars to bars, or wicks to wicks), illustrates how important this current area is, with a move above 260 or so on both charts having big implications for the upside potential and probabilities. Testing the monthly chart high made back in 2011 would be 158% gain from yesterday’s close of trading, and that is just the bigger miners, the mid-caps and juniors should double those returns or more.

Monthly SILJ vs. SLV Chart

Ratio charts by definition cannot go forever in one direction or the other. With that in mind, take a peek at the PPO and MACD on the longer term chart of SILJ:SLV, after testing the horizontal support going back when SILJ was first introduced, we observe both indicators about to cross and turn higher. It’s not too late, the miner have lots of catching up to do!

Miners Getting Ready To Rocket

On top of the already substantial gains the gold and silver miners have made, we see action like today with leaders such as Royal Gold, symbol RGLD. The first chart is just seven months of data, to easily show the magnitude of today’s move. The second chart goes back to early 2022, so we can see what happened the last time RGLD acted similar, noted by the blue arrow. It was the start of a 33% move over just 6-8 weeks. Buckle up!

SILJ vs. SLV

The down trend in this ratio was broken convincingly earlier this month, suggesting it was time for the silver mining stocks to outperform silver, which has occurred. Today, it’s good to see a strong bar higher, boosting the ratio over its 200 day moving average, after dancing around on either side of it the last several days. It’s still early in the move, and once the ratio can turn, all its moving averages to trending higher, the silver mid-cap producers and juniors will really fly.

The precious metals miners group in general is performing quite well, with stocks like EXK, FSM, NGD, JAGGF, and AYASF all making new recovery highs, with many others very close to doing so, such as GATO and SVM as they hang up near their recent new highs. Today we also saw GDX make a new recovery high, with GDXJ, SILJ, and SIL all in hot pursuit. Even recent laggers AG, PAAS, HL, and MAG are in the game again, MAG is up just under 10%, while AG is back over its 200 day MA, with PAAS and HL looking to do the same, as they sit just under their respective 200 day MAs. All in all, the move looks great, more so because its hardly getting any press, its still as if nobody cares! These have a long way to run, in my opinion.

SIGN UP FOR UPDATES

NO SPAM, EVER!