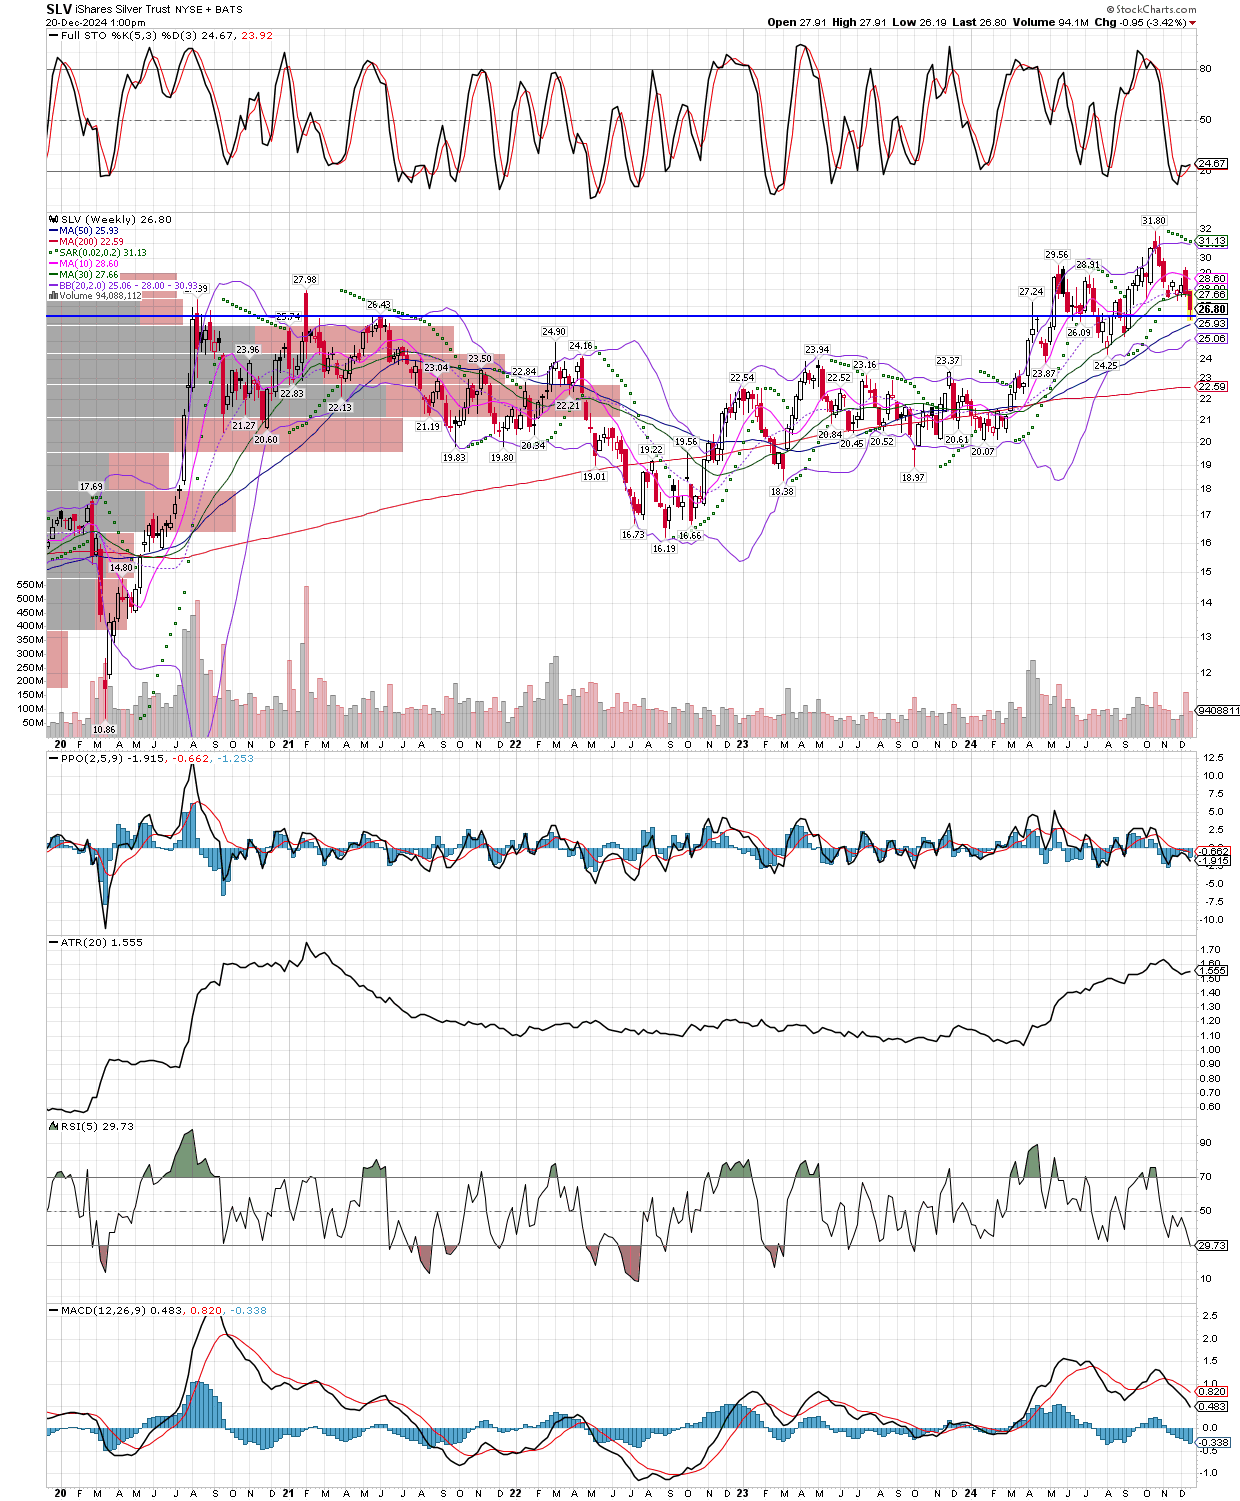
I will use the weekly chart of the SLV etf for a proxy on silver, with a quick horizontal trend line added, to show why I am adding to our Silver futures (March contract) position today if we get over the $30.09 level. That level if taken out on the upside, would suggest the move lower this week was a false breakdown. Thus far, Silver has managed to get up to $30.03, so we are getting very close. I will add 20% to the current position size.
There are so many miners with similar charts, I only use this one of symbol ANGPY since I was buying it today at $5.35 per share. Its the world’s largest platinum miner, and pays a dividend of 3.3%. Apparently its a favorite stock of Jim Grant from the Interest Rate Observer, I read recently. Like I said, there are many, many miners including the SILJ etf itself that are down 30% off recent highs just made in October, so I will continue adding to positions here since we are still up nicely overall. Having a good cushion of unrealized gains makes it easier to stay calm in corrections like this, so that we can buy or add to positions versus being scared out of positions, the opposite of what we want to do.
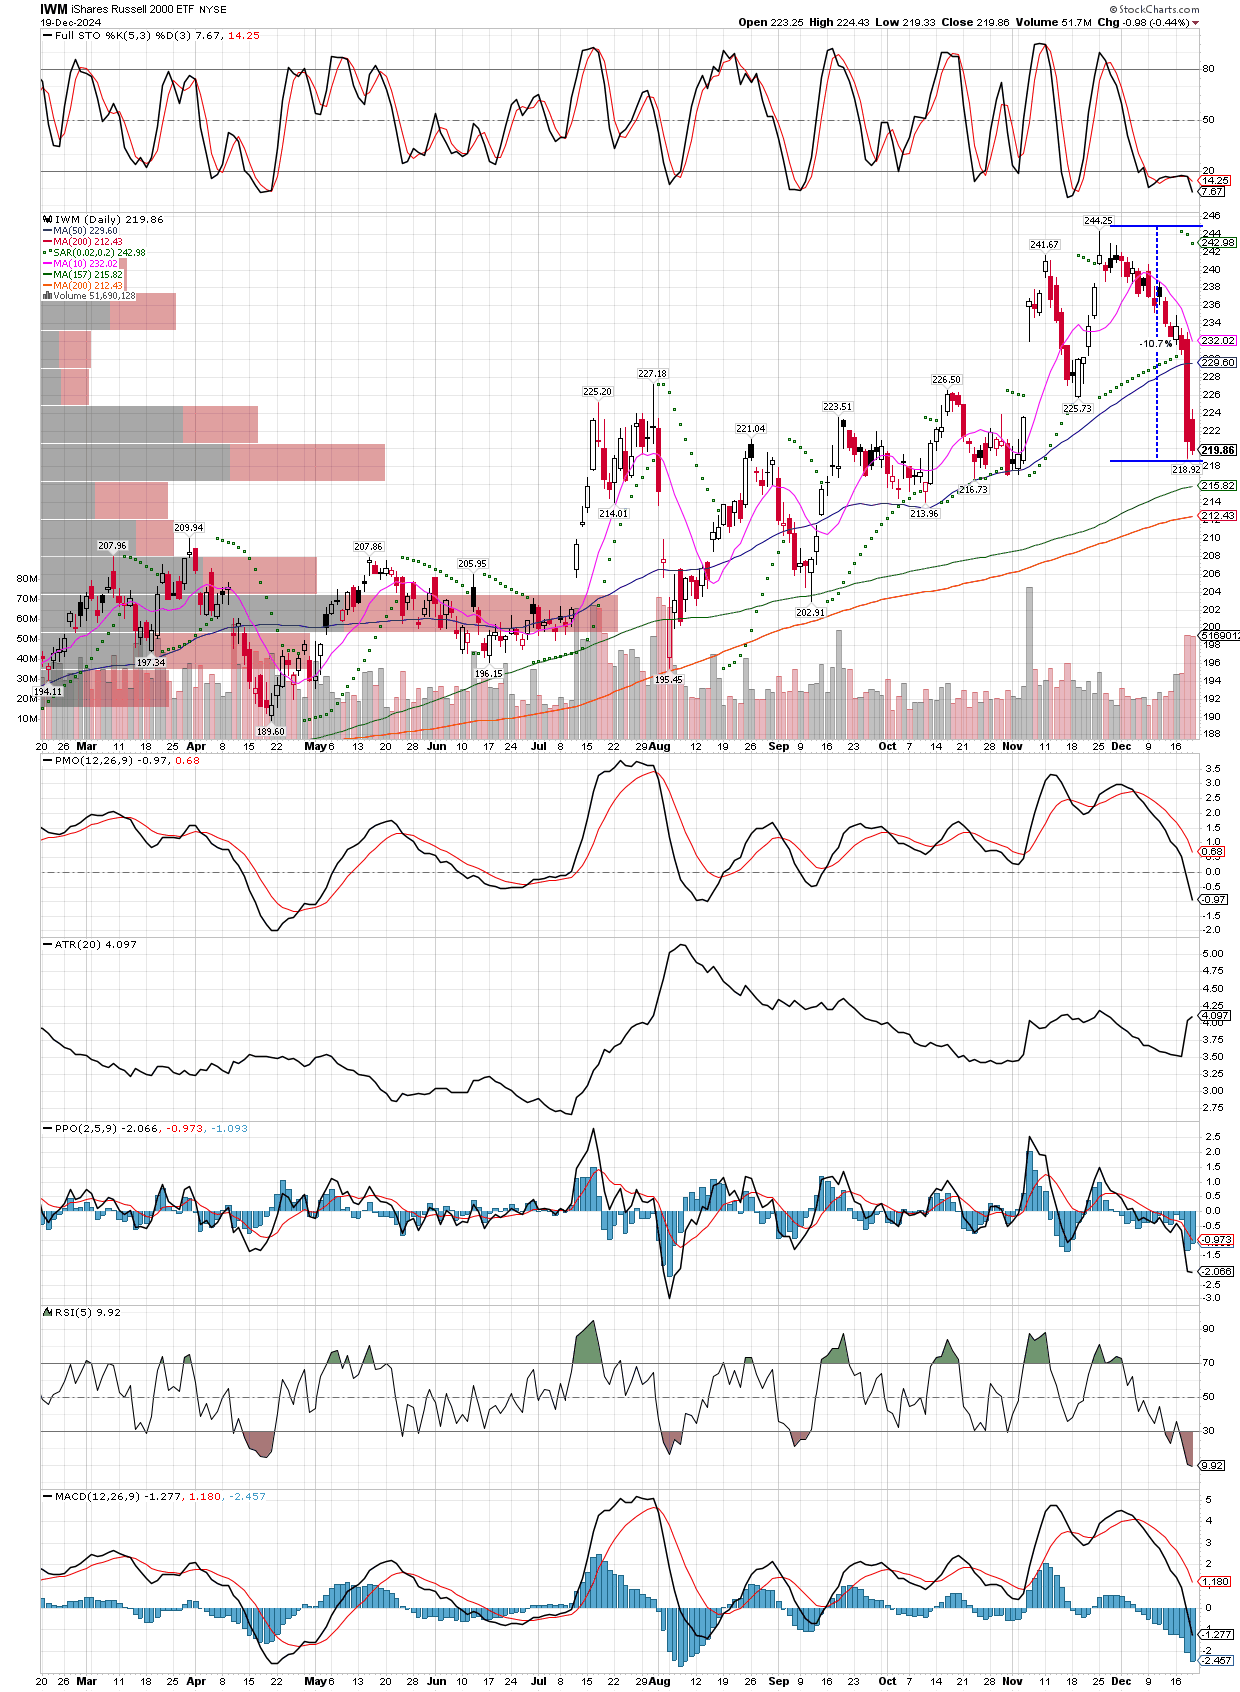
The Russell 2000 etf by symbol IWM is already down 10.8% from its all time highs made in late November, less than a month ago. We also see groups like biotechs, solar, and financials (KBE) making new correction lows. So the question is, how much downside will they see, and with crypto junk also crashing, will some of the money leaving these overbought areas find its way into gold, silver and the miners? Stay tuned!
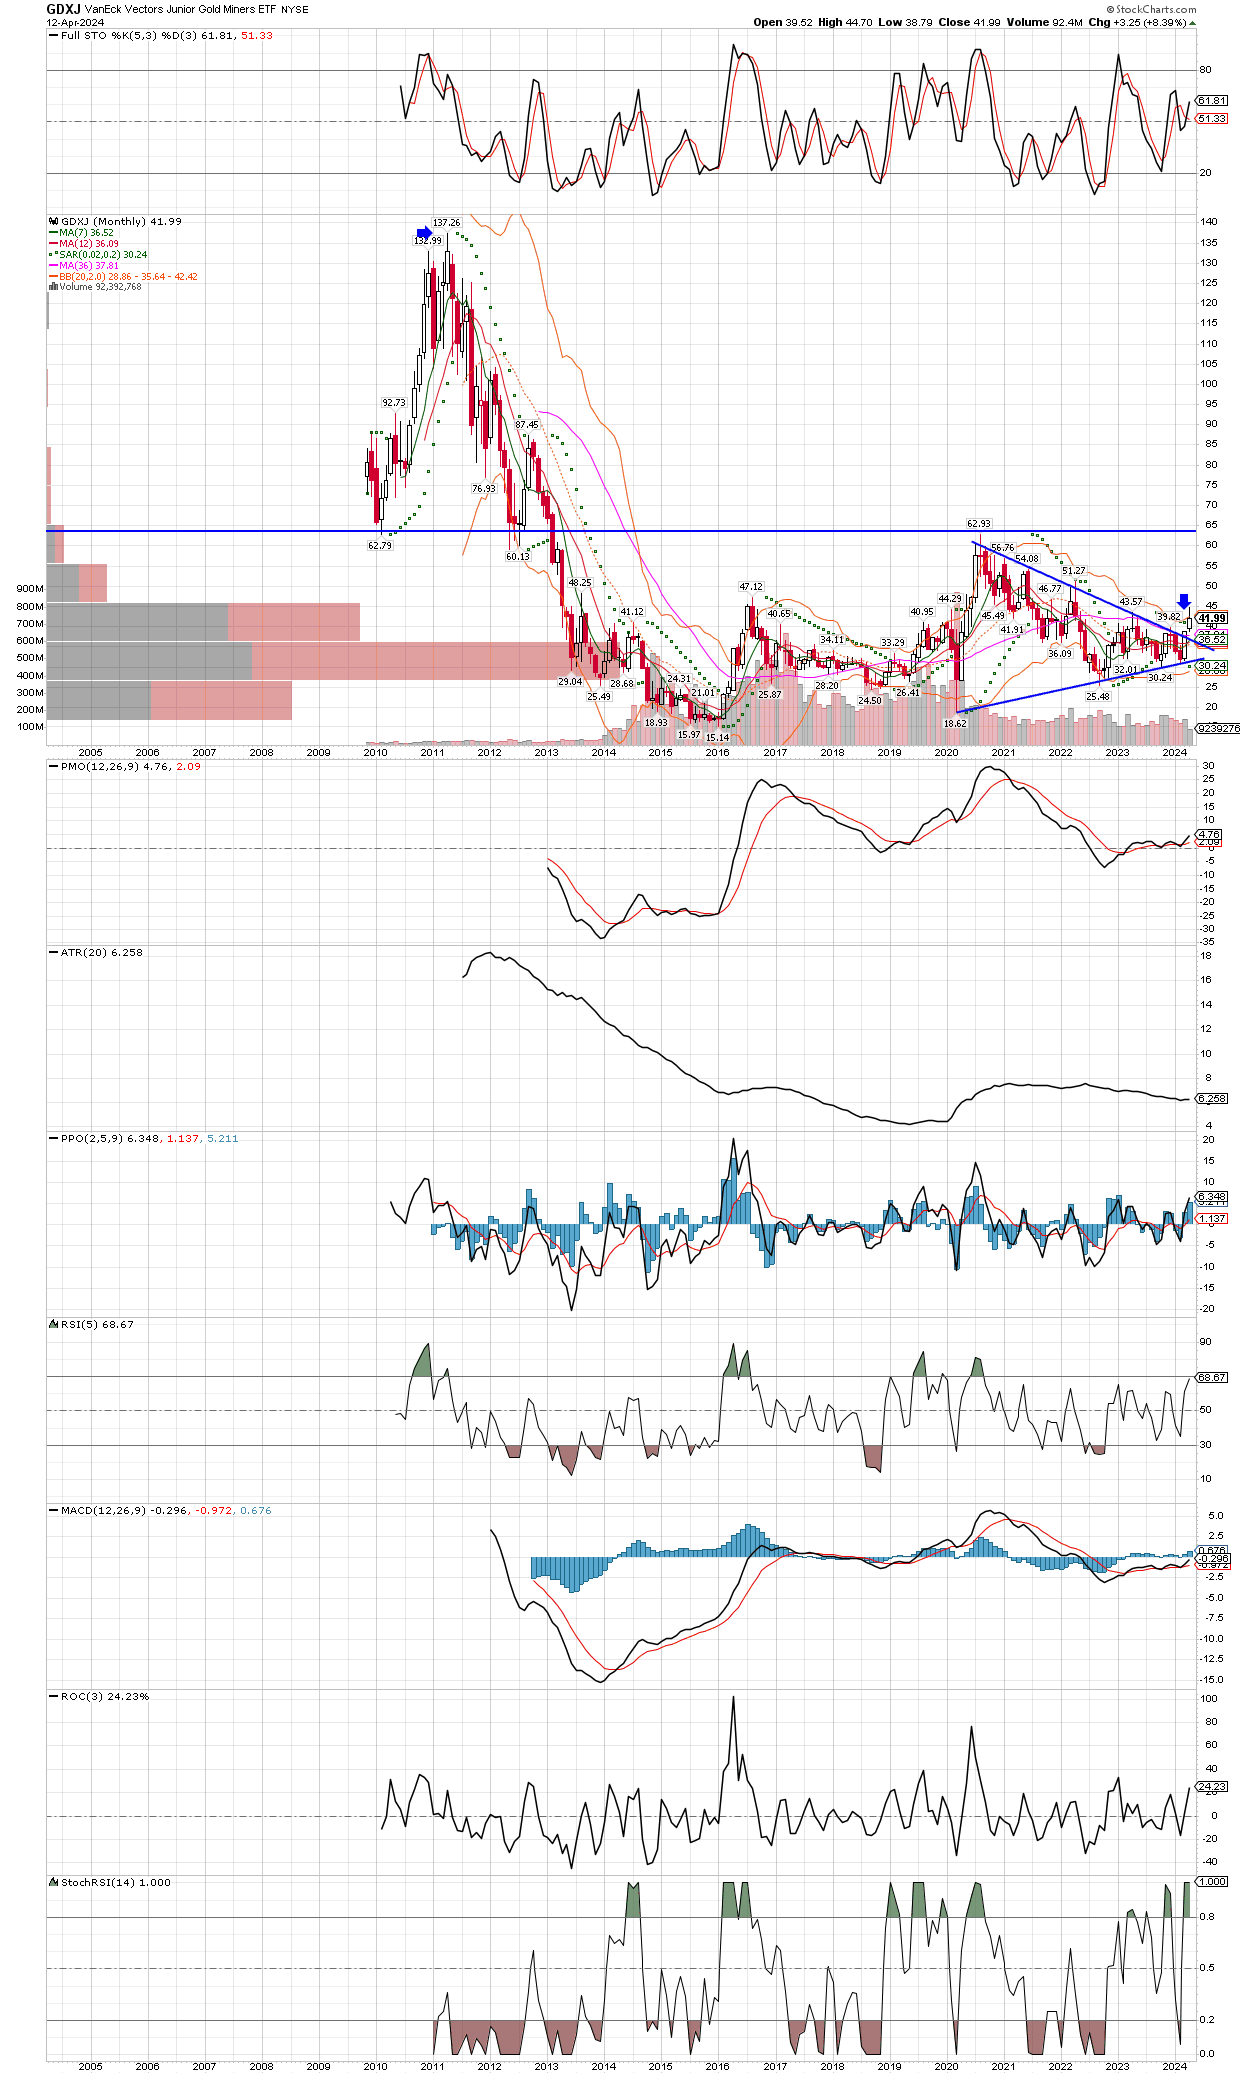
We are currently pulling back in the metals and miners, just ahead of the best time of the year seasonally, for the group. Time to add into dips again, on oversold technicals on shorter time-frame charts like the weekly and daily setups. It looks like a monthly close over $39.50 or so might be enough to motivate the miners to make a massive bull run to the old highs in 2011.
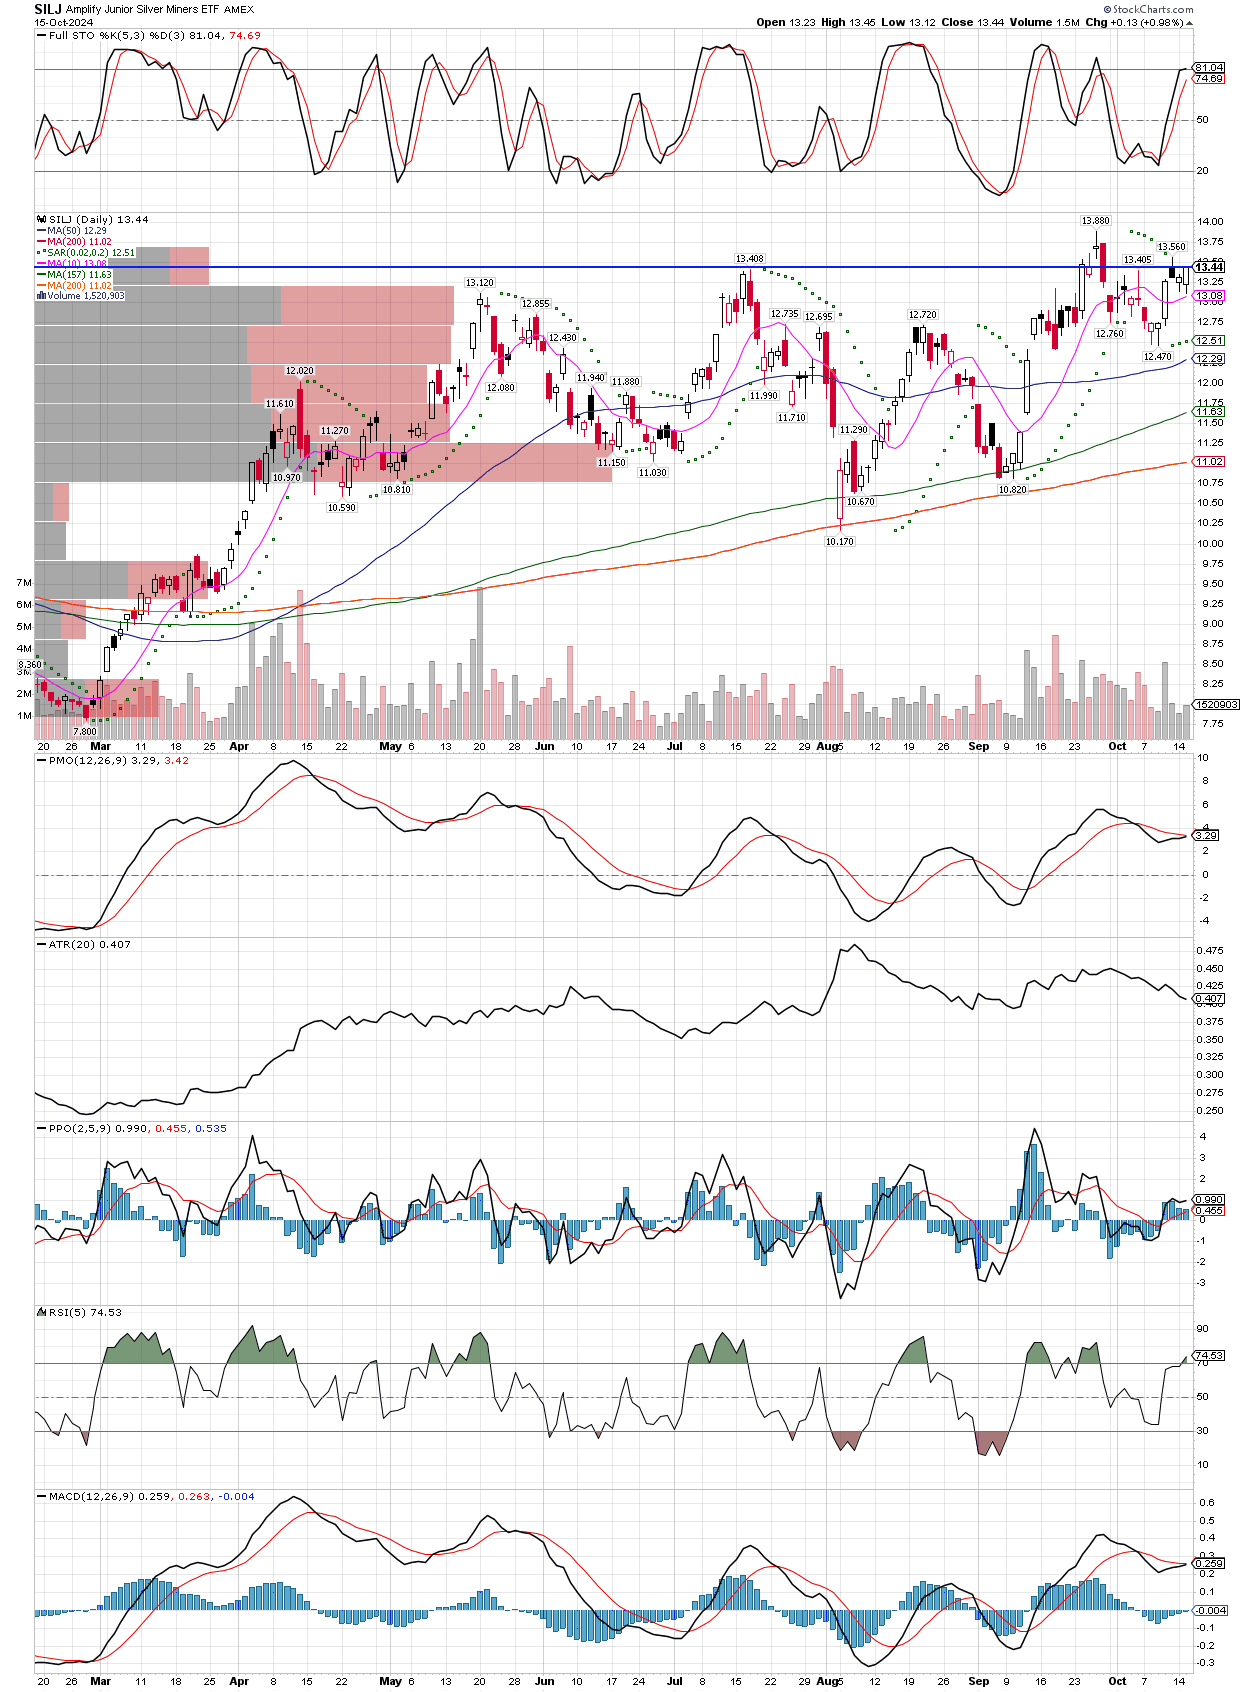
As I type about 90 minutes before the US markets open, SILJ looks like it will test and possibly slightly break its uptrend line, 200 day, and 200 week moving averages all at once! The excuse being used it that the Trump win puts the markets back into “risk-on” mode, and that can be seen in bitcoin rocketing to new highs, and the general stock market making new highs as well. In the face of that, we see copper stocks (COPX), and precious metals miners getting smashed. So, the question is, has the bull market in commodities and especially gold and silver ended. If one thinks so, that these recent sharp moves are going to continue, then they should make drastic changes to their portfolios, but if one is like me, and thinks these moves are just short term reactions to a Trump win and nothing will change in the overall policy of dollar destruction (more wars, more spending, etc), then this should be a good area to accumulate more heavily the miners and their metals. I am leaving copper aside for now, in fact I sold TGB and LBCMF this week to take profits, but only because I think we are more likely to see negative economic data come out soon, as is often the case early in a new presidency. The winner likes to cram as much negative news into the first year of his term, so that they can blame the other guy and lower expectations, then they can easily beat this expectations as their term winds up, and claim how well they did!
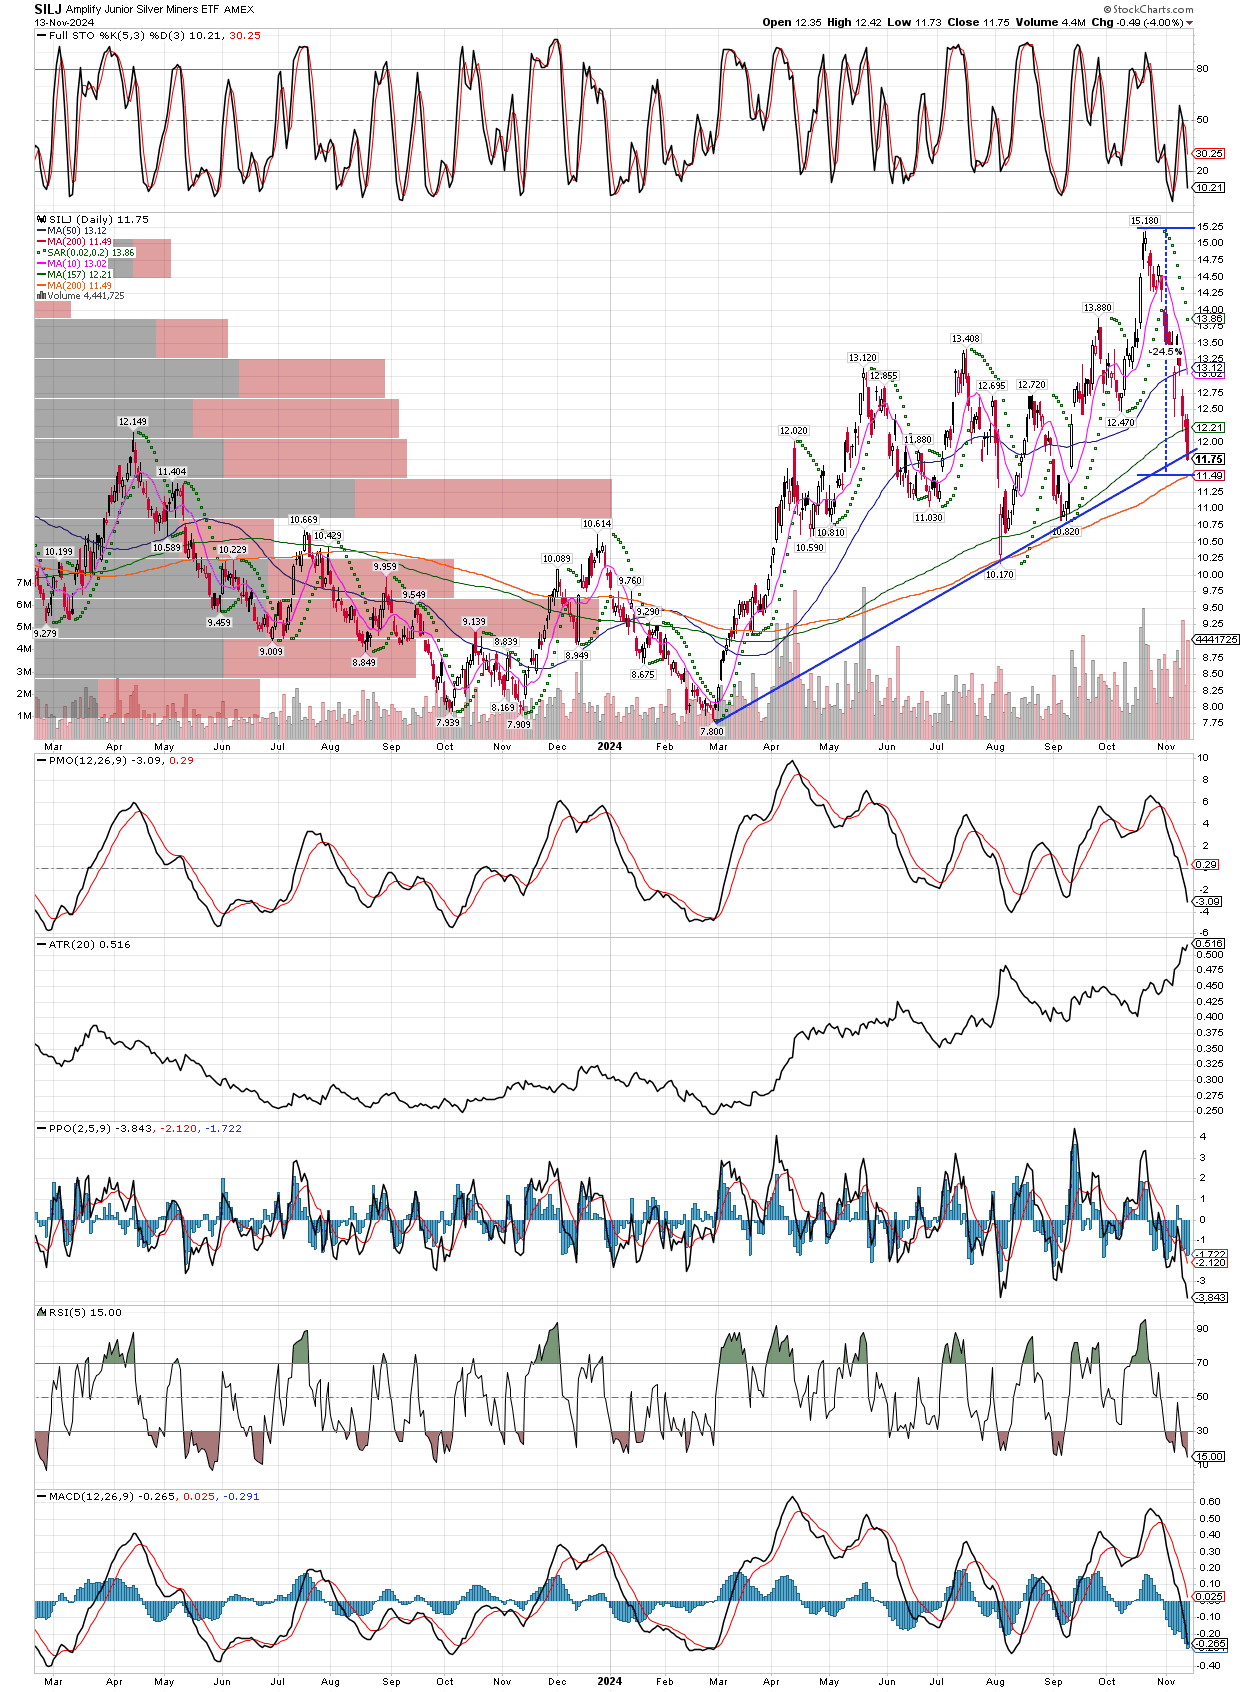
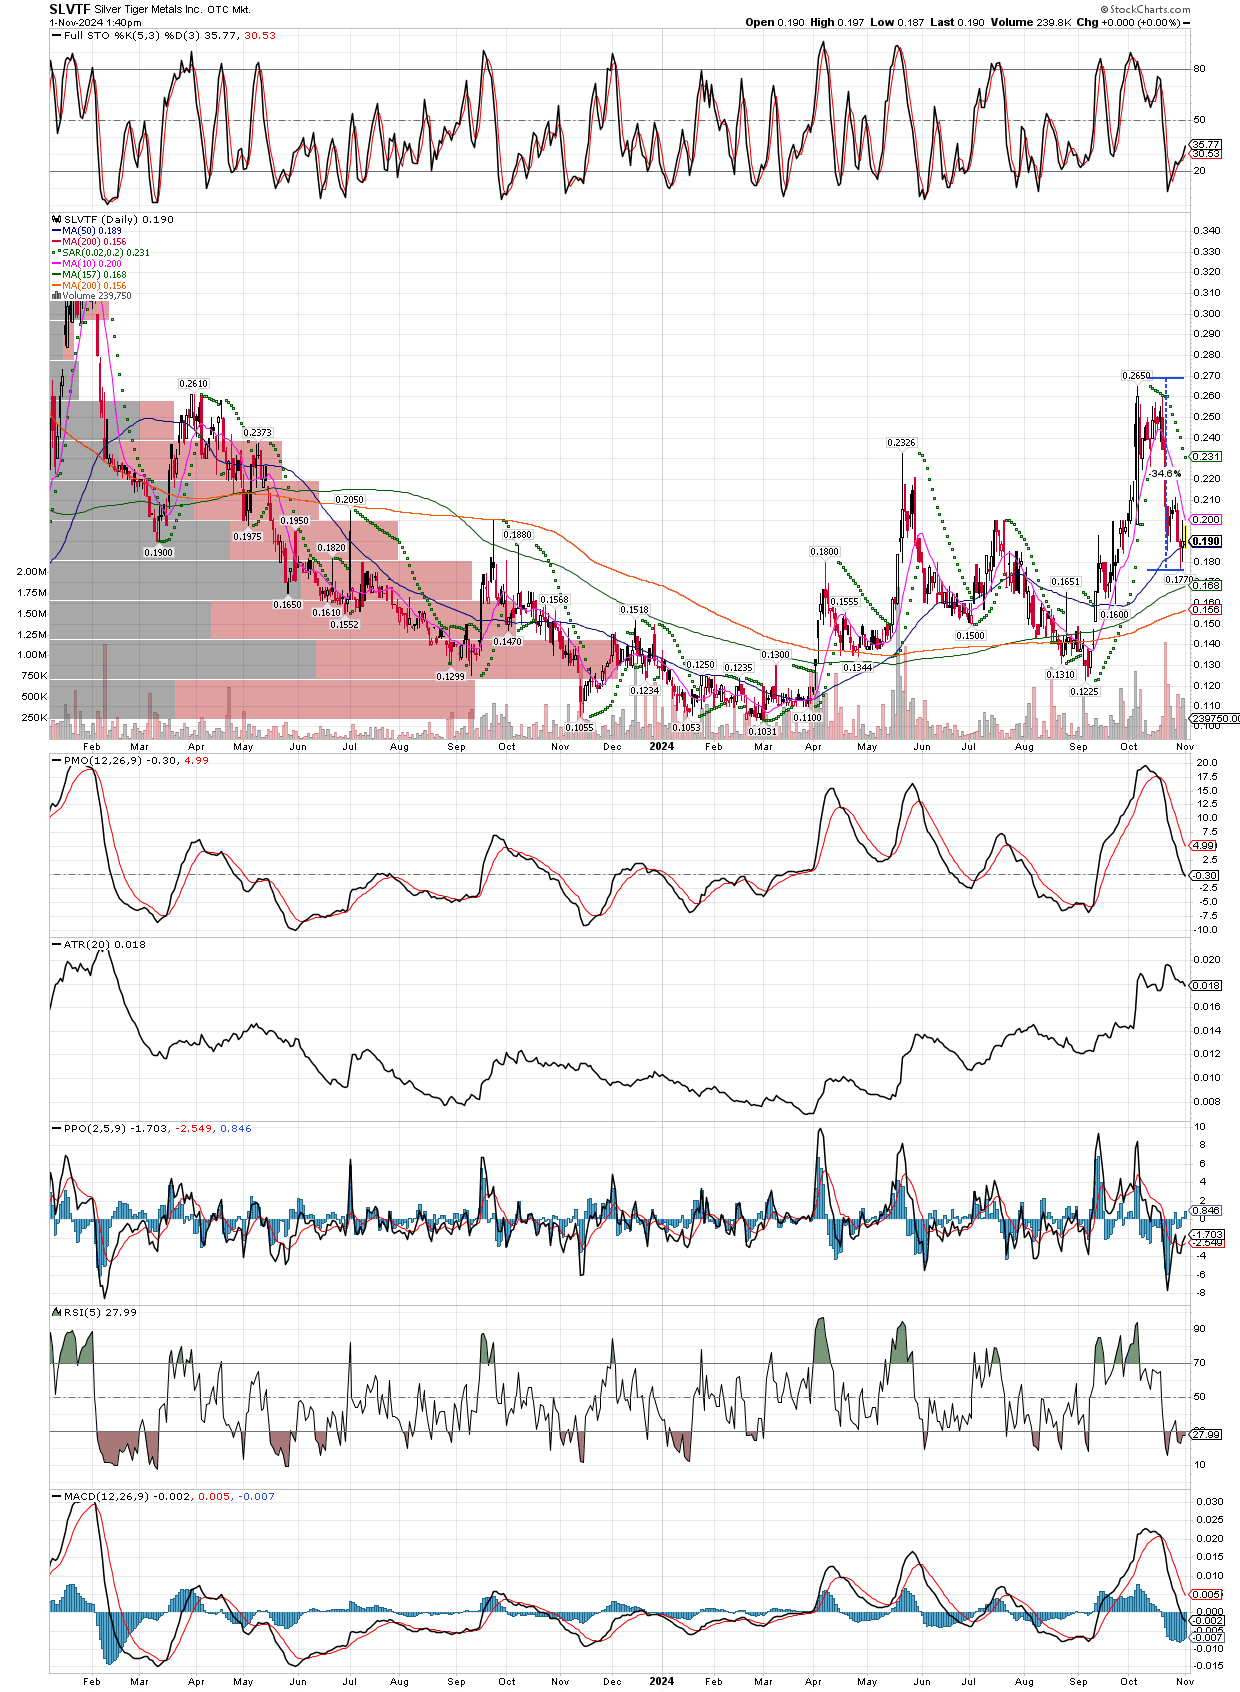
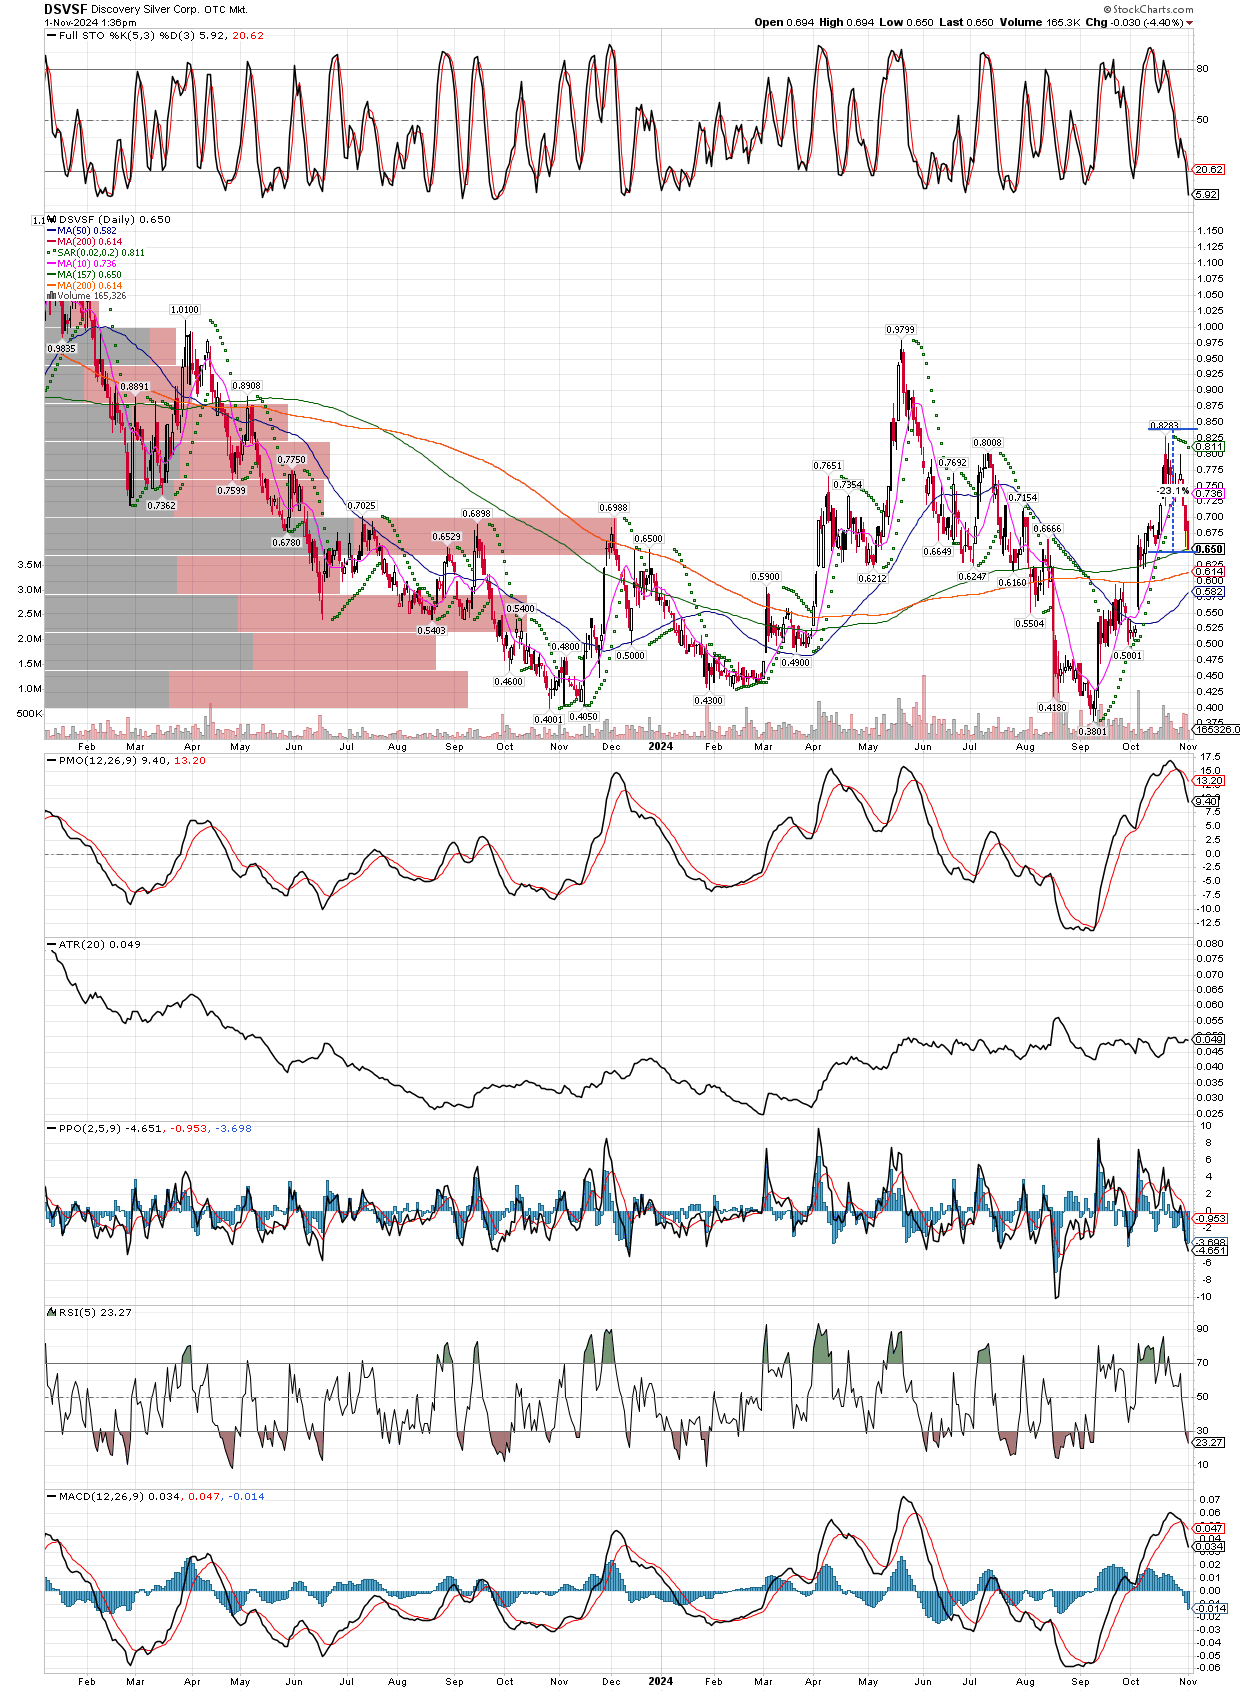
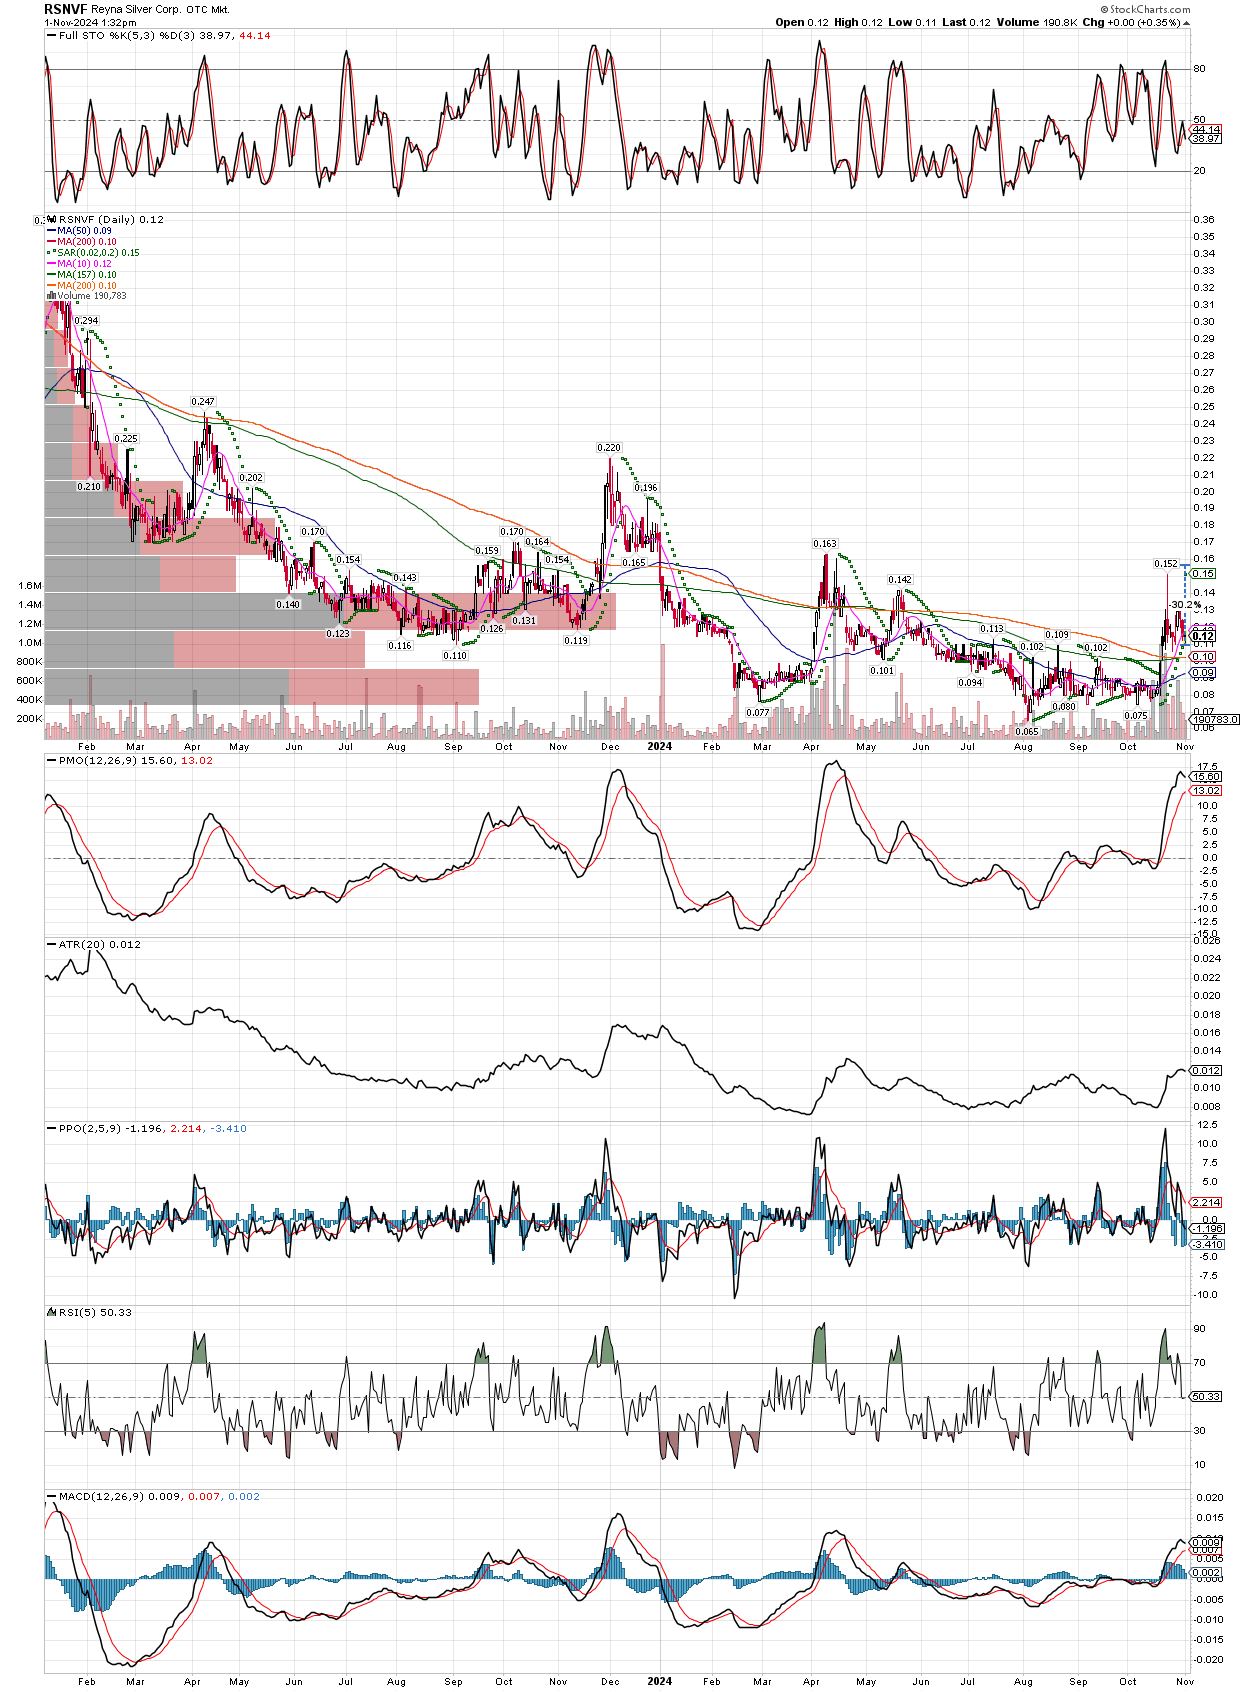
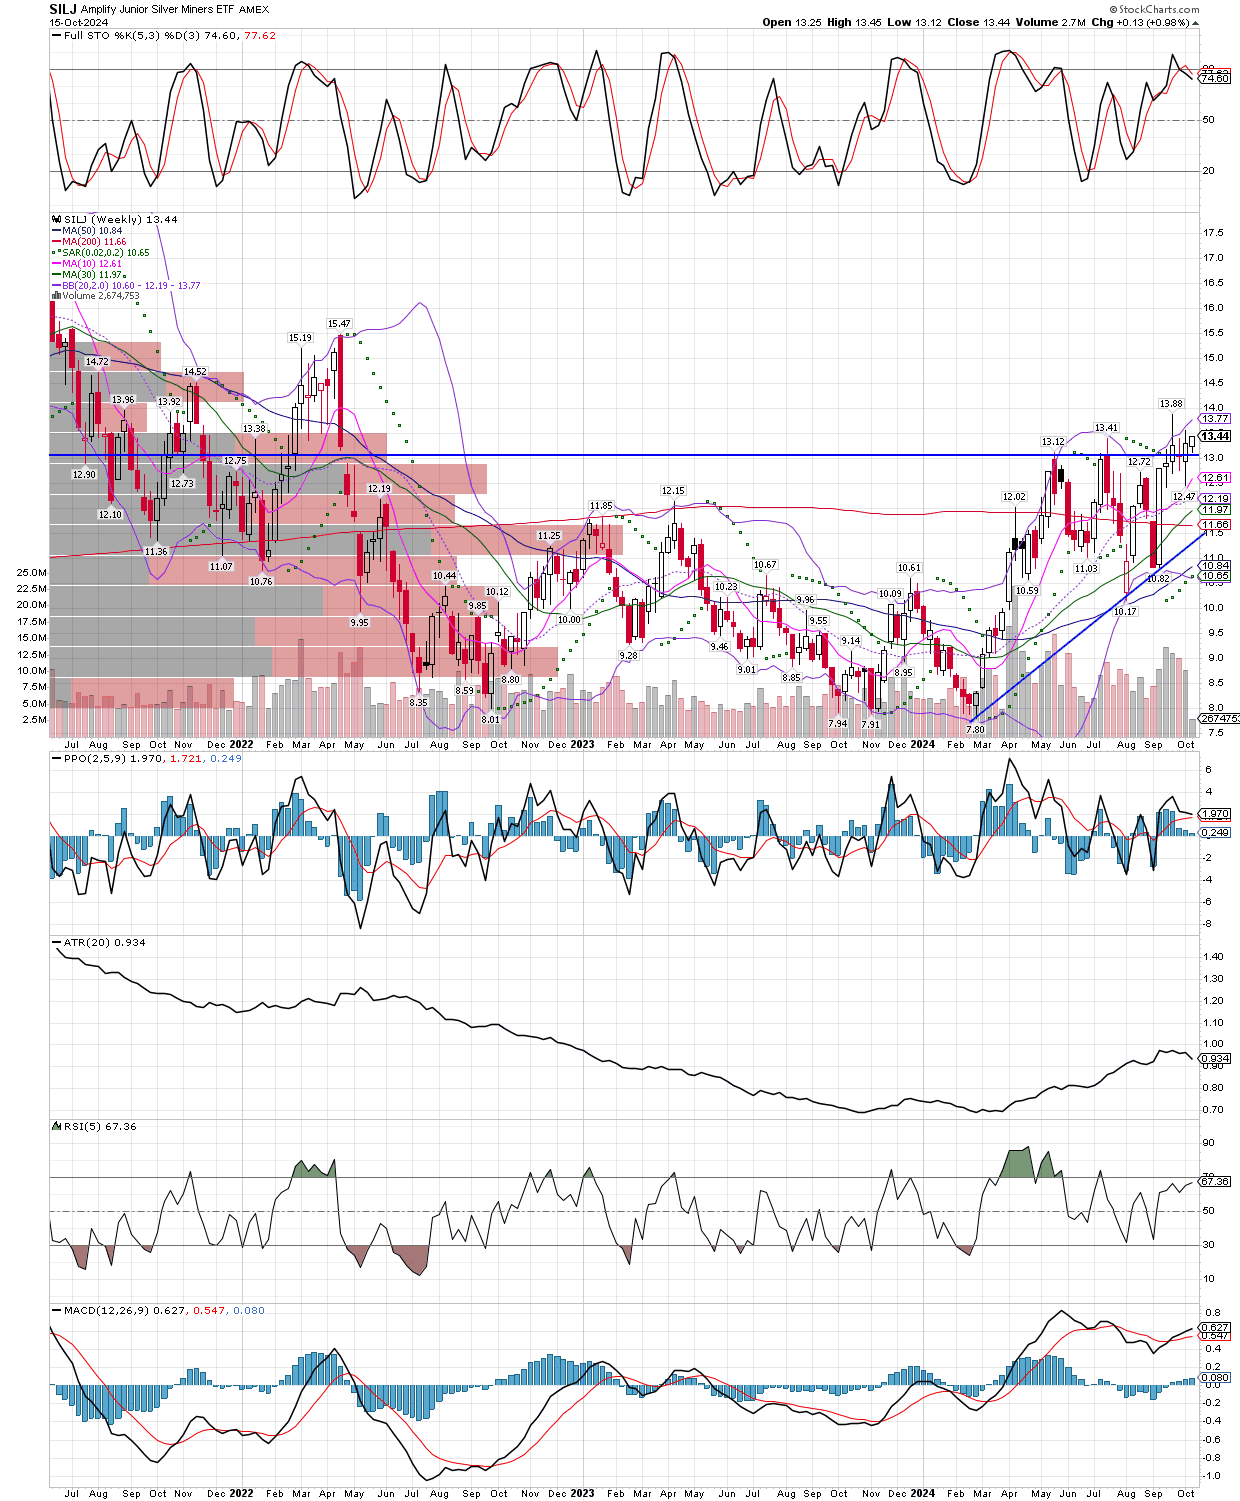
I am taking this selloff as a buying opportunity, with SILJ down near 25% already in three weeks (and 11% just this week so far). Recall that I have pointed out corrections in bull markets are short and fast, and can cut deep, all of which we are seeing now. Prior to the bashing, gold and silver miners were sporting very nice charts, making multi-year highs, and silver itself was making 14 year highs, while gold continue to make all time highs. These trends don’t break easily, so we should expect a good-sized bounce soon. Does that mean I think the fast rise in prices we saw will return quickly, and the bull market will be back on in full force? No, it could happen that way, but more probable is we get a bounce, then they sell off again, then rally, as they go mostly sideways for awhile (4-8 months?), before the bull is ready to re-exert itself with force. In any case, declines like this one that occur in bull markets, typically are places one wants to add exposure. Below I will post both the daily and weekly charts of SILJ, keep in mind trend line averages are never lines in the sand to me, they are just loose areas where we can look for support, resistance, etc. All the names I have mentioned in recent articles and even a few new ones like ASM, which is another miner that has just pulled back 33% after making new multi-year highs, are stocks I am buying, including SILJ itself. Stay focused, and take advantage of some of the sales happening right now!
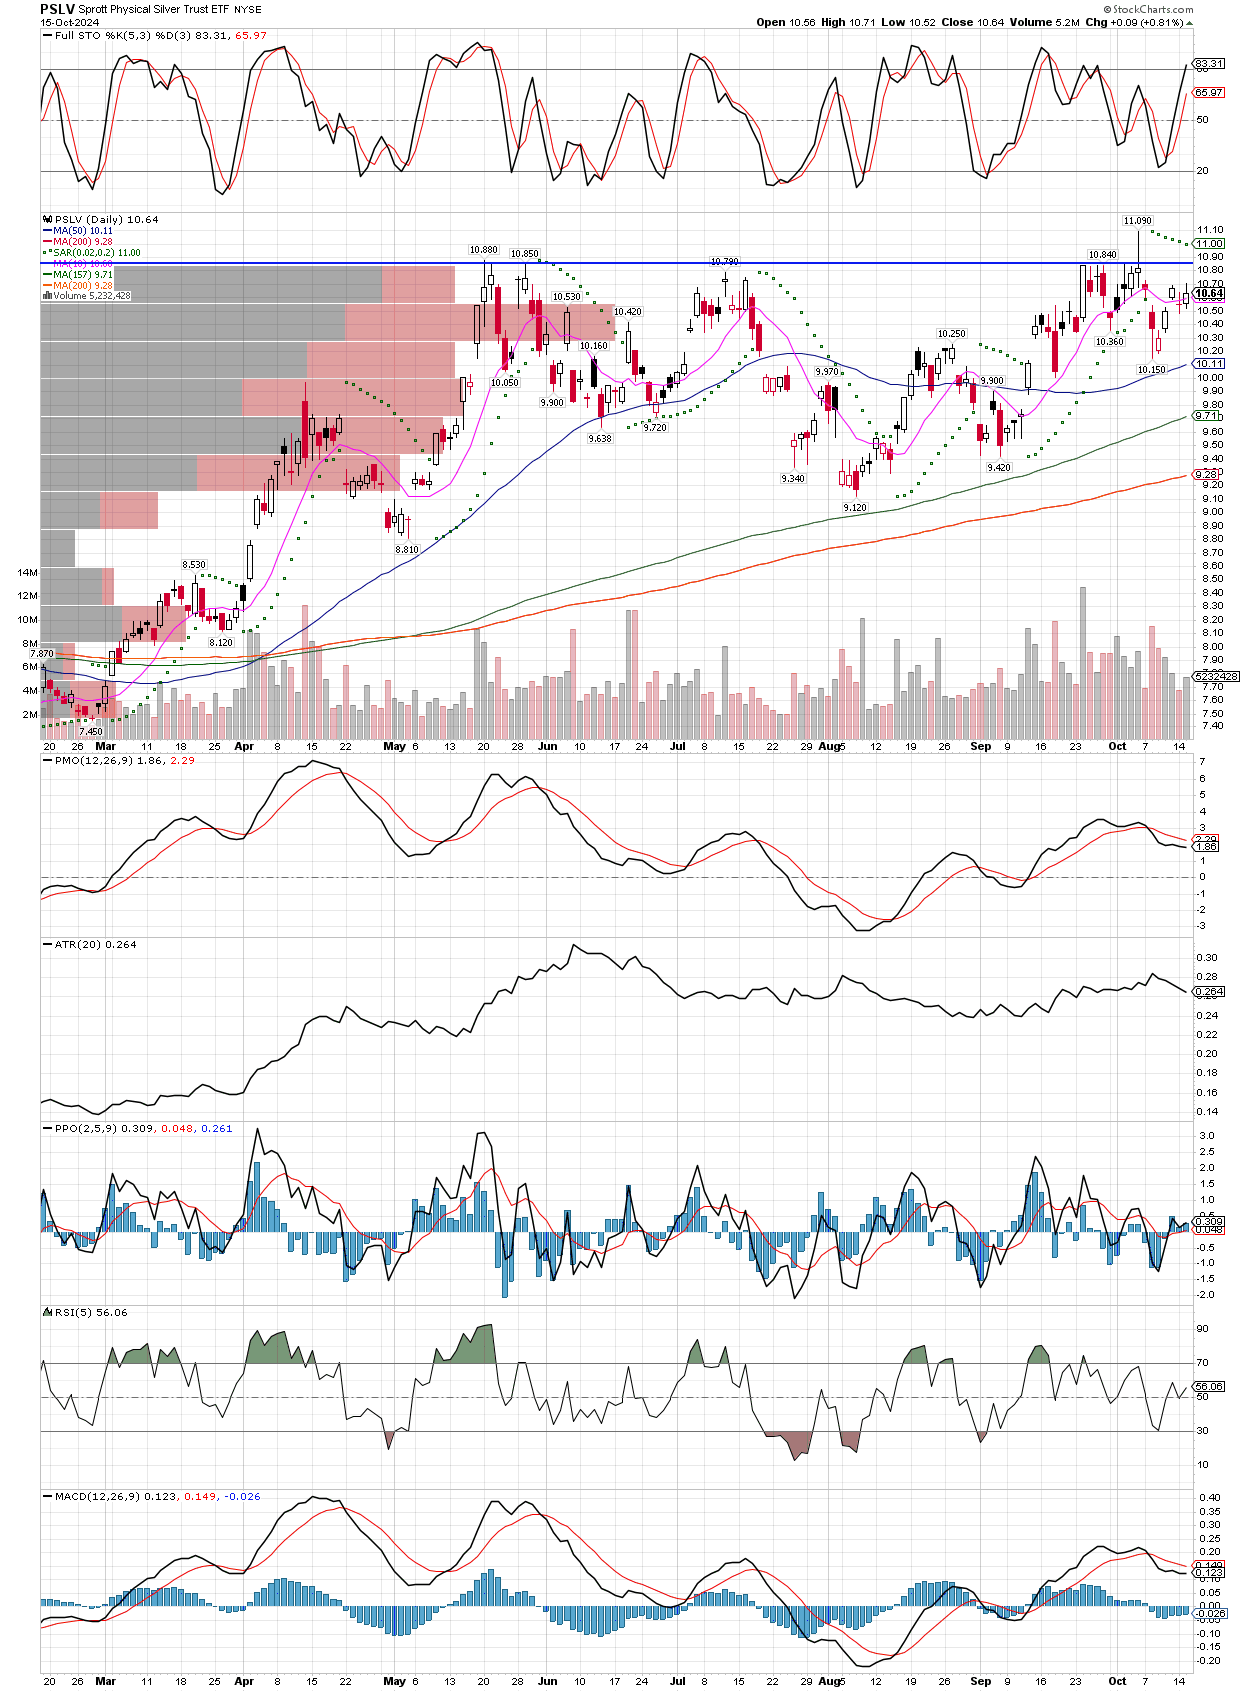
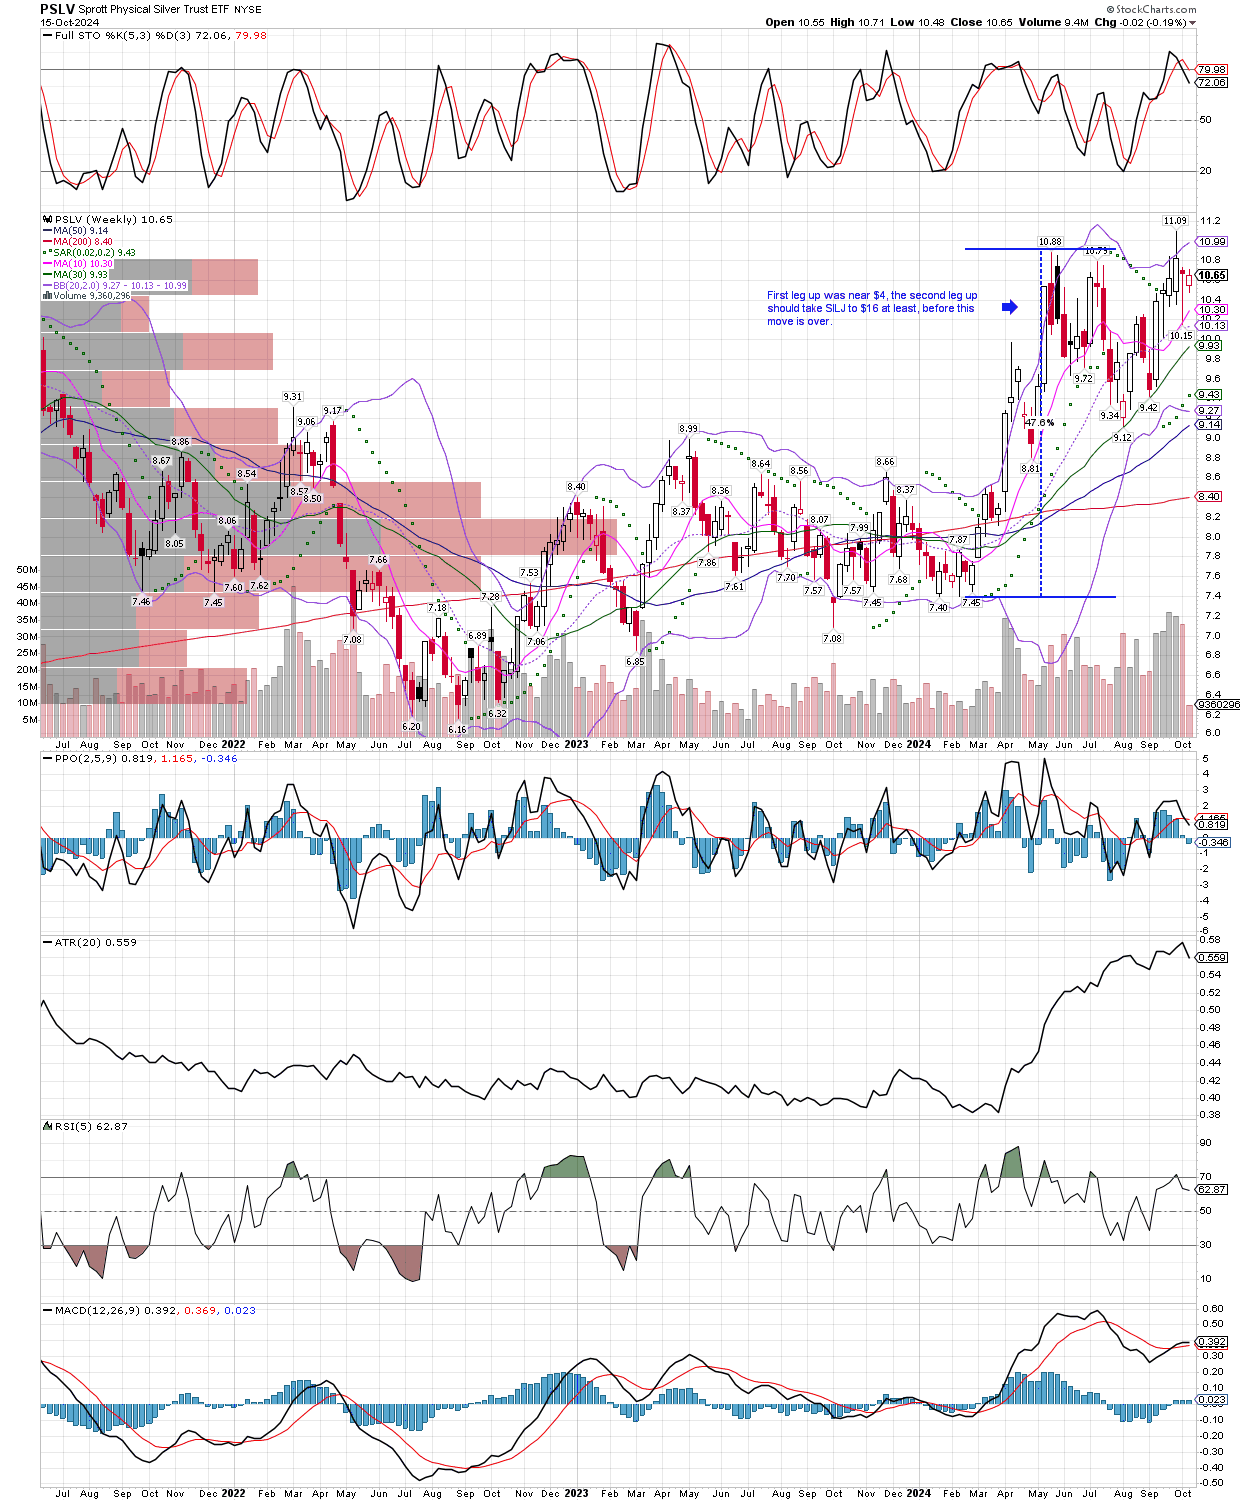
Another indicator I will look for, to determine when the metals bull will be due for a significant break, and to take some profits off the table, will come when the discount to NAV on the PSLV etf is closed. The Sprott Physical Silver fund currently trades at a 3.1% discount to its NAV, and in all major tops since it came into existence, it closed the discount and at times even went to a premium. This occurs as a result of an overheated market, and tells me to take some bets off the table. I recently had a long term chart to post here, but it now shows a broken link, so one can follow the NAV discount on Sprott’s own page for the etf here. By the way, this is the ONLY physical metals etf I would purchase, in fact we already own a good sized position, since they own the physical silver bars and report their serial numbers frequently.
The best chart I can find of the history of PSLV’s discount to NAV is courtesy of Ycharts, and can be seen here.
After several weeks of spectacular gains, a correction is to be expected. Furthermore, I expect it to be sharp and painful, but not last too long, since that is usually how it works in bull markets. The declines seeing are deep enough to shake out late buyers, and painful enough to see big gains evaporate for the early buyers, that they question if it might not just be better to leave with the gains they have left, rather than lose them too? Both of those scenarios are what helps reset sentiment, and gets the market ready for another leg up, with as few people on board as possible. It’s how markets work.
It helps if one can remind themselves of the facts, such as silver has not even challenged its all time highs as yet, and in fact has only recently broken out into new multi-year highs. This week we saw the world’s largest gold miner, Newmont (NEM) get clobbered on earnings that really weren’t bad, and certainly nothing like the market took them to be. The stock dropped all the way back to levels last seen in May! This was used as an excuse to sell the entire group, and many of the little explorers which I have not been invested in very heavily, also got smashed to the tune of 25-35%. The reason I mention these more risky explorers is that until now I have focused on owning the mid-cap producers, with exploration upside. They tend to do the best early in a new bull market, as money comes into the group and the bigger names have already moved up. Simply put, they have the best risk/reward in the group as a whole. However, as the group becomes more recognized as being i n bull mode, new investors coming in look for things that haven’t moved up yet, that brings us to the junior explorers, which often go up the most in a bull, but only by the end of the bull, since they don’t get into gear until later in the game after the bigger names have run up and even get tired. While I have not sold any of my mid-caps, since this is still early enough in the bull market, I have taken note of these large pullbacks in my list of juniors. More importantly, this decline is coming on the heels of them finally making their first, sharp move higher. Basically, they have confirmed their bull market mode, and have only given back their most recent gains, in many cases they still sit higher than they were a month or two ago, even taking into account a 30% drop over the last week to ten days. In my opinion, one can accumulate these names now, with less risk since they have shown they now are ready to go up, if the metals continue higher.
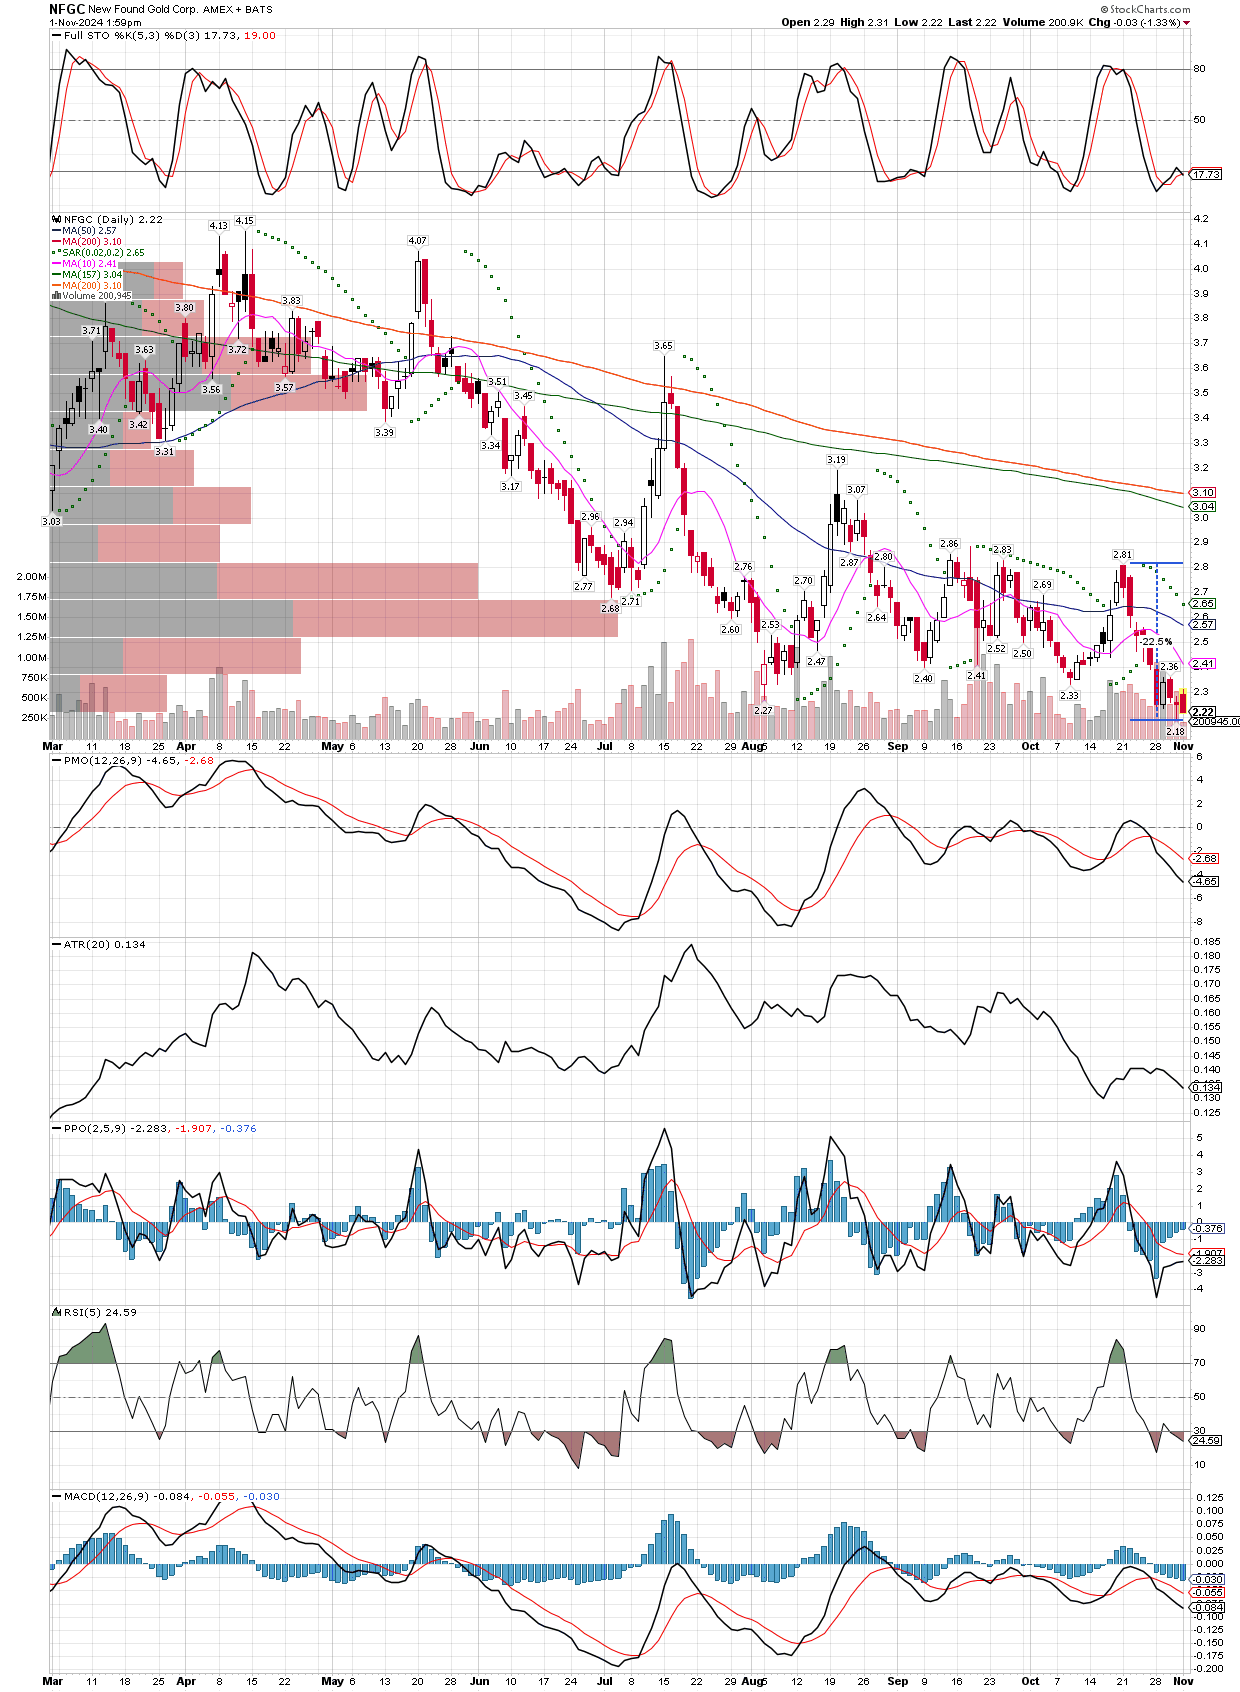
I have posted several charts below, some I already owned and have done great, a few others have spun their wheels, and a couple have dropped from my purchase price, but not enough to be stopped out, which is another sign the bull is intact. In short, I have bought more substantial positions in the names below, and will continue to accumulate until the next leg up in the group begins. I don’t expect that to be too long a wait, by the way. Only one name has not given positive price confirmation, which makes me a bit nervous about Newfound Gold (NFGC), but the fundamentals on this one keep me invested. The fact it is the largest investment ever made by Eric Sprott, and he owns it a prices double of what I paid, also movhelp keep me from getting out until we see a good run. Even though it hasn’t yet established a bull trend, notice that it has had several large percentage gains weeks here and there, that serve to wipe out all the days of little losses that pile up, so I will hang onto this one with a wider stop.
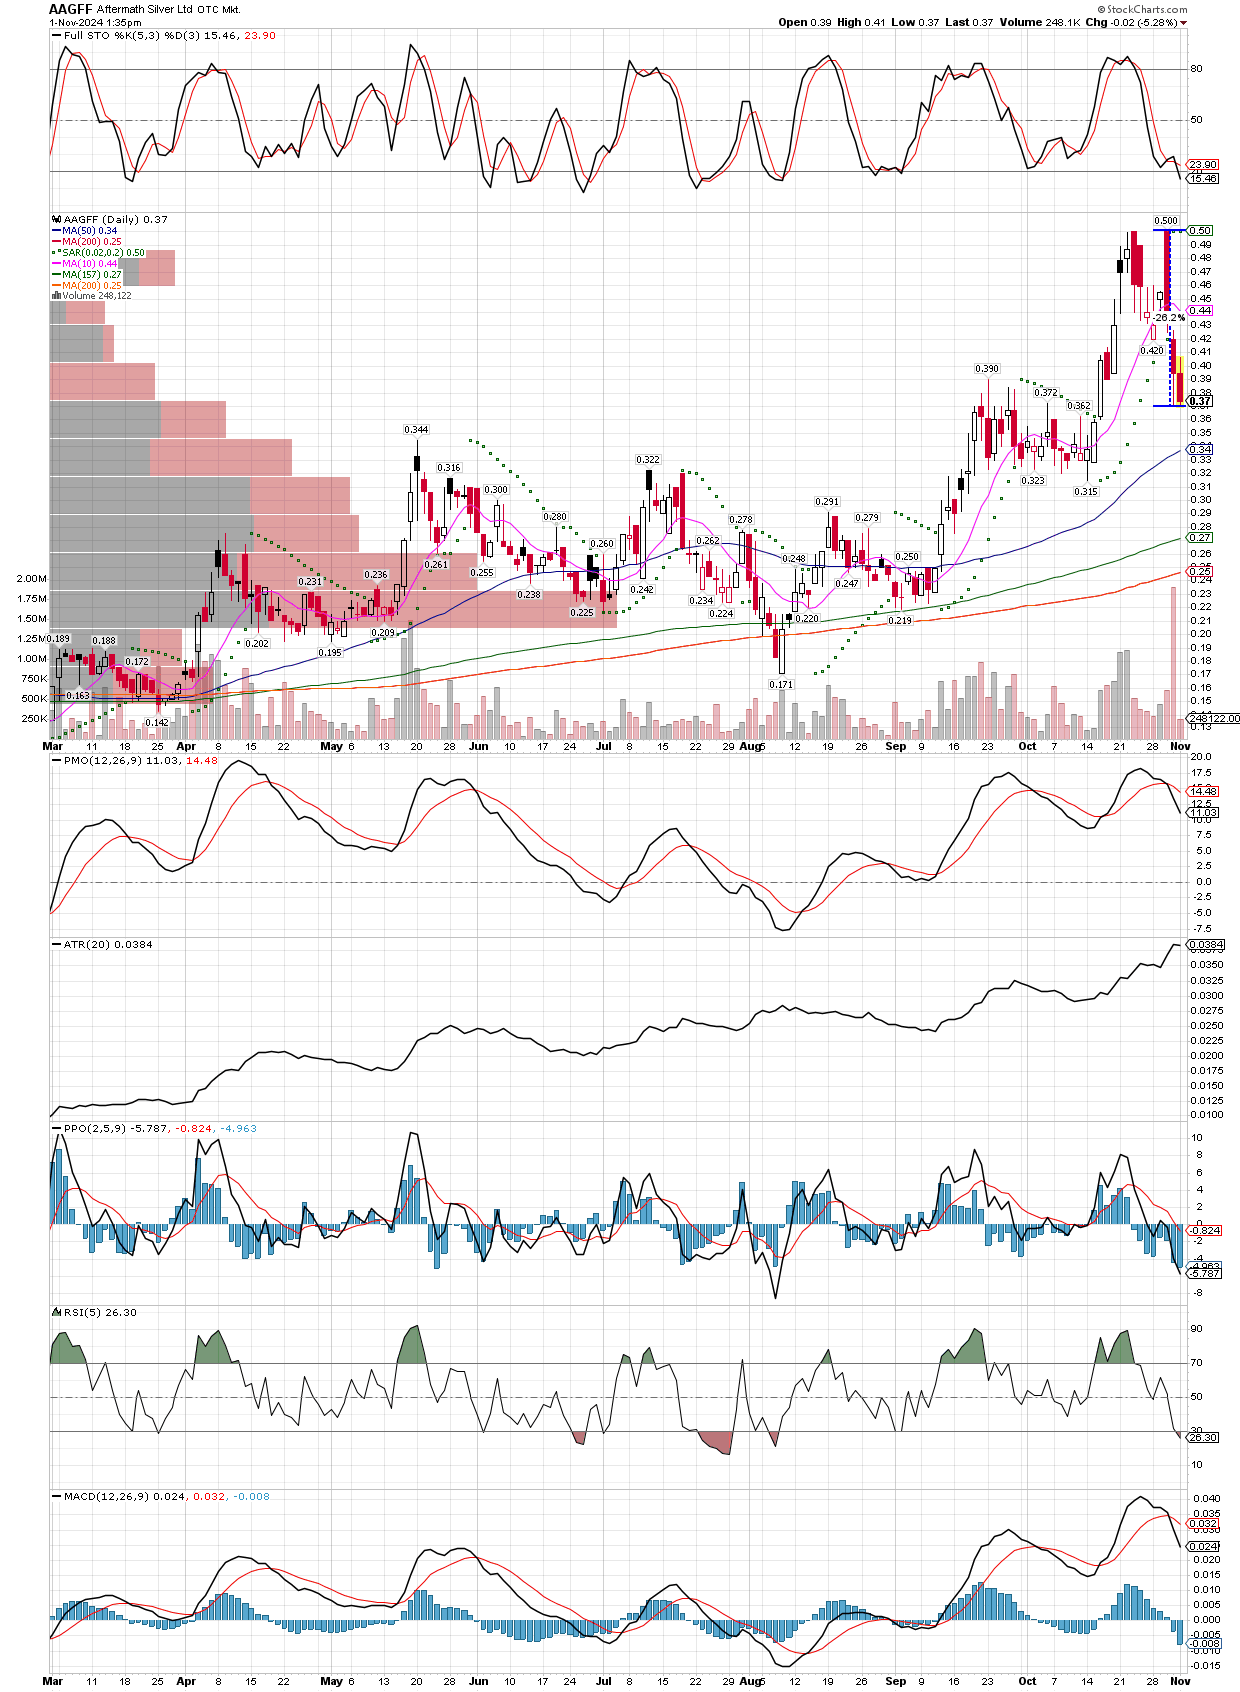
The others are more risky, in my opinion, but have recently shown they can fly fast and furious, when they get the focus of investors. Stocks like Aftermath Silver (AAGFF) are performing very well for me, for example, as we have a cost basis just over 18 cents/share, leaving us up over a double, even after its recent three-day, 26% decline. You get the picture, and just know these juniors have only just begun their bull run, hence my focus on them for new purchases, vs the mid-caps I was focused on before the bull started. I will continue to look to add to the following, and there are others too, about 25 names in total. I also have said that I have not taken profits on the mid-caps yet, either, I still expect them to at least double from current prices in this move, and could easily triple or more, before the bull is over. Keep in mind we are already up 100-200% in several of those mid-cap holding, so the overall gains could be spectacular by the time arises to take profits. The following charts are not in any particular order, I just like to own many of them, so as to reduce company specific risk. No one explorer is more than .5% total risk to our portfolios, and some are much less at just .2% TR.
As mentioned earlier, I have over 20 different junior explorers, most with equal weight total risk to our portfolios. I didn’t have time to post all the charts, but others you might want to look into include, IRVRF, DOLLF, WRLGF, FFMGF, ELRRF, and ANPMF. Most show similar charts, along washed out bottoming process, then sideways to slight trend higher, followed by a recent spike breakout, that is now a sharp pullback to buy or add to positions. The juniors are the last to fly in a bull, but they also make the largest percentage gains overall, just beware the risk they pose, and make proper-sized bets. The majority of ones pone’s portfolio should still be invested in the mid-cap arena, in my opinion, and I have my money where my mouth is.
While its natural to fear a correction after a big move higher, we can let the charts tell us what to expect. Lately, silver and the precious metals miners have held very strong, after making some great gains this year. From late February until May, they basically went straight up. Then as they corrected, they formed a trading range for nearly four months until just recently poking into new highs for this bull, before being pushed lower again, back into the trading range. However, gold, silver and the miners have tipped their hand with that small breakout to new highs, especially gold which kept moving higher after its breakout. Furthermore, one just has to observe the trend of the moving averages, to see that the group is ramping up for another leg higher. The 50 and 200 day MA’s are not just trending higher, they are accelerating and spreading apart. This is a very strong signal we get more upside out of this move before any substantial correction takes place. I might decide to take some profits into this move higher, but its too early to say right now, and far too early to sell right now. So, we stay long and strong.
In addition to the very healthy-looking charts, we have several catalysts to drive the bull higher. Next week we see Putin lead a BRICs meeting, where alternatives to the US dollar as a reserve currency will surely be discussed. We have the US election in early November, and conflicts flaring up all over the place. Then we will get to the miners’ earnings season, where I expect we will see the best reports in a long time, maybe the best ever reported. In short, I keep our accounts comfortably invested in the precious metals area, as we wait for other groups to present opportunities, which I will discuss in my next posts. For now, note the moving averages on each of these charts, as well as where the price sits, currently perched up near the highs. To me, they are itching to make another big run higher.
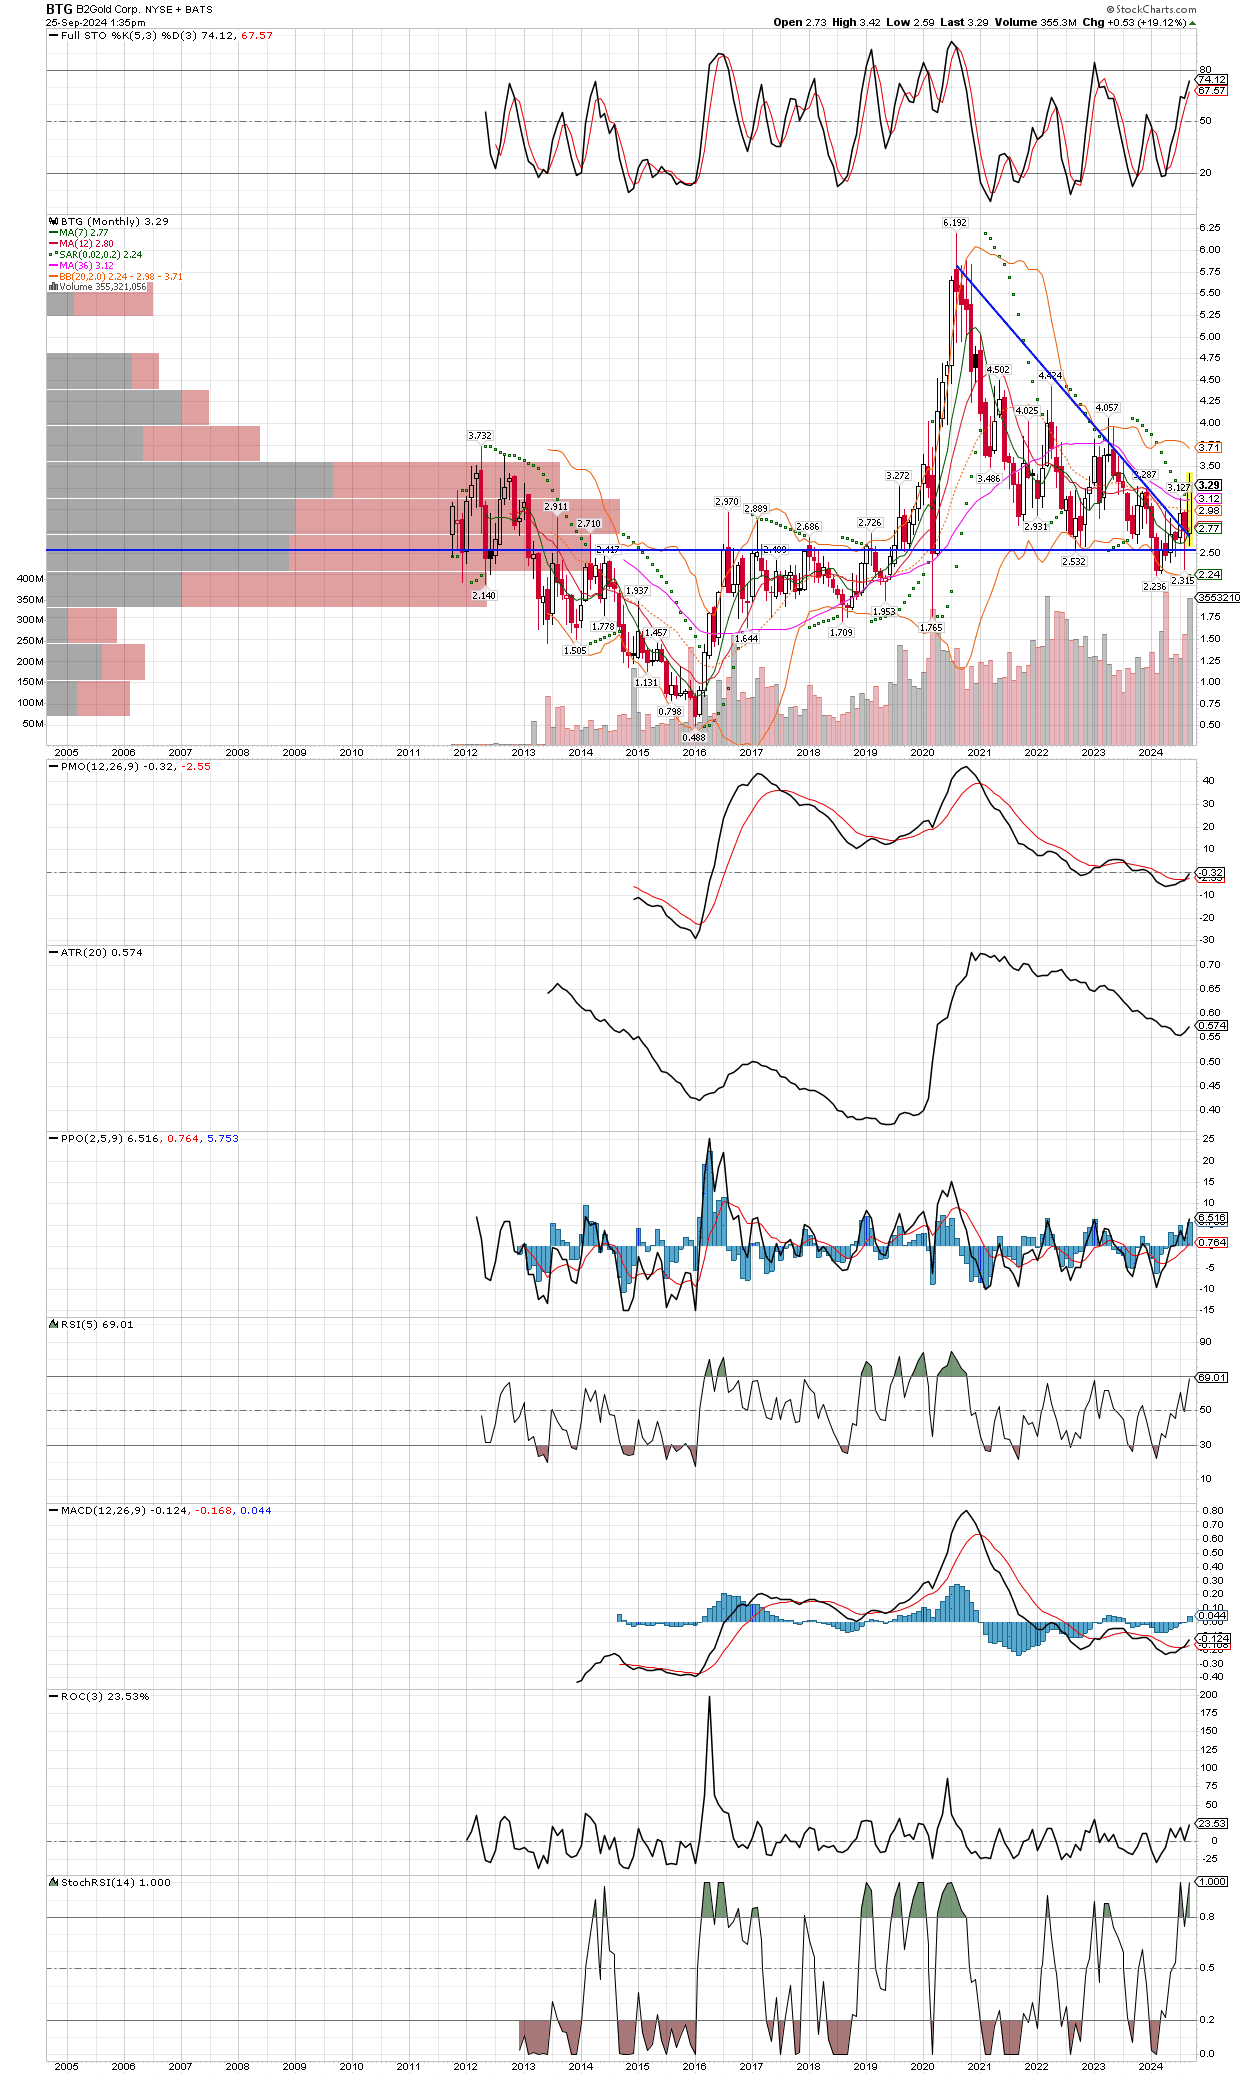
While I take most technical analysis with a grain of salt, especially my loosely drawn trend lines, I still find them useful to define areas of support and resistance. They are not lines in the sand, since they are quite subjective, people see what we want to see. But besides showing us general areas to watch, technicals can also tell us when big changes have occurred, especially when they occur on longer term charts, such as this monthly chart of BTG. From our entry price, its paying us a 6% dividend while we wait for price appreciation in this gold miner. The lines I’ve drawn were just thrown up quickly, but they show an area of long term support which has held, and now a sharp rebound that takes out the down trend line, indicating a change of direction longer term. Also note the MACD just turning positive, along withe the PPO crossing higher near the zero line, both signals that this stock wants to go higher for quite awhile. Buy on dips, and remember the time frame of the chart that gets you into a trade, this chart tells us to size properly for a multi-month hold at a minimum, likely much longer.
I have been quiet lately, patiently observing the action in markets. I make it a point not to interrupt the process of traders shoveling money into our accounts as fast as possible. In fact, I often turn off the computers and go do something else for awhile, so I don’t get sucked into making calls day to day, or worse, convinced to sell to early. Today, I just wanted to re-visit the GDXJ monthly chart I posted back on April 14 of this year, not quite six months ago. It has clearly broken out of the triangle and is headed to the $63 area as a next potential rest stop, then onto new all-time highs up at $137. I know its hard to buy after such a sharp move higher, but if one isn’t invested in the precious metals and miners yet, there is still lots of upside to catch. Personally, I don’t like to chase moves higher because more often than not they will reverse. But the times prices keep marching higher are life-changing events, as compounding really starts to kick in!
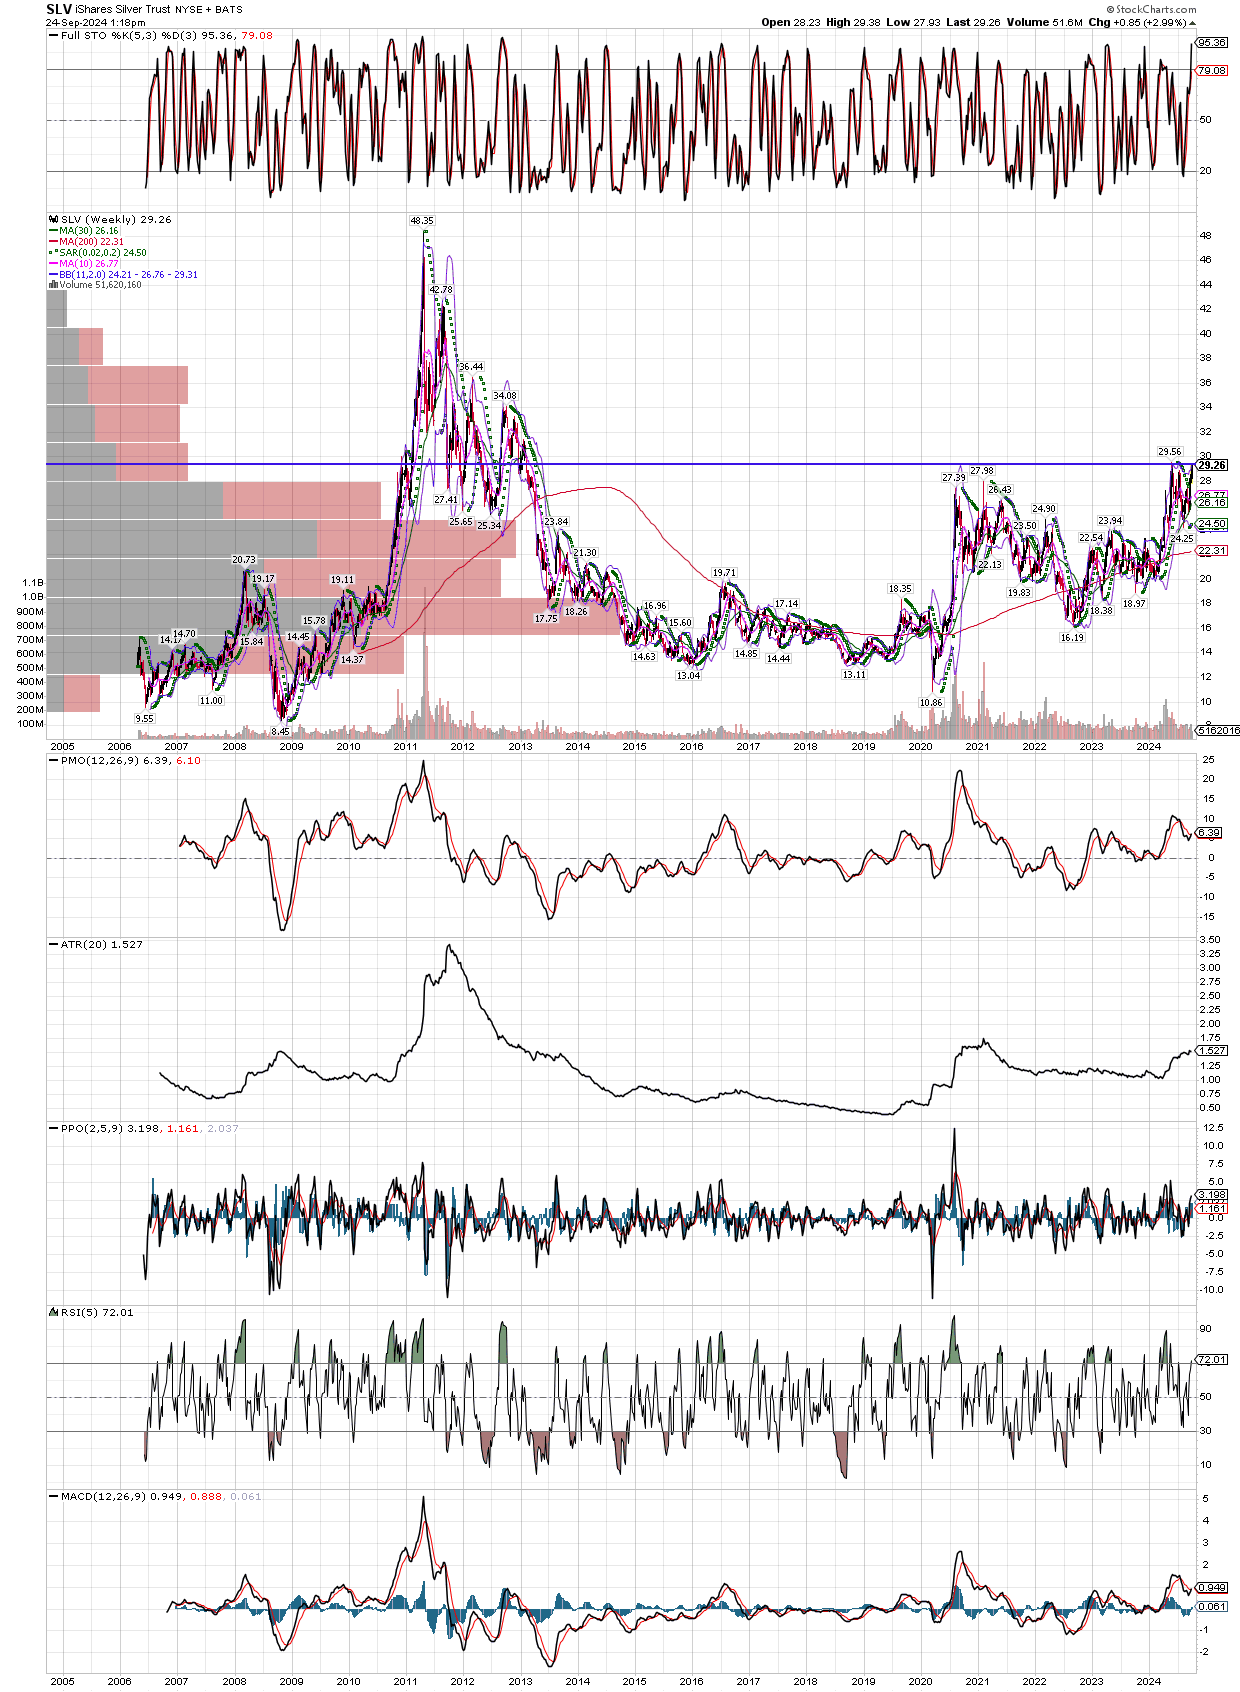
I also want to point out that silver (using the SLV etf here), is very close to making new 11 year highs. About 20 cents more and it will be there. Silver is still a huge opportunity, it has yet to make new all time highs over $50/oz. Just reaching that level, which seems a given, is a 56% gain from where it sits today, and I expect it will blow by $50 with ease, could even get to $100/oz in the next year. I am not predicting such drastic gains in such a short time, but the point is that silver is going there sooner or later, and the fact this metal can move like a rocket when it gets going, implies the gains will come quickly once it starts. Don’t miss it, buy physical metal first, then miners for investment funds, and stay away from “paper” silver like this SLV etf altogether. If you have to buy silver in a brokerage account, then stick with something like PSLV, where they update ve with serial numbers on a regular basis. I am focused heavily on the miners at this point, and expect them to outperform by a huge margin.