May 3, 2019
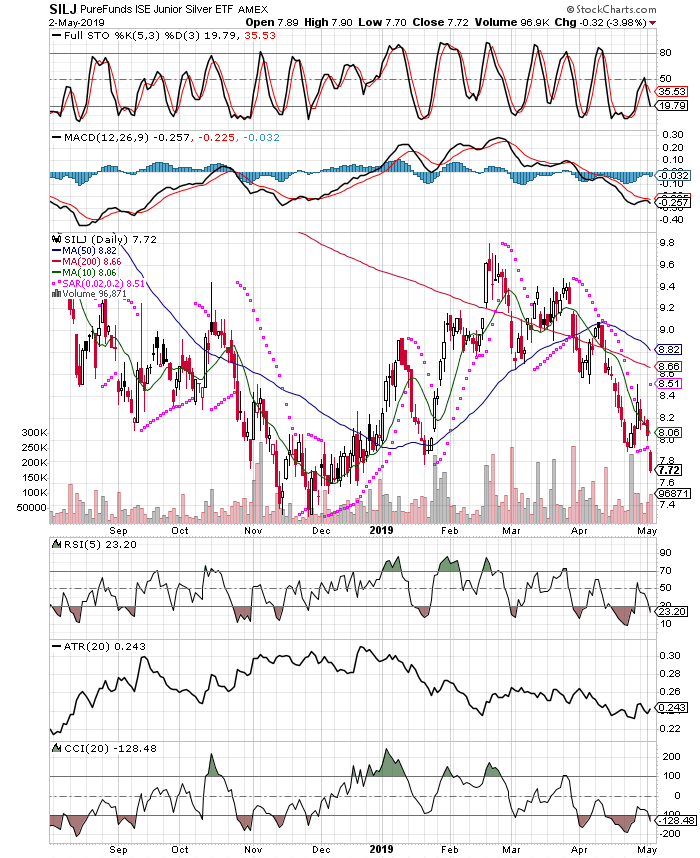
In my first post to the site, I mentioned getting long the silver miner etf SILJ. Since that time the price has dropped and I have continued to add, in order to get up to a full position and on slight margin now, with my intent to get even larger position size on further margin. Right now I am 115% invested, and that also includes starting to buy the GDXJ junior mining etf into this decline.
Eventually I would like to have a page on the site with statement snapshots updated daily, so subscribers can see exactly how I am executing my trades according to plans.
So as it stands, the accounts I manage for viewers here are currently taking a drawdown, with an average price of just under $8.46 for SILJ, and $28.76 for GDXJ. Drawdowns are a part of trading, and one cannot let them undermine our emotions. Perhaps it was best to open this site with a trade that thus far isn’t working, rather than to give traders a false sense that everything always works out, straight from the gate. It’s part of the game, and I remain focused on the plan, not the P+L. I will continue to add into pullbacks, on these etfs as they are still in uptrends that started late in 2018. I managed to buy a good chunk yesterday, for those that wish to check the accounts in the subscriber section. This trade was a great way to start the new site, an entry is rarely more difficult or trying than this trade, so lets see how we make it work for us, despite appearing a lost cause.


