August 5, 2019
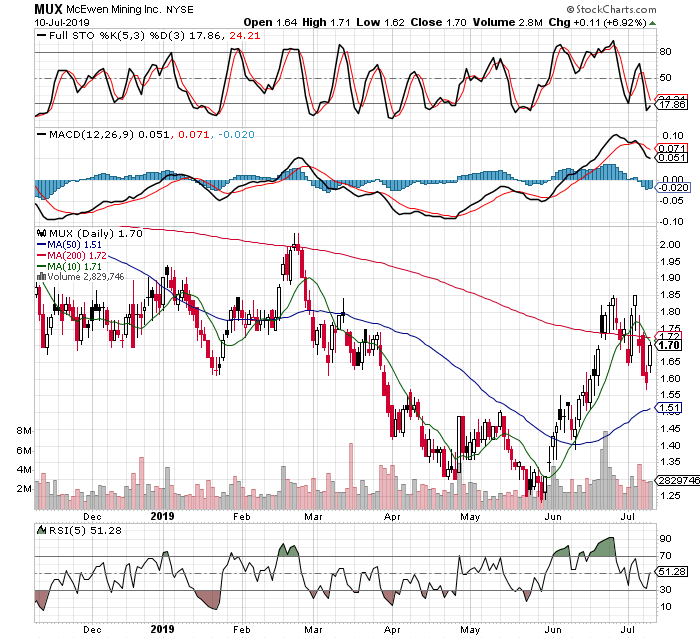
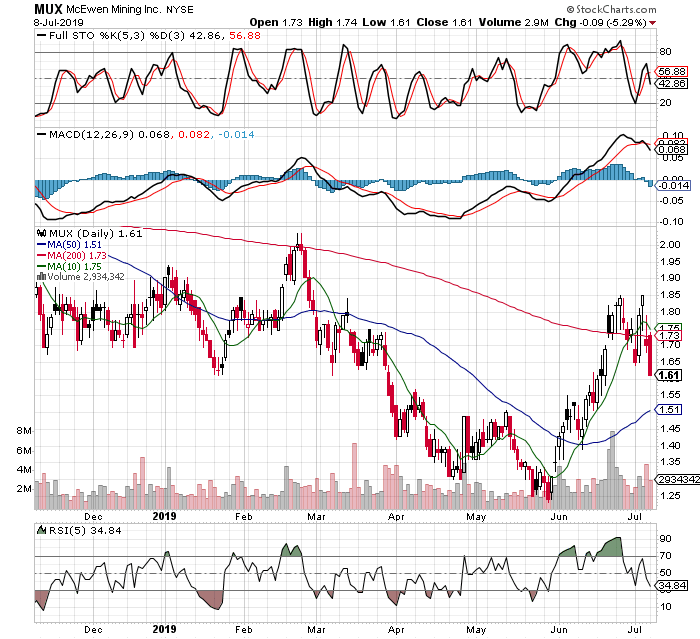
I haven’t sold anything yet, I don’t like to sell just because we’ve had a nice rally or other thoughts creep into my head that are hard to gauge. For example, we all agree 20% in a month is a great return, and not typical, so its easy to rationalize booking such a gain. However, if one took the first 20% they made in 2016, they would have felt good for about a week at most, then been kicking themselves the next 7 months. No doubt that was an outlier, but all monster markets are outliers, and they also happen to be where the big money is made so I try to stay on the ride until whatever signals got me into the trade are now telling me to exit. I will admit there are many times this method has me riding a modest gain back to nothing or even a small loss, but this way also keeps me in for the big ones that come along every now and then. I believe it is these big bulls that make all the difference over time. I am in no way a permabull though many will think that bc they choose to sell earlier vs press for more. One nice thing about this approach is days like last week’s FOMC and the day after where the volatility seems unbearable, I was nowhere close to getting a sell signal for the same things I used to get into the trade, so by definition I had to stay in the trade, which we now know with hindsight was a good thing. In fact I added small amounts here and there when the selling brought several of my positions down to levels I had wanted to add before anyway, I only wish I had placed bigger orders since they ripped higher so soon after, but those trades are just fun while really being negligible to the results overall. So I remain heavily long on margin, haven’t done anything but buy to add here and there small amounts to current positions. My indicators are nothing special, everybody uses the same ones or even better ones, the only difference I see is I refuse to cash out for any other reason than those same indicators telling me to do so. I might get bashed pretty hard again in this bull, probably and maybe soon, but it I don’t get the sell signal then I remain confident there will be higher prices in the future, and at a minimum, and the bull will let me out at better prices than if I sell into weakness in an overall bull market. That is the only way to lose money in a bull. The swings are huge both ways in P+L, and often all I have to hang my hat on is that I am being disciplined because it looks like a reversal, or bad news, or whatever new information comes out, so it can be uncomfortable at times, but its given me the best results over time.
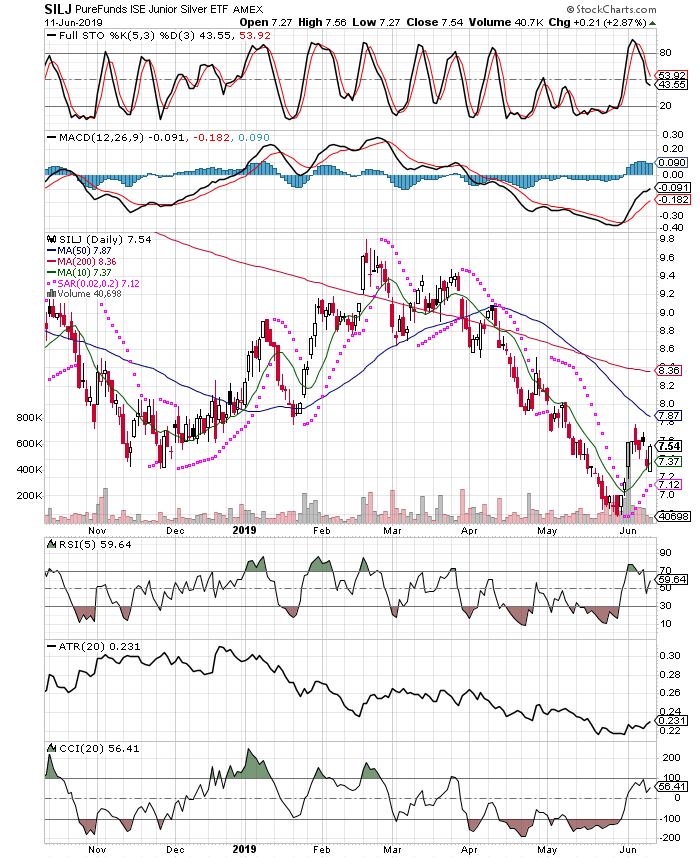
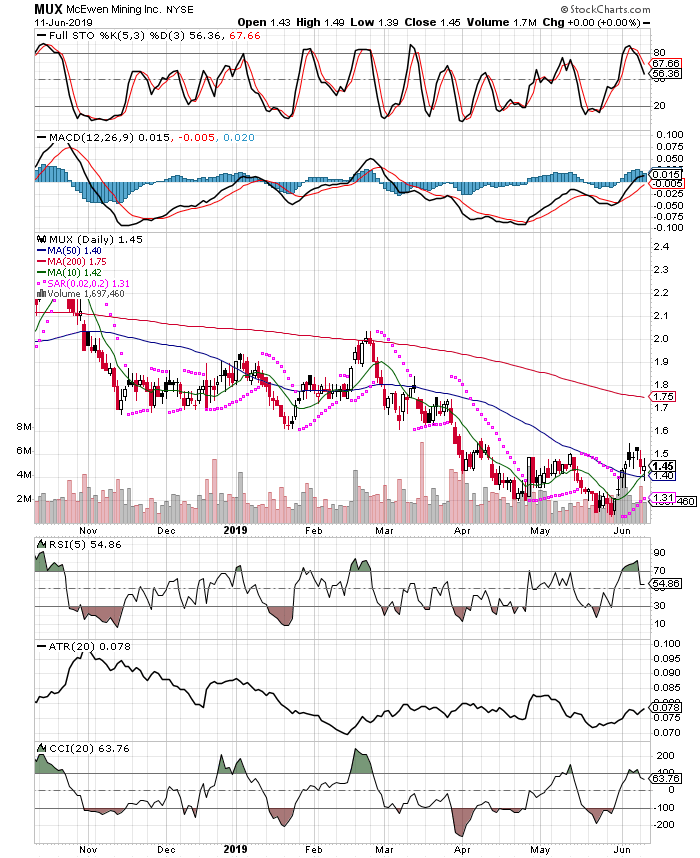
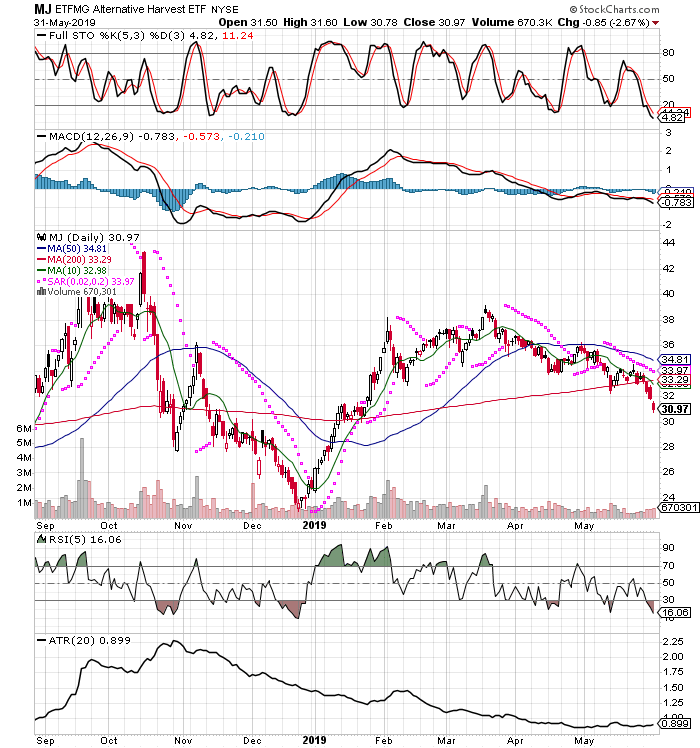
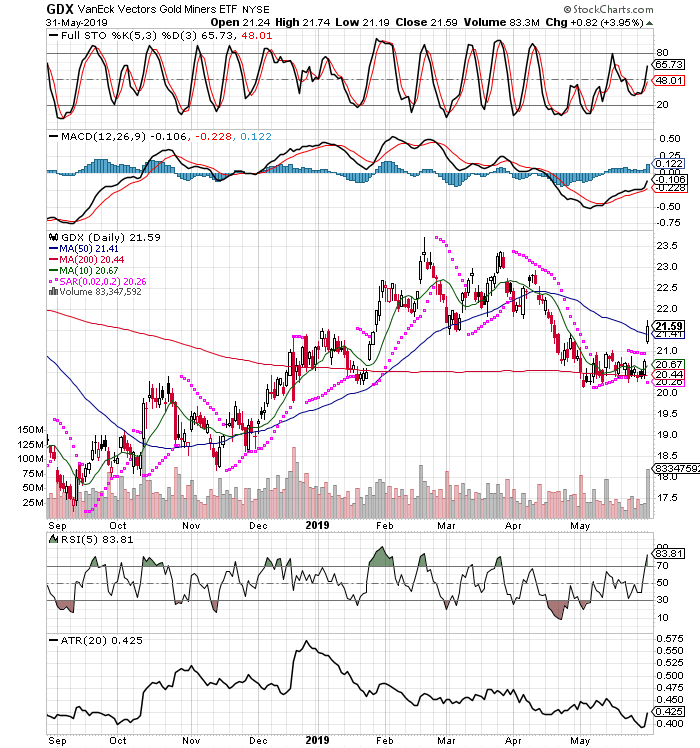
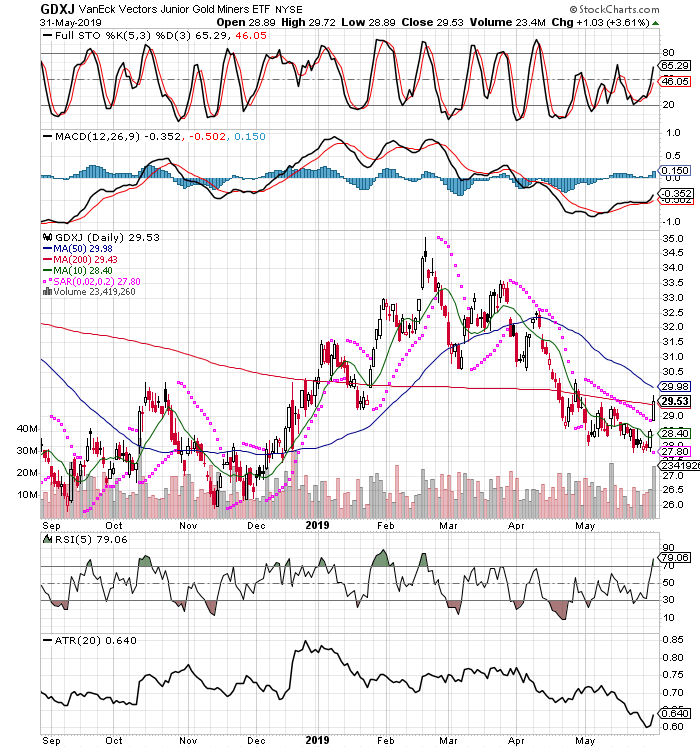
This was just a quick post to catch up, and say I will be posting more frequently as the volatility tones down. There have been many things to write about, the FOMC’s first interest rate cut in 11 years, the spike lower in miners which I did some buying, adding to current holdings with some “stink bids”, shake-outs I have managed to avoid, etc. I intend to post very soon after I make changes in my accounts, or see other ideas setting up, but the writing game is new to me, and to be honest, not my favorite thing in the world. I love investing and trading successfully more than any other endeavor, but will do my best to make posting here a habit. Look for more material this week, I have several topics to cover as well as some potential trades setting up, as we are now seeing the general stock market show weakness for the first time since late 2018. Also, because so many people tell us how great they did, after the fact, offering no proof of their success, I plan to post my account statements on this site so that anybody can easily verify the moves I’ve made and the results they have yielded. I am not yet sure how I want to do this because I really do cherish my privacy, its one big reason I chose this career, success does not have to bring fame, which I like since I want nothing to do with fame. In fact, I have debated using my real name here, or not, and think it is unnecessary, if I am posting actual brokerage statements from an account or two that I manage for friends and family. Keep in mind, as I have stated in earlier posts, I am no longer a registered investment advisor so these reports would be from accounts of friends, family, or possibly my own, after I block out the names for privacy. Another idea is to keep the statements aside in my possession, and only email them to people that are serious enough to take the time and write an email to me requesting them, rather than let them out there for every clown in the world to do what they want with them. I will let you know when I decide, but rest assured that what I say here is what I do, and I will never lie or distort the truth. Dealing in numbers makes that easy, they don’t lie! It amazes me how many advisors with self-proclaimed awesome returns, never have any proof whatsoever. How could anybody know if they were real or not? This is why I feel it’s necessary not just to tell readers or post spreadsheets they have made themselves, but to show them actual statements from their brokers. Stay tuned!