July 21, 2021
While I normally prefer to add to winners on a pullback, I also like to add to a position I like but that I am down on, especially once it starts showing strength, as the mining sector is doing today. It is more risky than adding to a winning position that has already has a cushion to buffer any downside, but also can give great entry prices or lower our average cost from earlier purchases, assuming the trade is still a good one and will work out. As I type, I am still not up to a full risk position in GDXJ LEAPS but I’m getting close, might even get there before the close of trading today. Members can get all the details in the Stops and Daily Account Screenshots tabs above, but they also receive real-time trade alerts whenever I make a move in the markets, as well as adjustments to stops levels, unrealized P+L, etc.
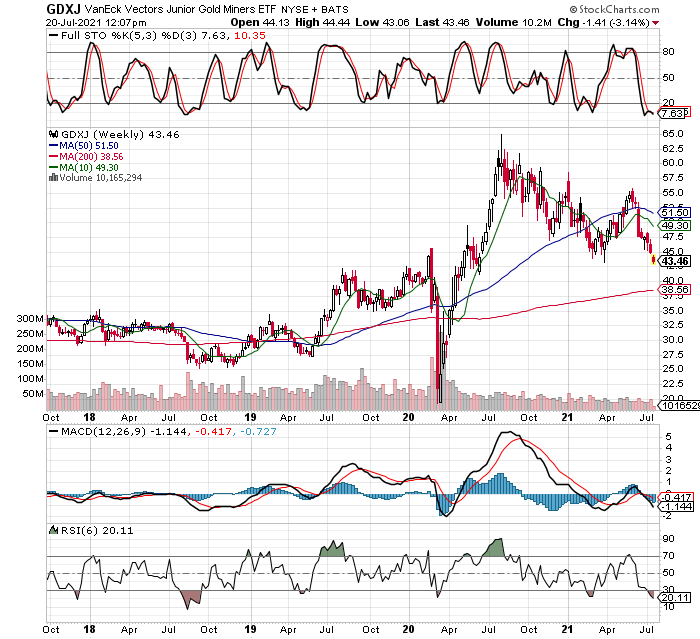
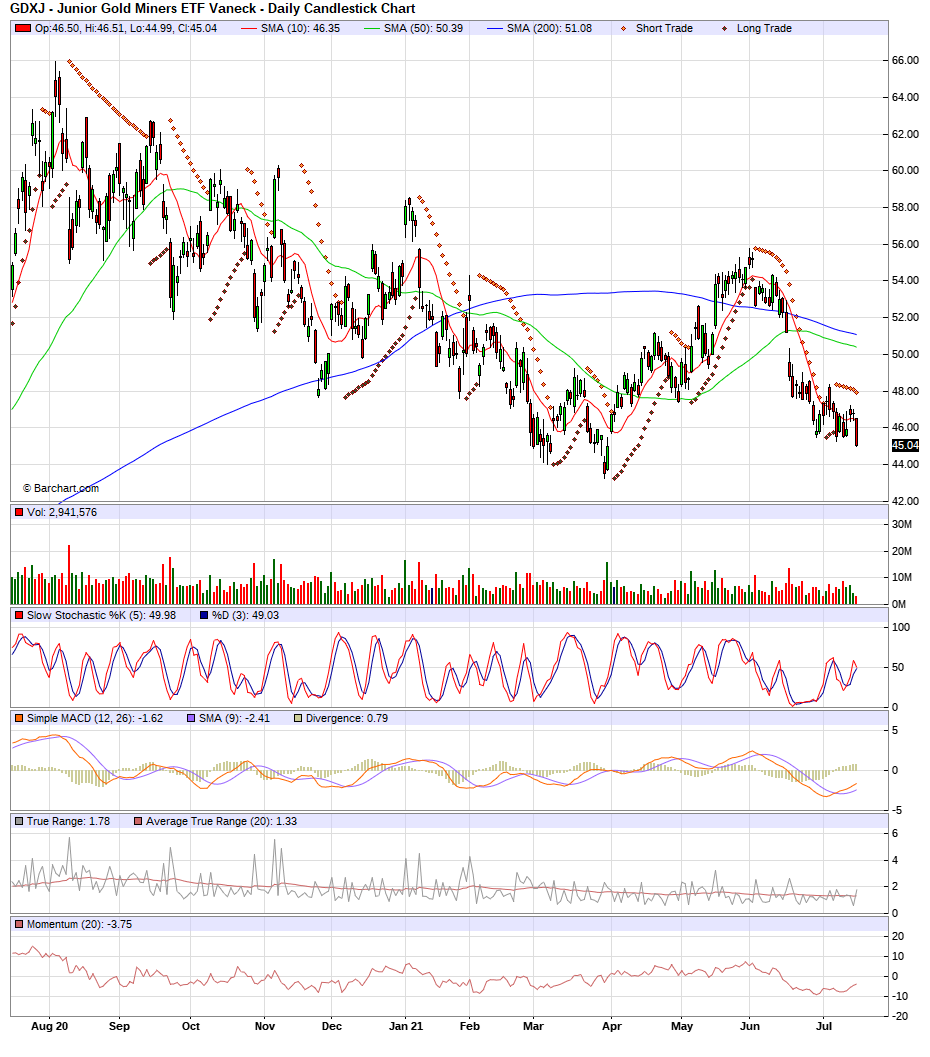
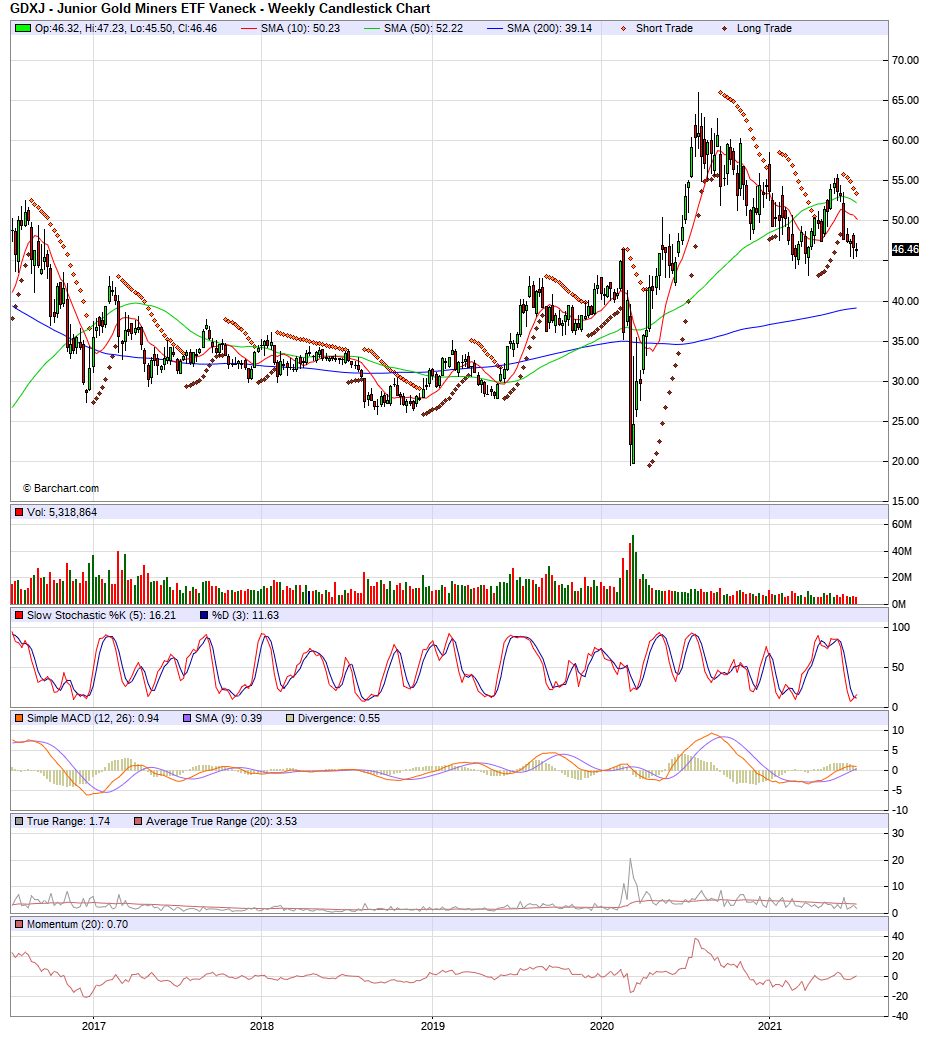
The other day I posted the WEEKLY GDXJ chart, here I will post the daily chart. Warning: It sure looks ugly, the moving averages are in a death cross and headed lower, the stock price in at the lows, what else could be wrong?! LOL While I enjoy being in a firm uptrend, with momentum at my back, I have also learned that things often look their worst right before they turn great again. Recall my GDXJ buy the other day when I posted the WEEKLY chart, that told a different story, showing well oversold stochastics and the stock near potential support, and since this is a trade with a WEEKLY hold time expectation of 6-10 weeks, I can live with an ugly daily chart. Let’s see if we can hold this one through to see it transform into a winner. If it can, these are the biggest profit potential trades of all, riding something from the trash dump all the way to the pinnacle of every portfolio! 🙂 In any case, I will be taking profits when we get to overbought stochastics on the WEEKLY chart, whether I am up or down on the position. Members get updated stop prices, and overall position sizes and unrealized P+L numbers with their subscription, something I not only think is the most important aspect of trading, but little or no newsletter writers provide. I don’t understand this, as its the single most important aspect of successful trading, just picking a name to buy and sell in the most basic step, and not nearly as important as how much we buy, if and when we stop out, as well as when we sell for profits. GDXJ daily chart:

I’m not far from getting to a full-risk position, keep up with the position sizes and stops in the member’s section.
After the close update: I was filled on a buy order to add to my NOVRF position just before the close. I have to report this buy as an “adding to a losing position”, as I’m down slightly on this stock so far. Being that copper stocks are turning higher like many commodity stocks today, I don’t expect my Nova Royalty Corp to be a loser for long. For those that want immediate updates and alerts, becoming a member gives them not only real-time trade alerts, but also a real, daily screenshot of the account I am managing for this site (it’s a real account, real money, real time), including total position sizes, average prices paid for positions, buying power, margin amounts, etc. All of the most important details are available to subscribers, and I’m very sure the information is well worth the cost of membership. I don’t know of any service out there that lays the actual and true numbers all out there for their subscribers, instead all I have seen is a constant barrage of buy recommendations, with very little regard to the position sizing and stop placement. These are the most important aspects of a trader’s plan, and ultimately they determine our results, what we decide to buy and sell is secondary to risk control and learning to push winners for all they want to give. Money management and risk control are far more important than what we choose to trade, it’s that simple.