August 9, 2024
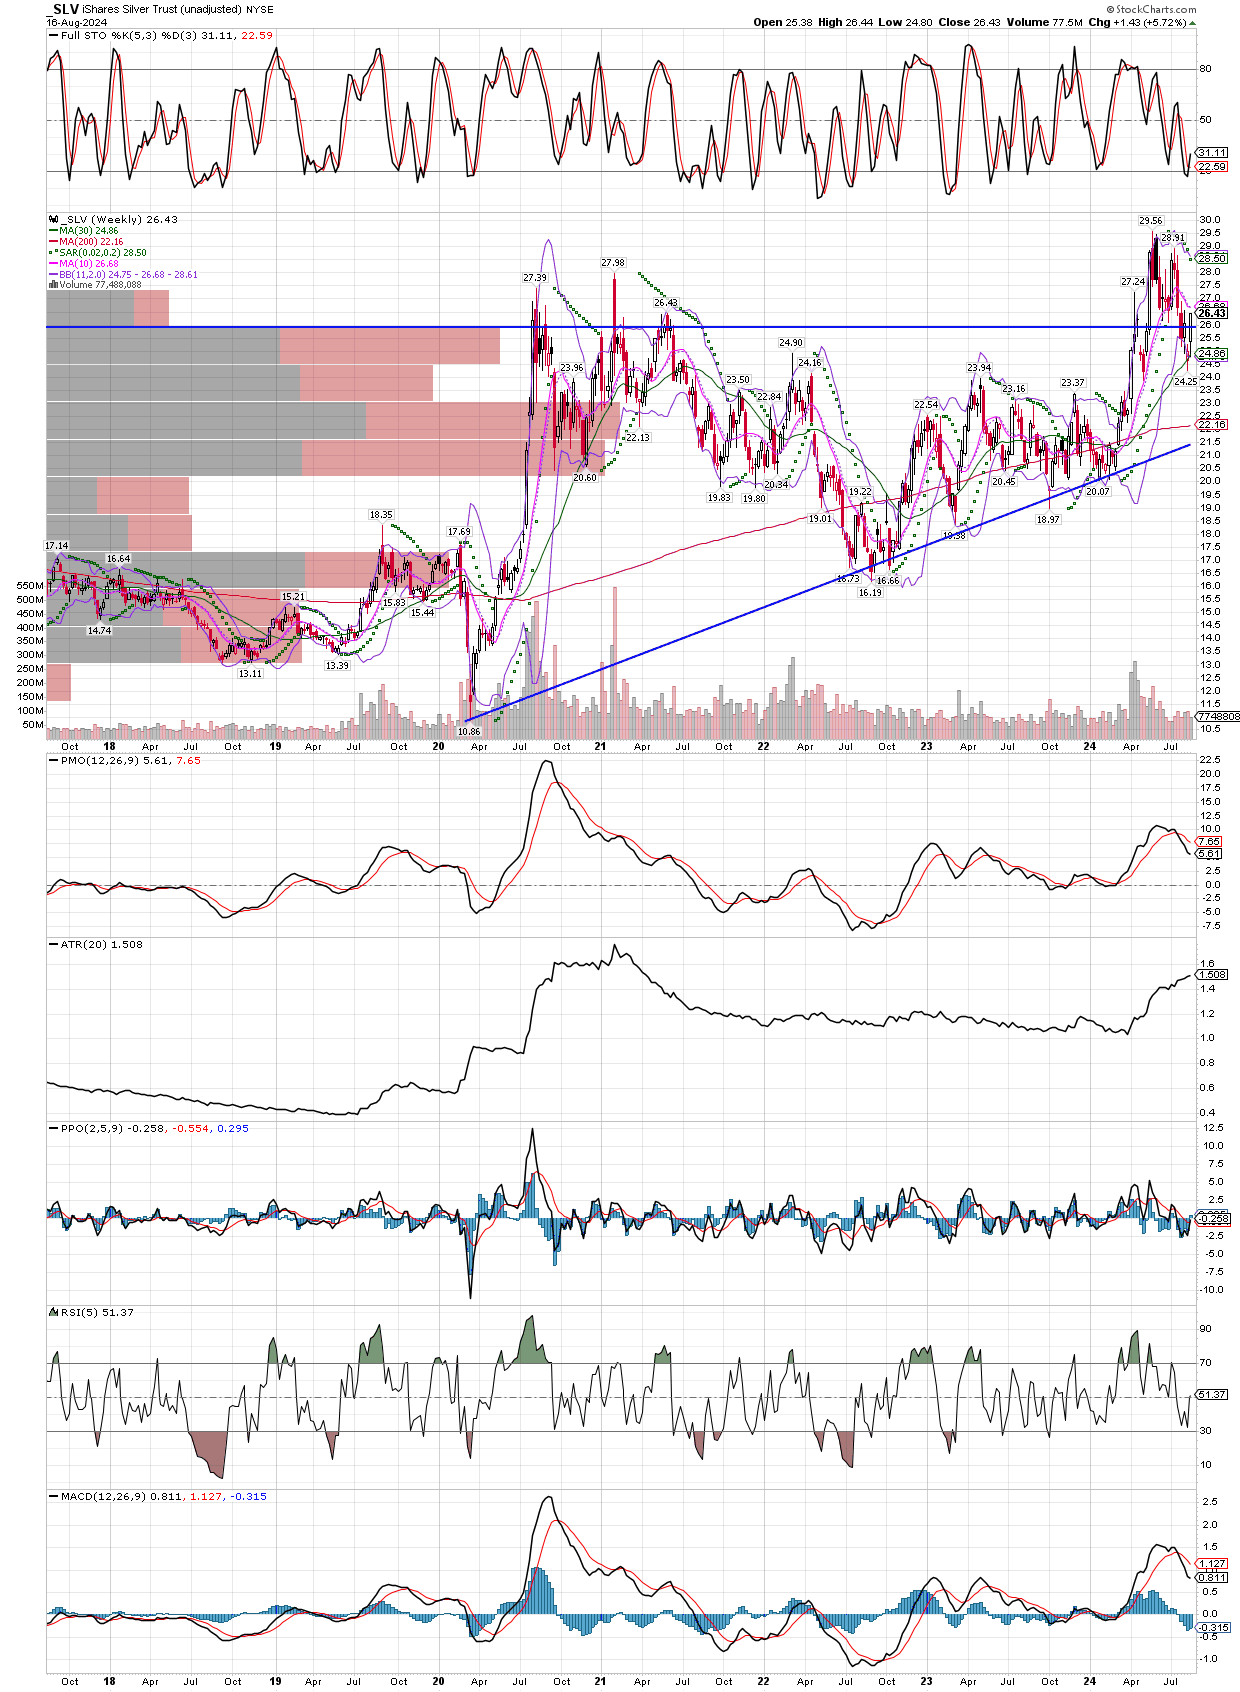
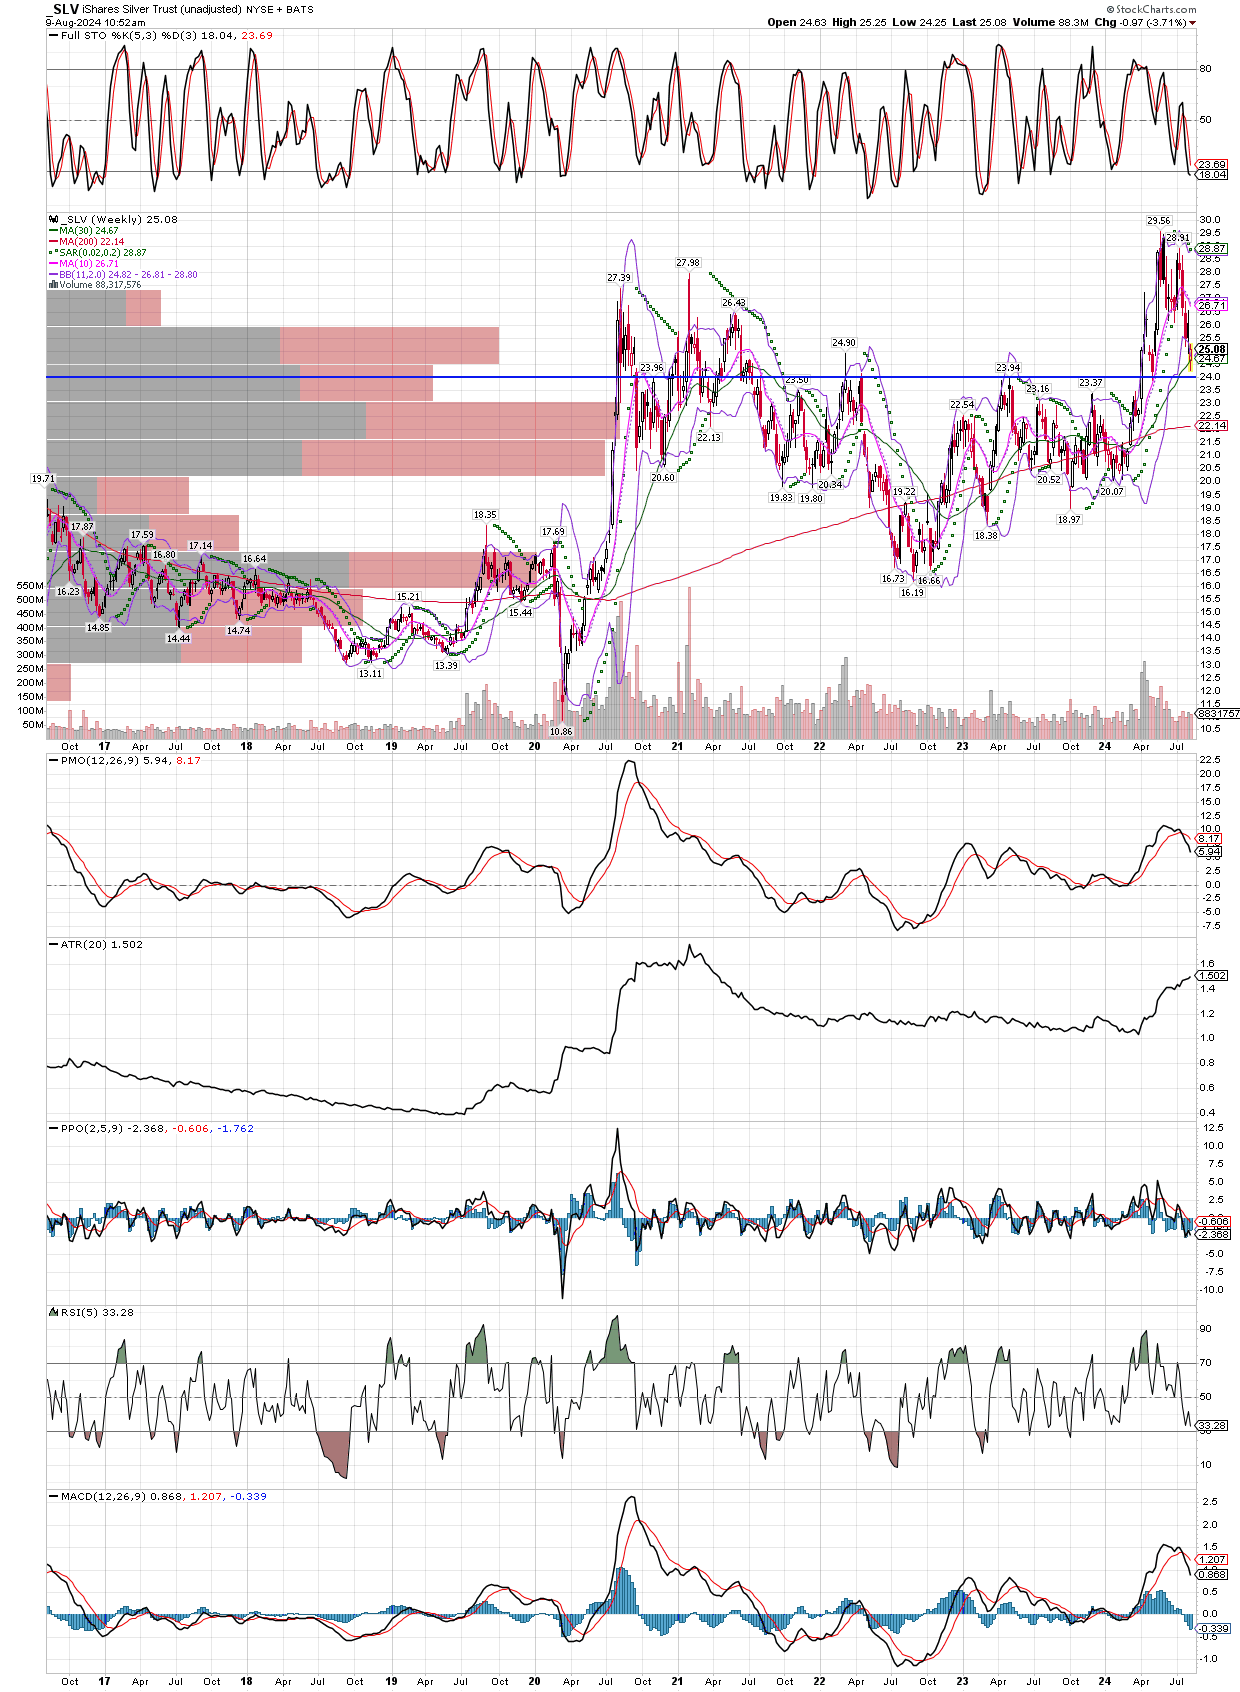
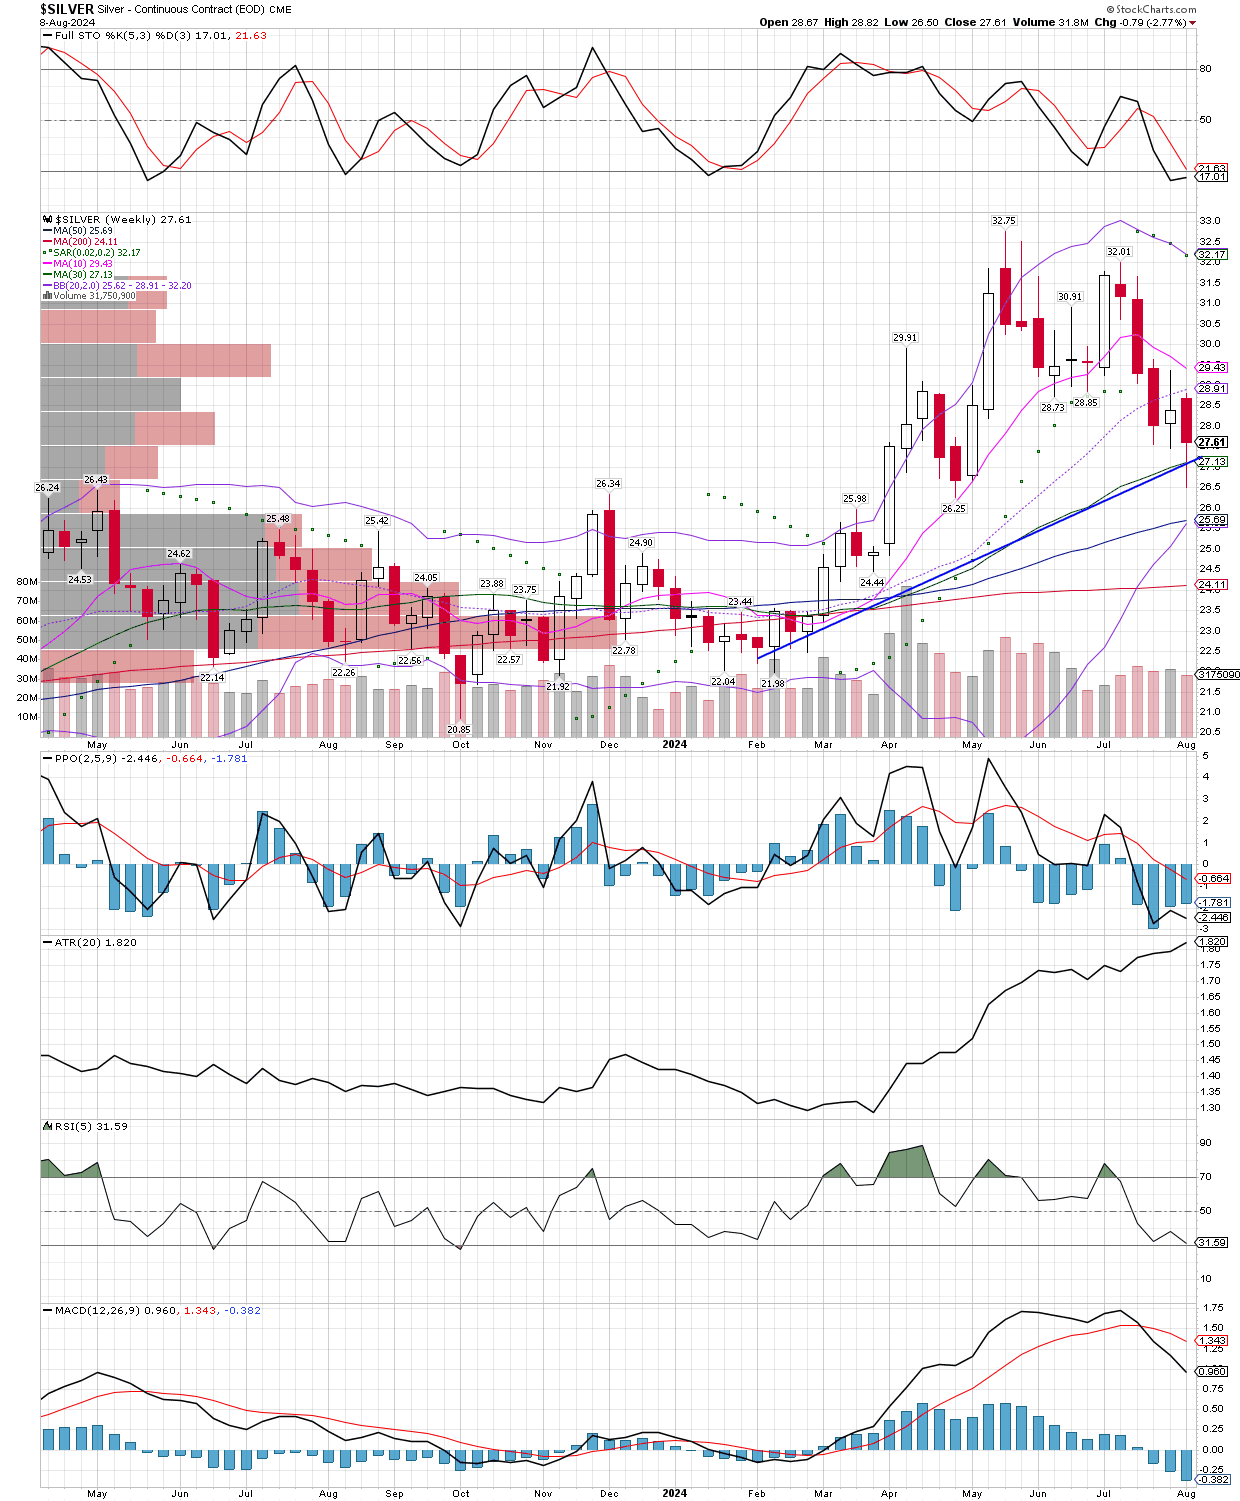
Stepping back to get the bigger picture, this SLV chart goes back 8 years, the horizontal trend line is my doing. While I don’t trade in or out because of trend lines, mostly because I feel they are more loose areas than lines in the sand, I still find them useful to identify areas where something might find support or resistance. Seeing SLV oversold on the weekly stochastics, combined with coming into a range of possible support going back many years (it was past resistance), helps one pull the trigger.
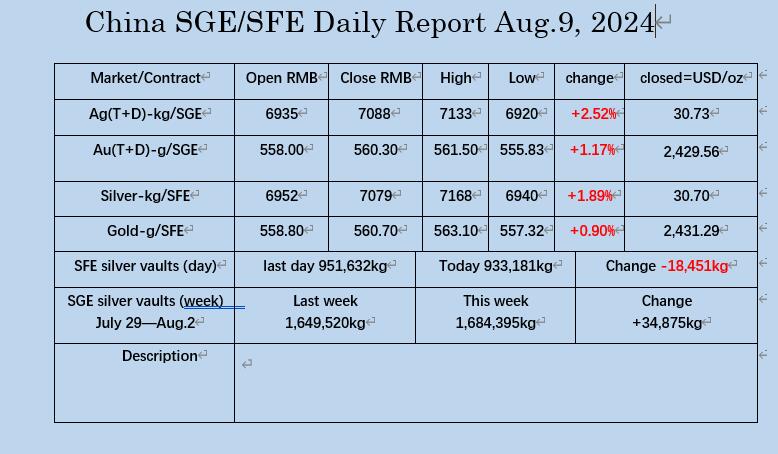
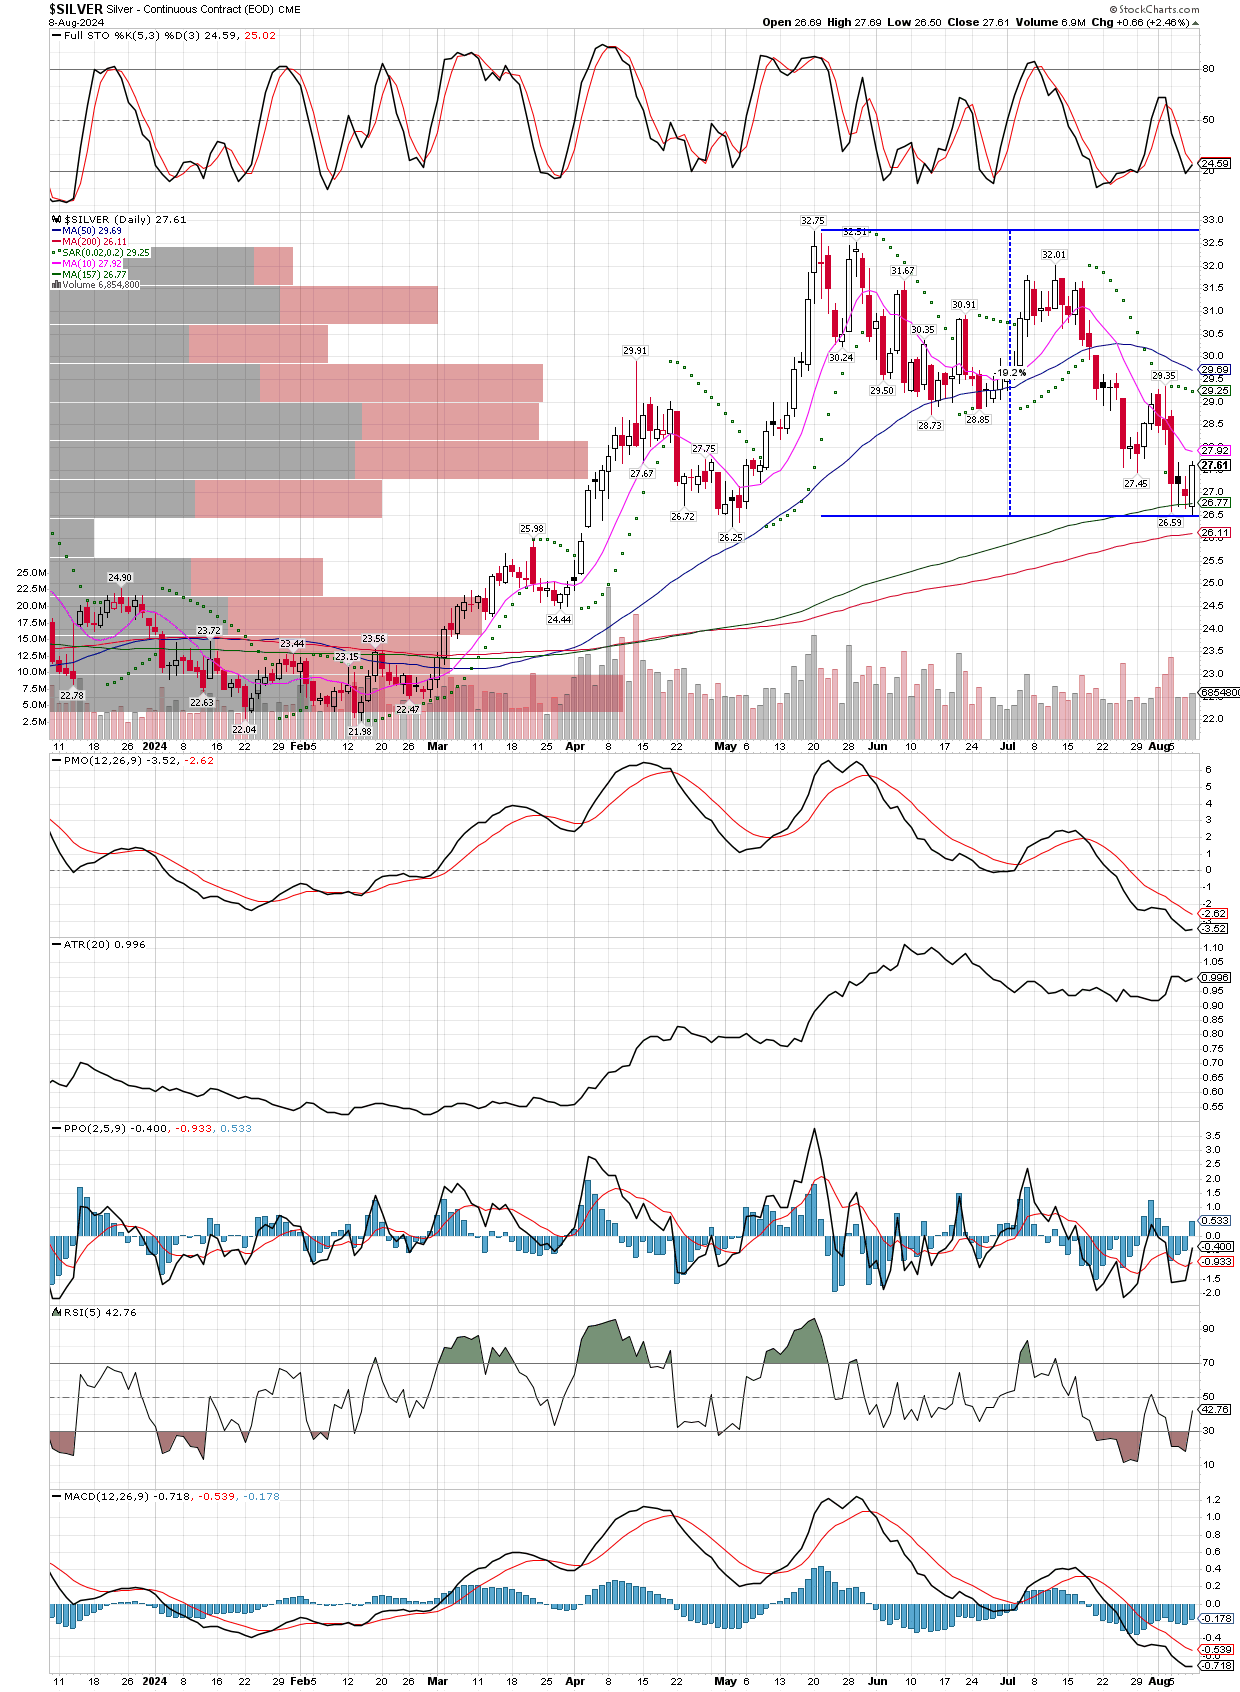
Bought 3 contracts of the. SI futures December expiry at average price of $28.08. However, below I posted the more active September contract. You can see that stochastics on both the daily and weekly charts are oversold, and silver looks to have pulled back into an area of possible support, after a near 20% correction, all good enough reasons for me to buy here. While the weekly shows a further 40 cent dip to the trend line is possible, more so with the metal coming into support at it’s 200 day MA. If we see silver pull back another 40 cents or so, I will use that a an opportunity to add to the position. On a side note, the Chinese continue to buy silver hand over fist, as reported here https://twitter.com/oriental_ghost.
The weekly ATR (average true range) is $1.82, which I will use as a general area to stop out, so the $26.26 area on the December contract. Keep in mind its trading at about a 40 cent premium to the September contract. So if I had bought the September futures, my stop would be about $25.88.
July 11, 2024
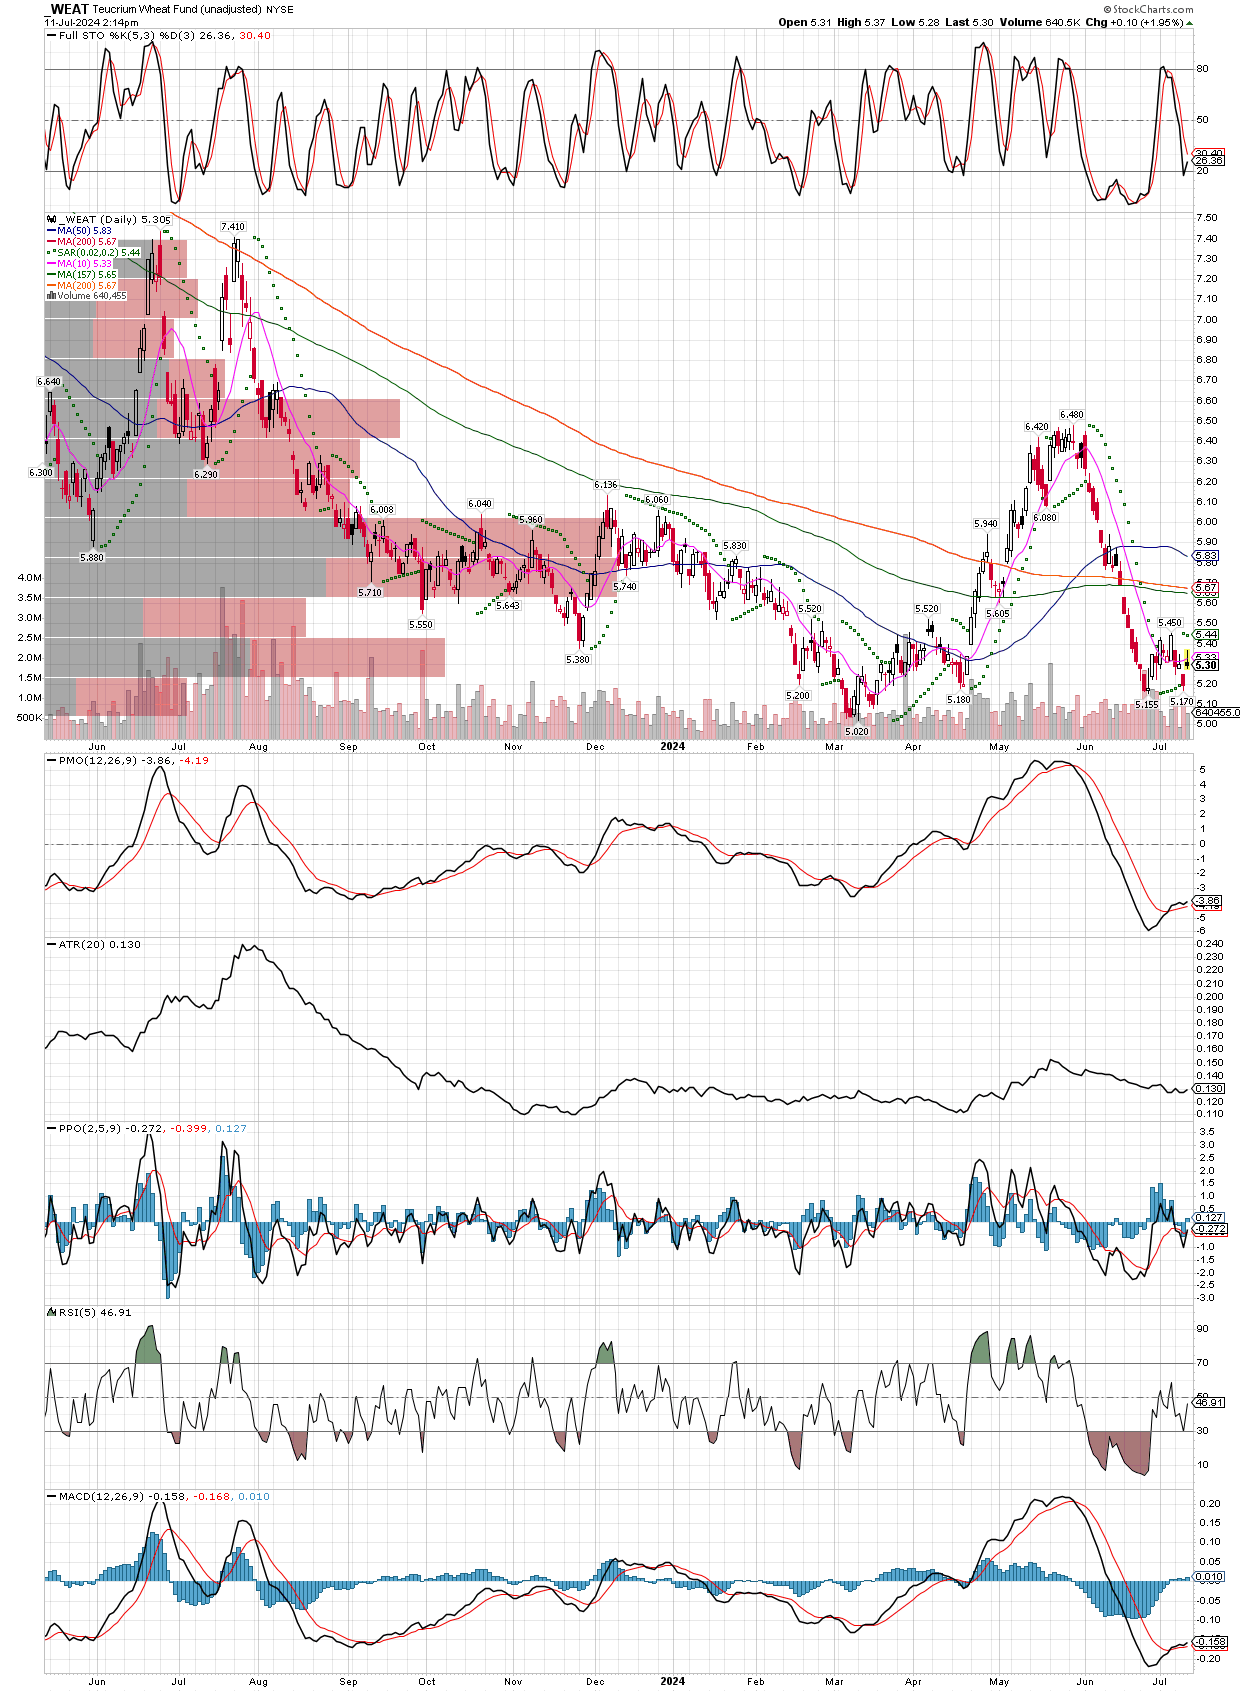
After recently being stopped out of our Wheat futures, I am again trying the long side and have bought today, but this time I have bought LEAP options on the WEAT etf, with an expiry in January 2026. I might also add the futures again, if I get traction and decide to add to my position. Both my Wheat and recent nickel miner purchases have very limited total risk to our portfolios, my main focus and heavy bet is still on the precious metals and miners at the moment. That is where I see the bull market action already in motion.
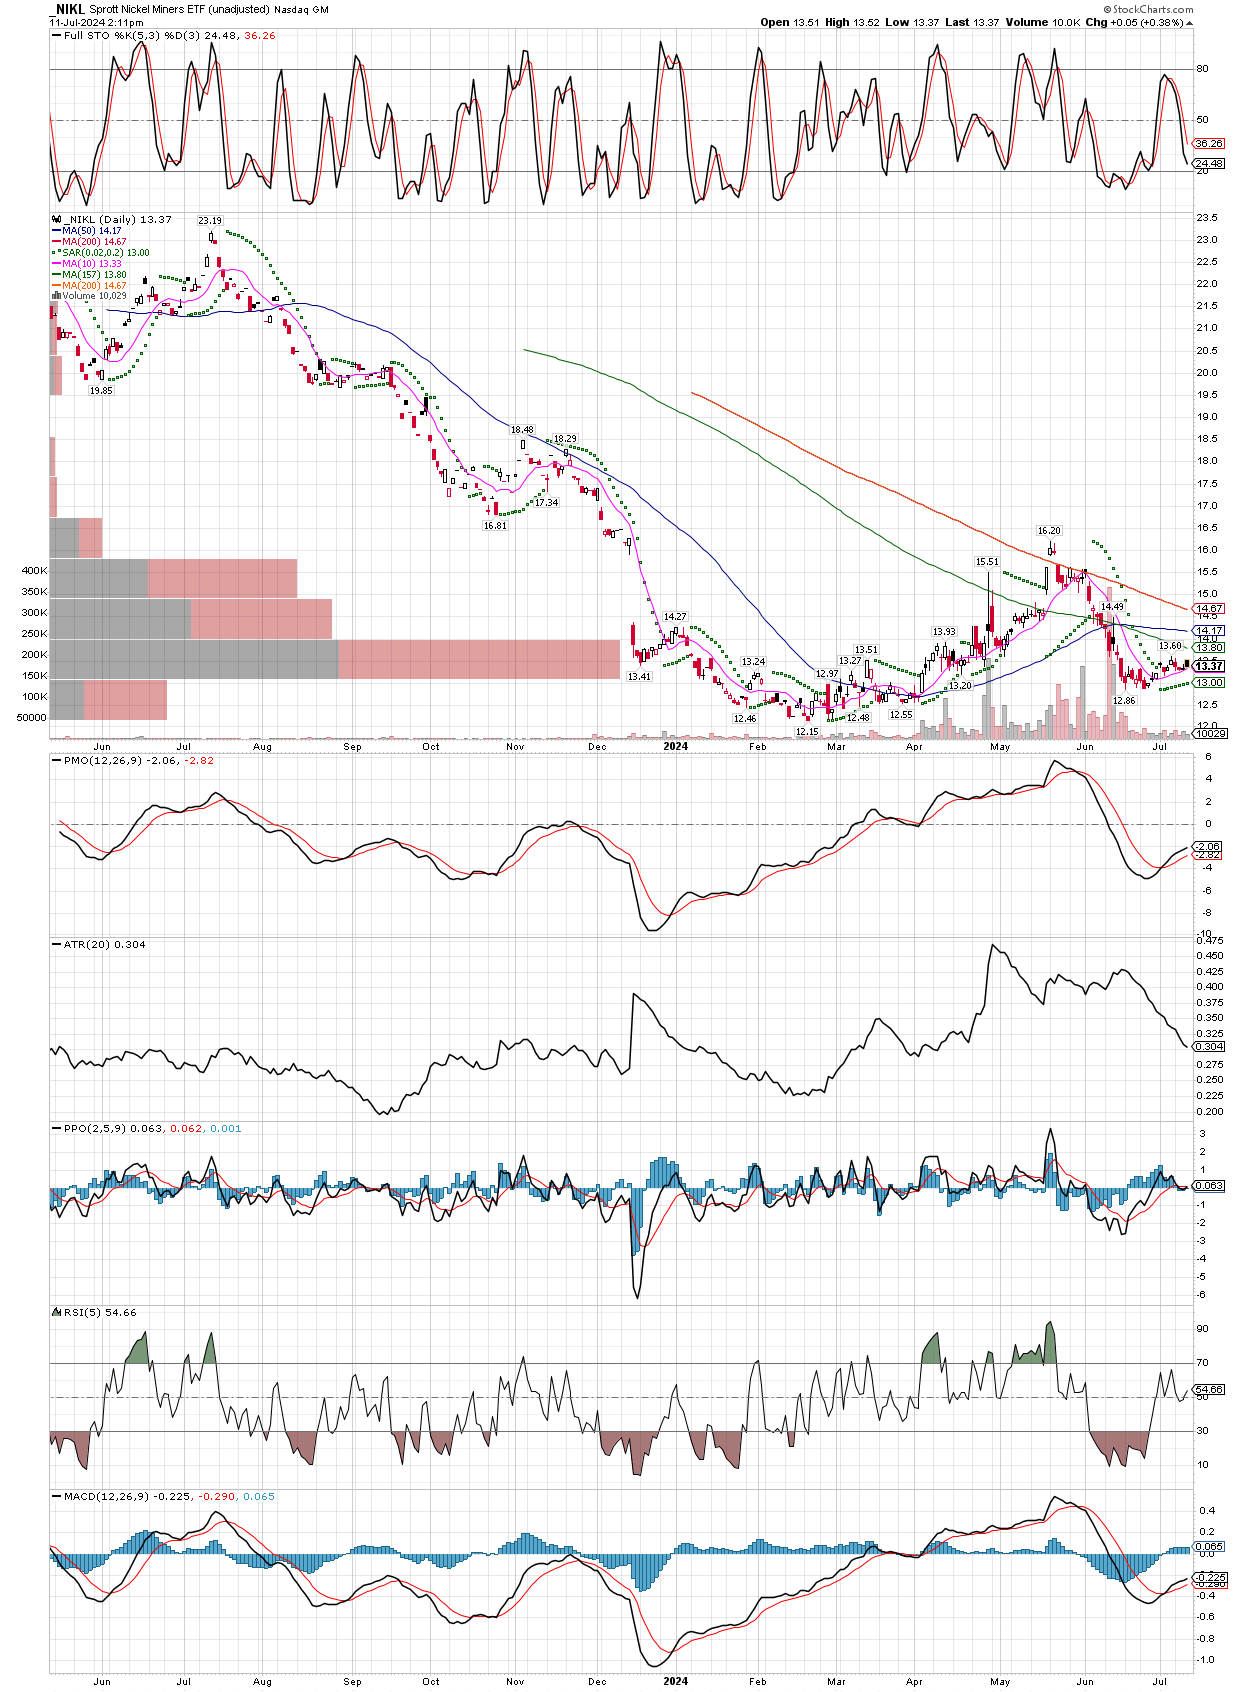
Just for a marker, I need to mention that I bought several nickel miners over this last week. One can follow the group using the NIKL ticker, which is Sprott’s nickel miner etf, but I bought individual names including IGO.AX (IGO Limited), NIC.AX (Nickel Industries), both producers with 9.29% and 6.06% dividend yields respectively, along with a couple junior explorers, TLOFF (Talon Metals) and CNC.V (Canada Nickel). I might be early in this group, but with good dividends I can afford to build these positions over time. Below is a chart of the etf to give you an idea of how they look,
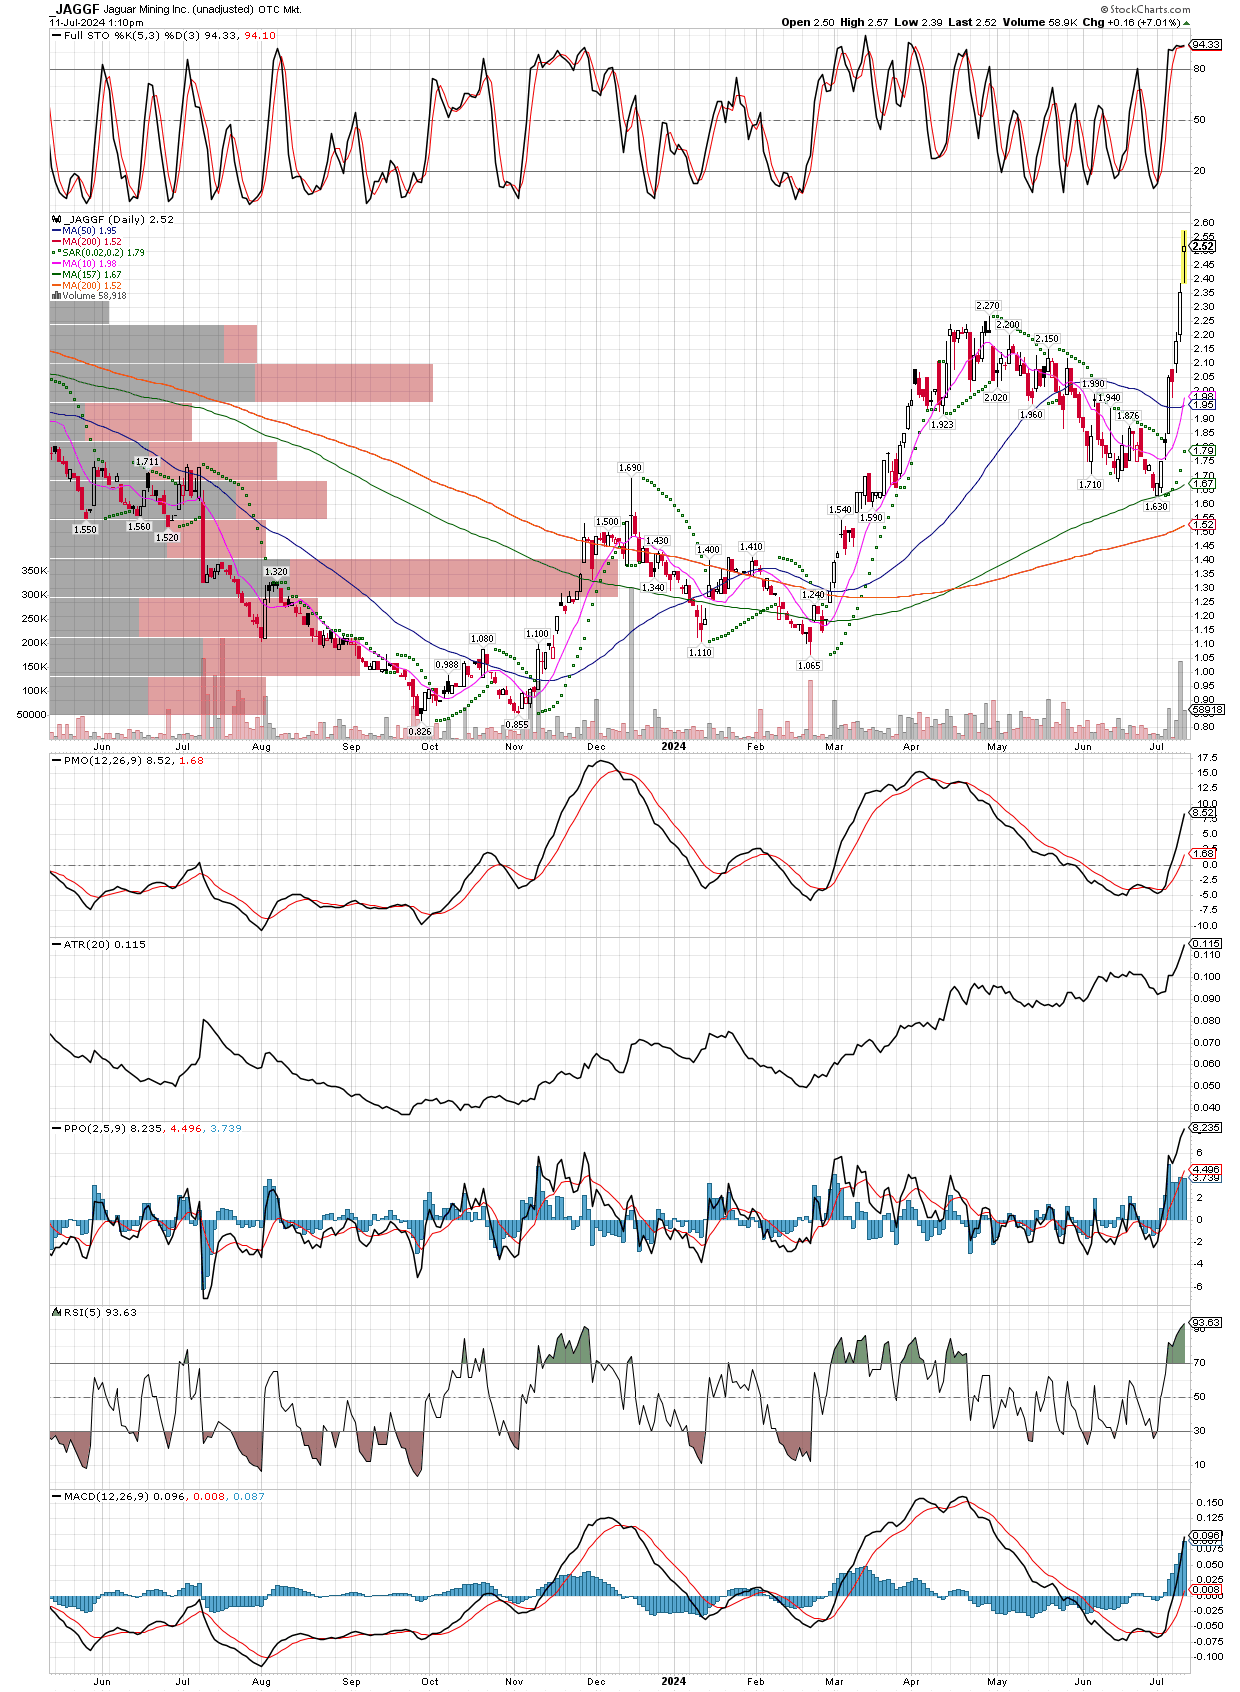
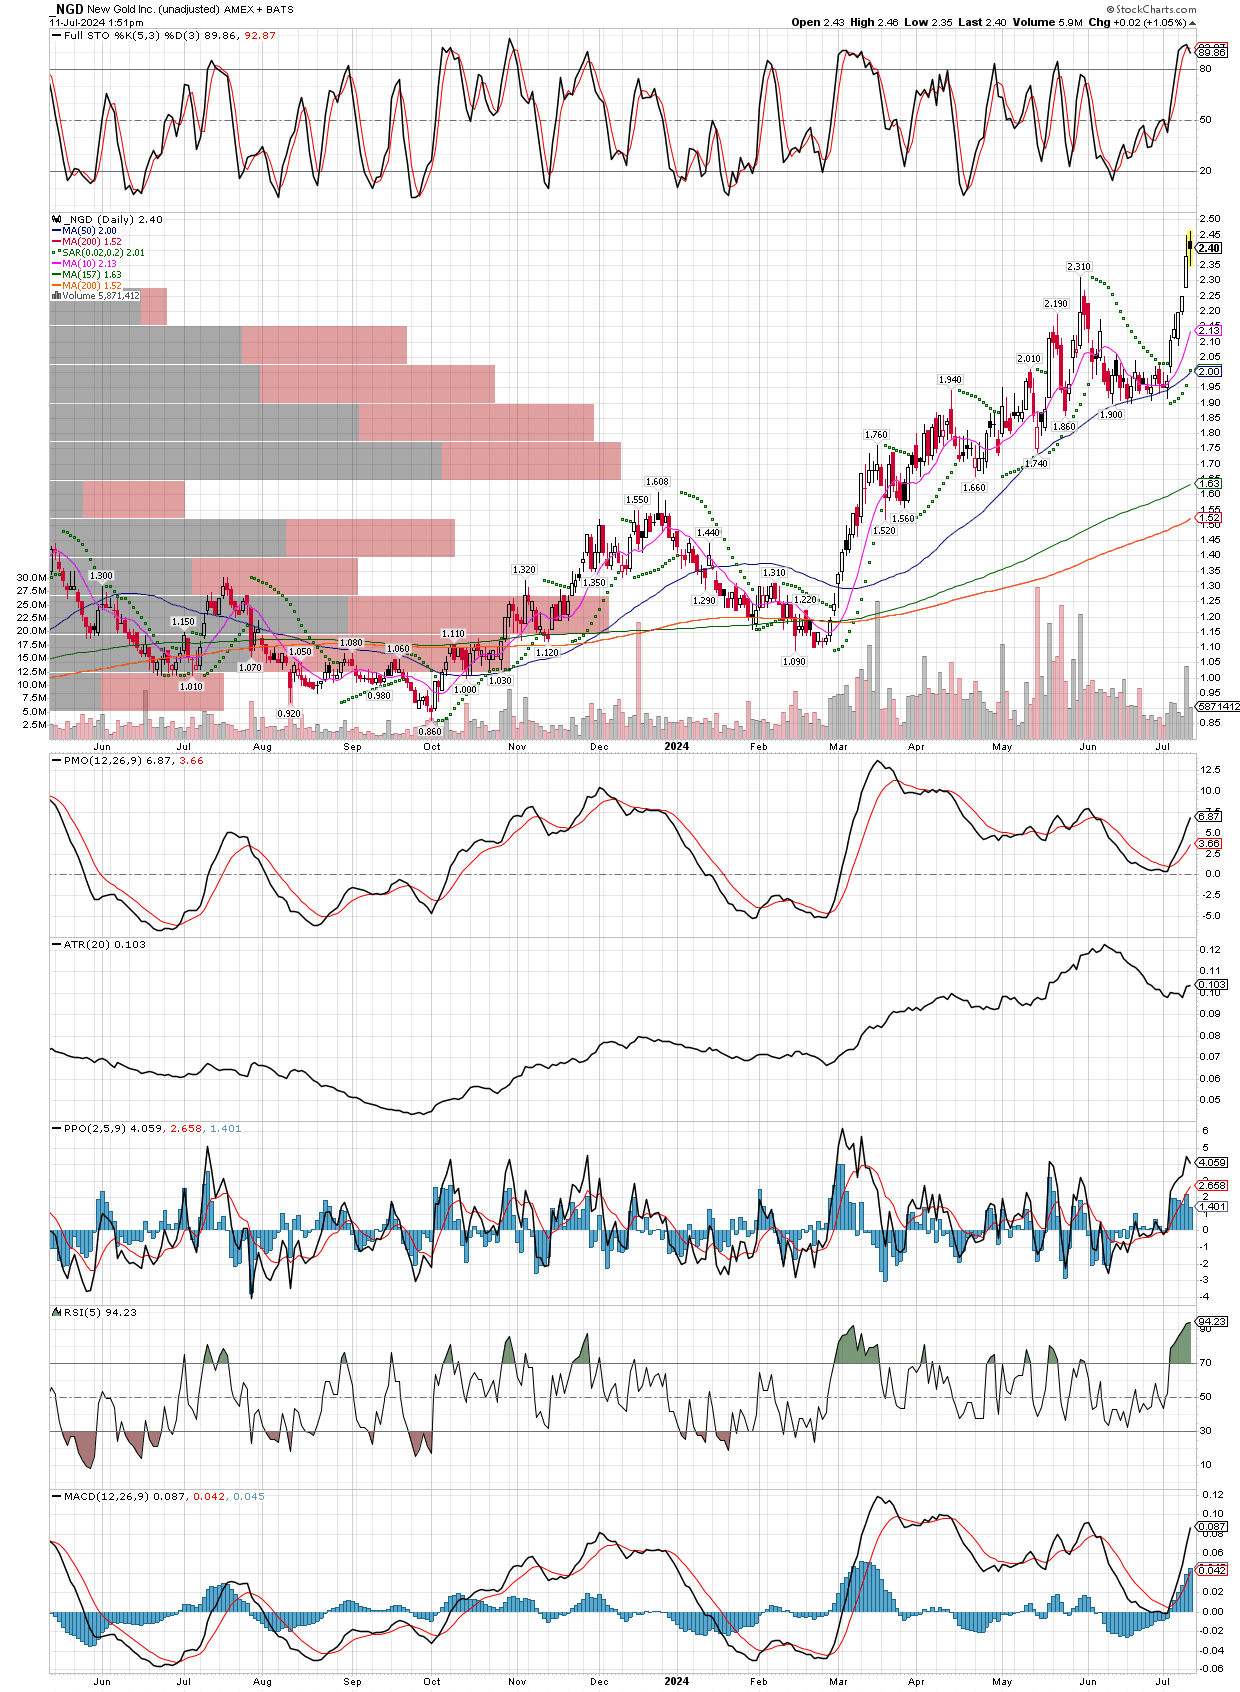
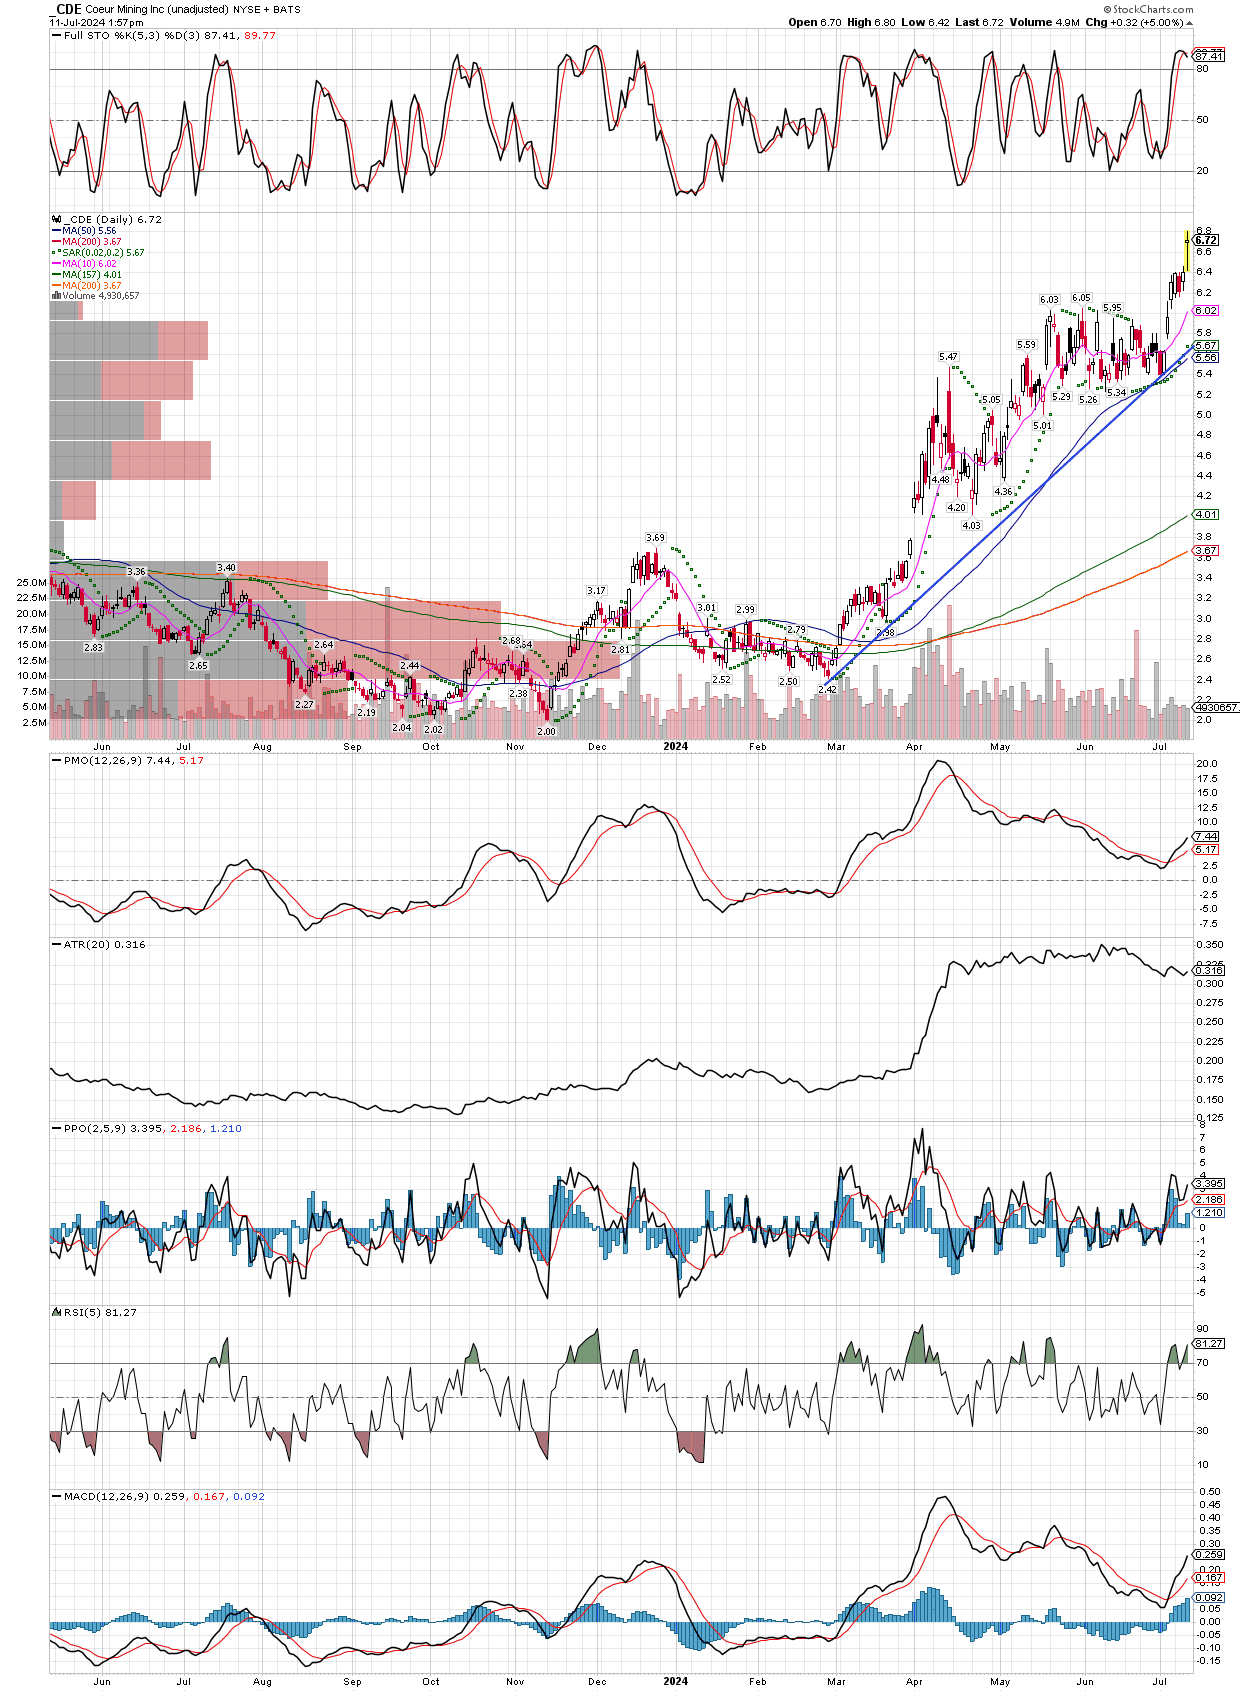
After several days of big gains back to back in our accounts, in the 6-8% range, I thought I would mention a few things. Many of our miners are taking out their 52 week highs again, supported but moving averages that are trending solidly higher. The GDX etf made a new high today with components like NEM, AEM, and WPM doing the same, while many of our individual holdings such as PAAS, CDE, GATO, JAGGF, EXK, SILV, NGD, and even our SILJ etf got within a penny of a new high for the year, as I type. This is a bull market action, if I were not already heavily long, I would get buying now.
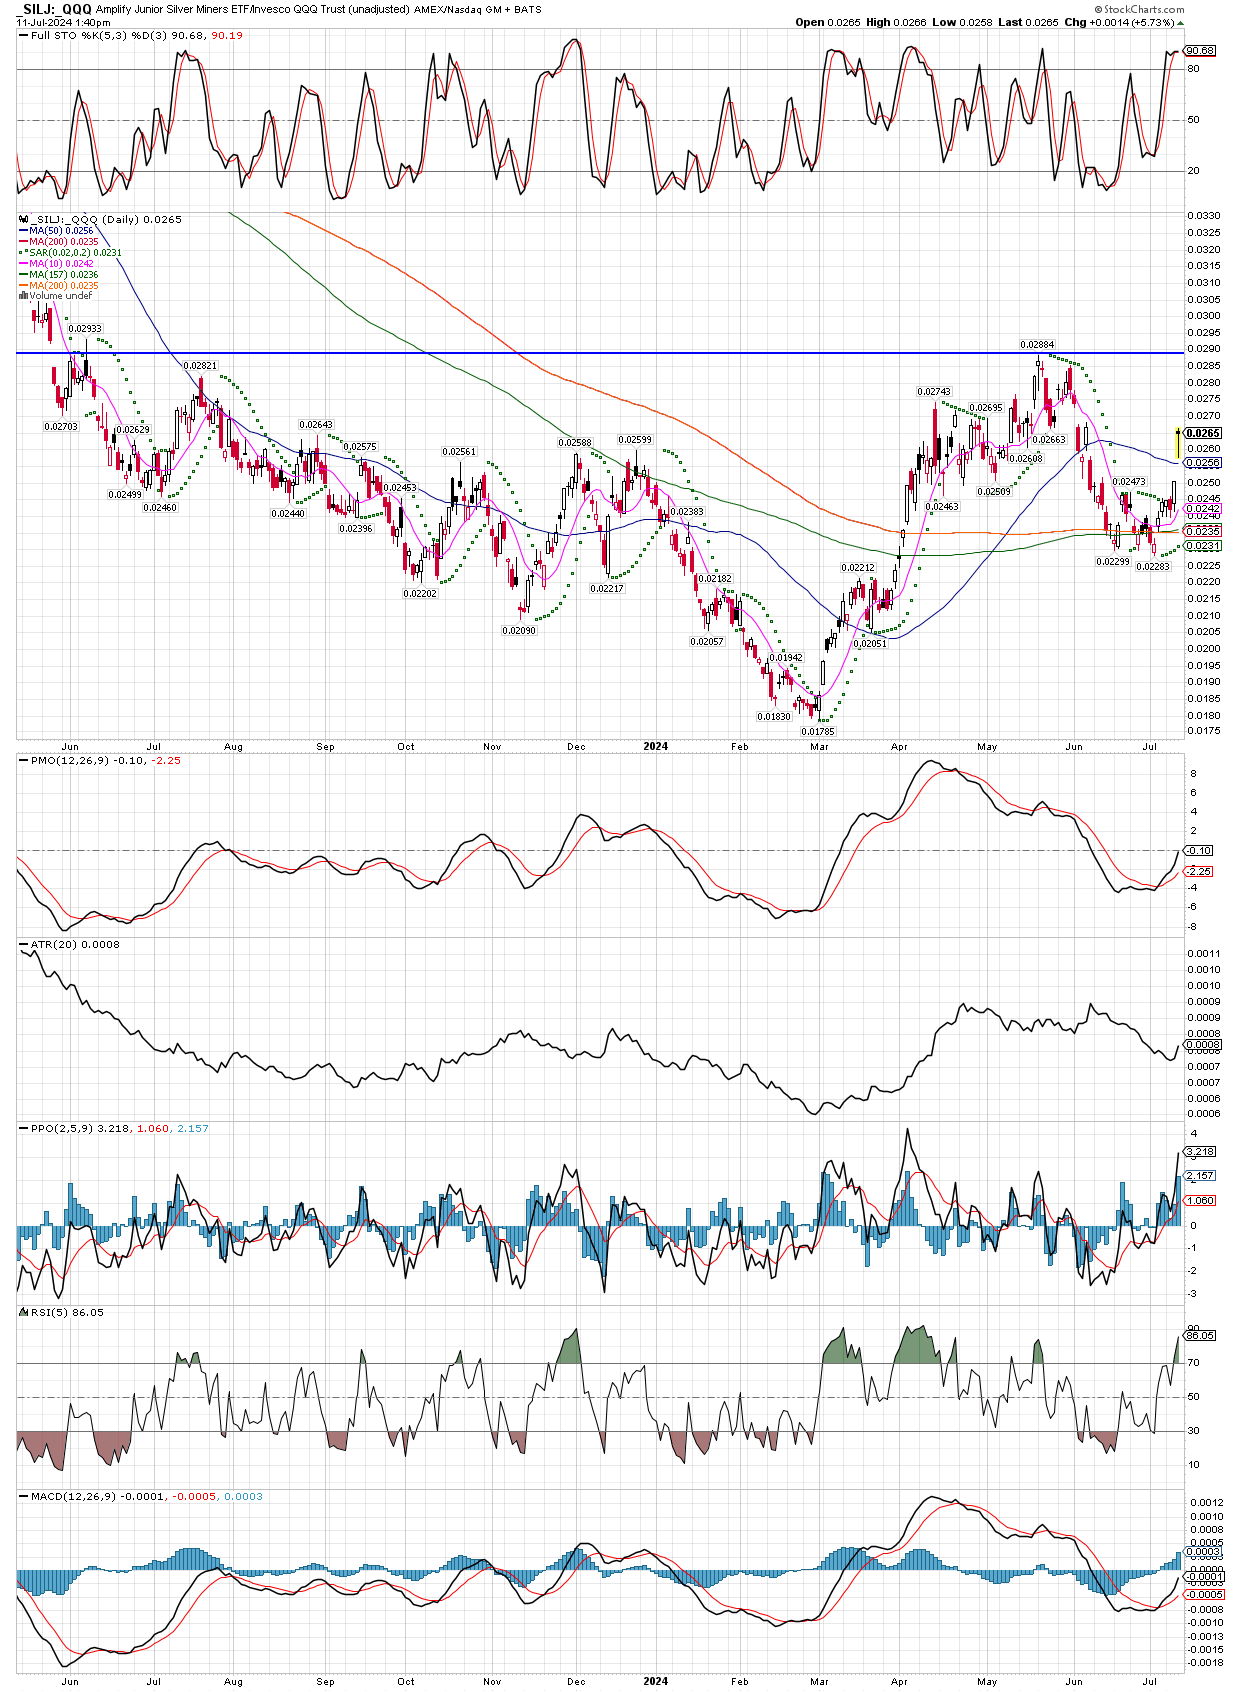
I will point out a few other things that might be showing us the way forward, for example, today is the first day in long time the tech stocks are won more than 2%. The fact miners are not getting dragged down with the general market is a big flashing BUY signal, I would not wait for a marker correction hoping miners drop with the market so I could buy them cheaper. It won’t likely happen, as we are already up 138% in CDE, 116% in GATO, with many more positions up 80-100% so far, and most investors still don’t acknowledge miners are in a bull market. This means there is a lot more to come, as they get converted to believers and start to chase the higher prices. I recently bought Silver futures (Sept contract), in the $29 range to add some more metal to our portfolios, and took advantage of the correction over the last month to add to most miner positions. So if the general stock market starts to weaken this summer, and we see more days like today, I would expect to see a lot more money flow into the precious metals and mining stocks. Take a look at the ratio chart of SILJ:QQQ, with a solid jump above all the moving averages, and note the 10 day moving average turning sharply higher as well. I expect this ratio to get over the horizontal line I have drawn above, very soon. What’s more, the junior explorers still have not kicked into serious bull mode yet, typical action in a new bull market is for the bigger, safer miners to make highs first like GDX has done, then new money flows into the mid-cap producers, later on the smaller, more risky juniors. This tells me there is still time for people to jump in now, I would focus on mid-caps at the moment, but I would not wait any longer. We have just passed the historically worst ime of the year for miners, they typically get strong after July 4th and run higher into September. Combined with the fact we are now beginning to see weakness in the general stock market, bitcoin and other competing investments, implies we could get a real rocket ride over the next few months. Remember that the biggest gains come in very short time periods. To illustrate, I will also post a chart of JAGGF (Jaguar Mining in Brazil).
Sharp rallies occur that make it hard to buy into a stock, NGD is another example.
There is also the problem of what to do if one of the miners you want to by didn’t even pull back much in the one-month correction we rode through, like CDE. It won’t partake in the downside, but more than happy to join the party when the group is rising. What a beautiful chart, and with a 138% gain already in the position, it will now be easier to hold for the duration of the bull. This stock often gains 400-800% in bull markets for miners, so while these names are extended in the short term, I will not sell anything as they won’t make it easy for me to buy back in.
I realize a trend line with only three touches of the line is not always a reliable line, but I drew it to illustrate how steep the ascent has been, out of the March low. The takeaway is the miners rally sharper than just about any group, and one doesn’t want to miss bull markets in them because they can be life-changing events. The fact is we keep getting additional confirmation that a bull has recently started, and the things we want to see fall into place, like a weakening stock market and economy are now showing themselves as well.
June 13, 2024
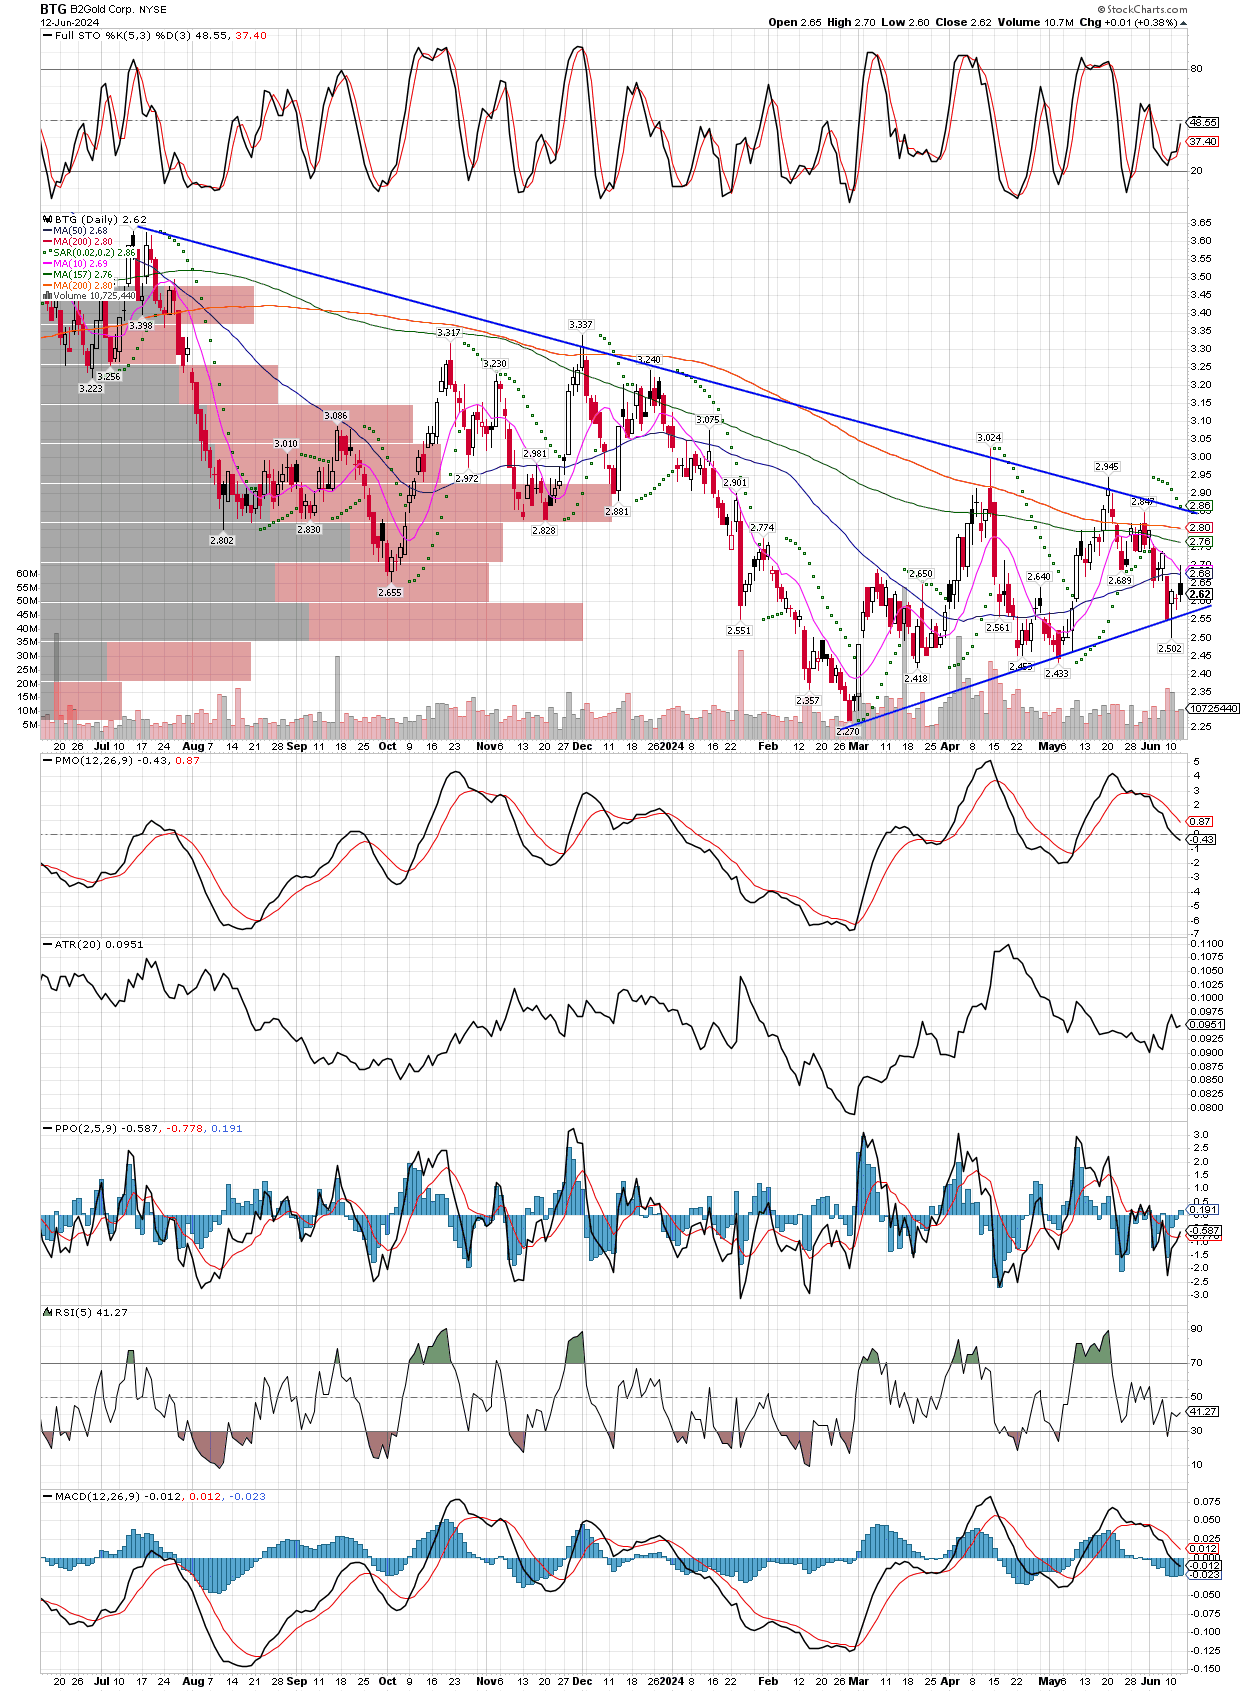
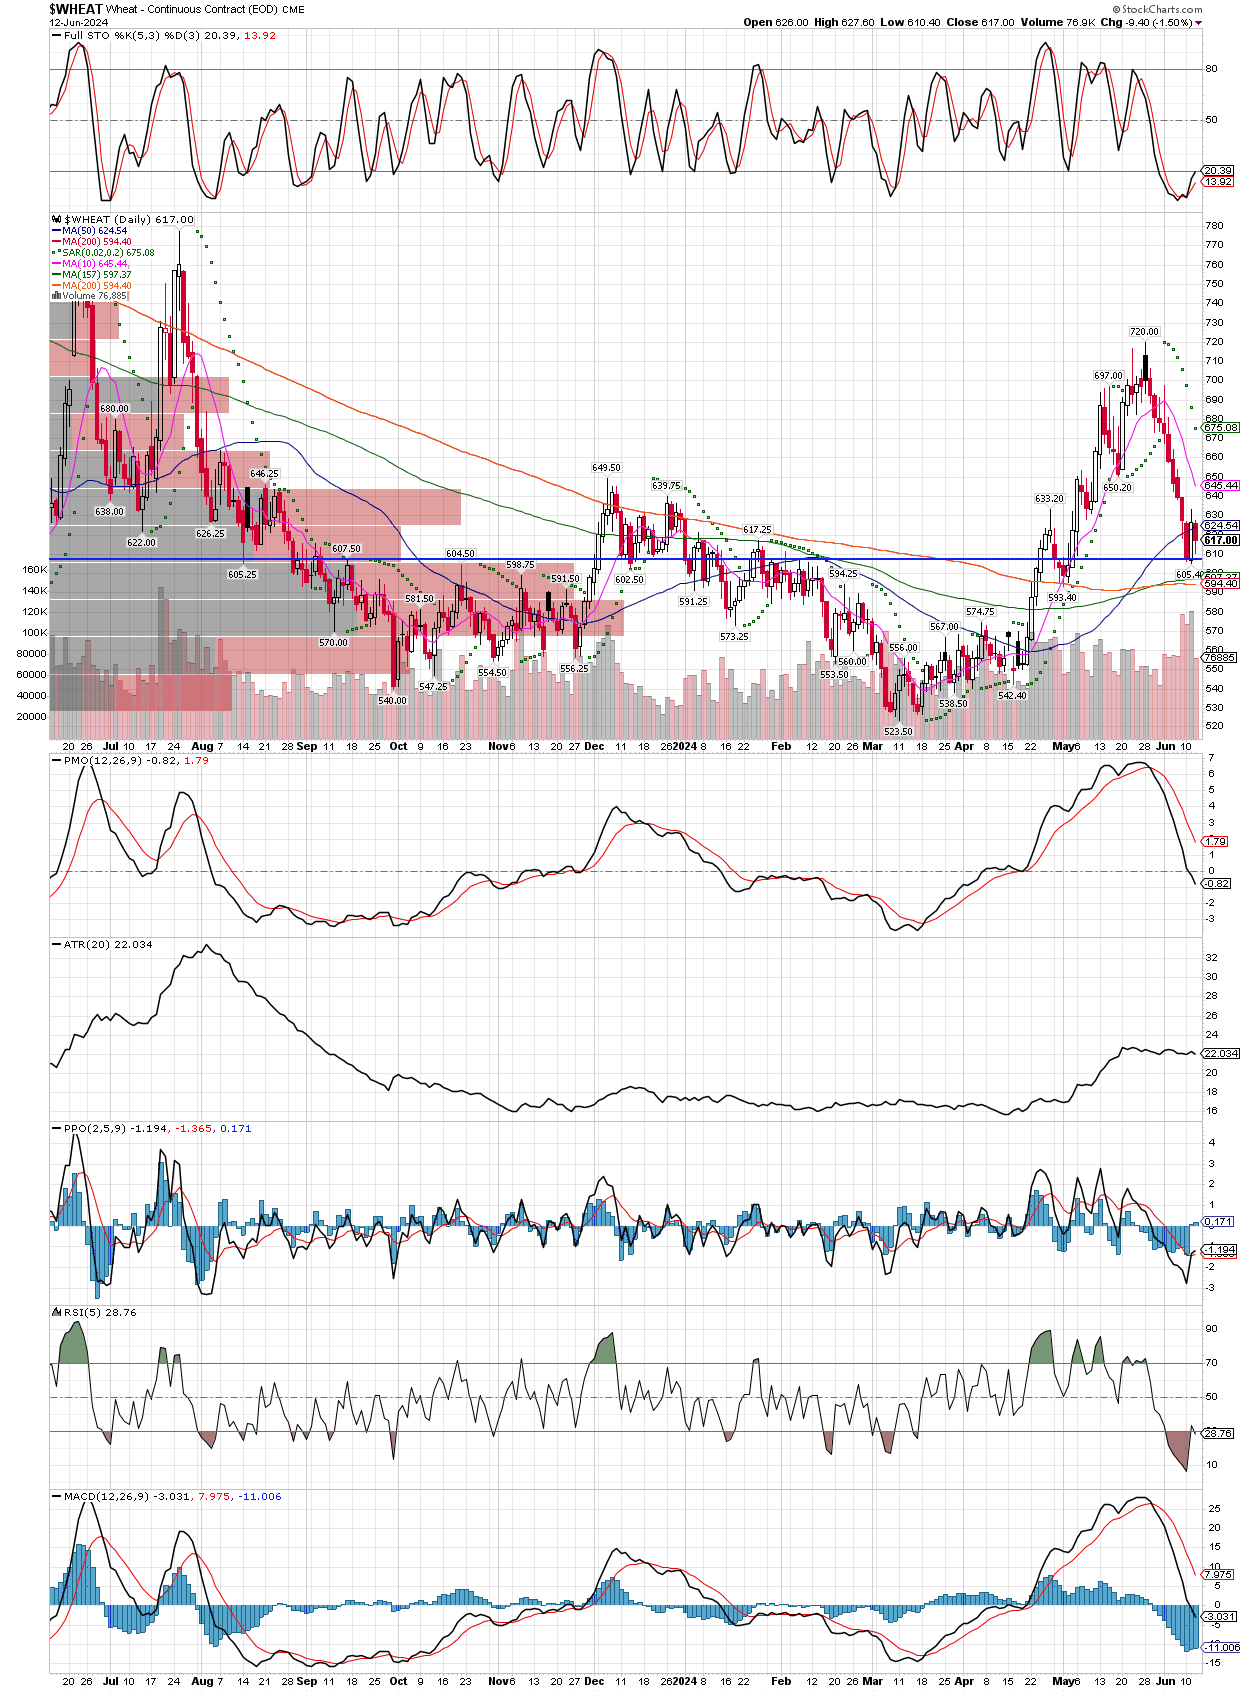
Historically, on average June 13 (today) is the low for the year in the precious metals miners. Since the miners were much lower in March than where they sit now, today can’t be the low, its either behind us or still in front of us. Either way, the plan remains the same. I’ve posted a couple charts below of stocks I am adding to positions, I really like BTG’s 6% dividend. I also started a fresh position in July Wheat futures (ZW), as you can see it has pulled back to some important moving averages and is oversold on stochastics, after a recent Donchian breakout in late May. I paid 620.00 per contract, and like that I can maintain a tight stop just below the 30 WK MA, limiting our risk.
June 6, 2024
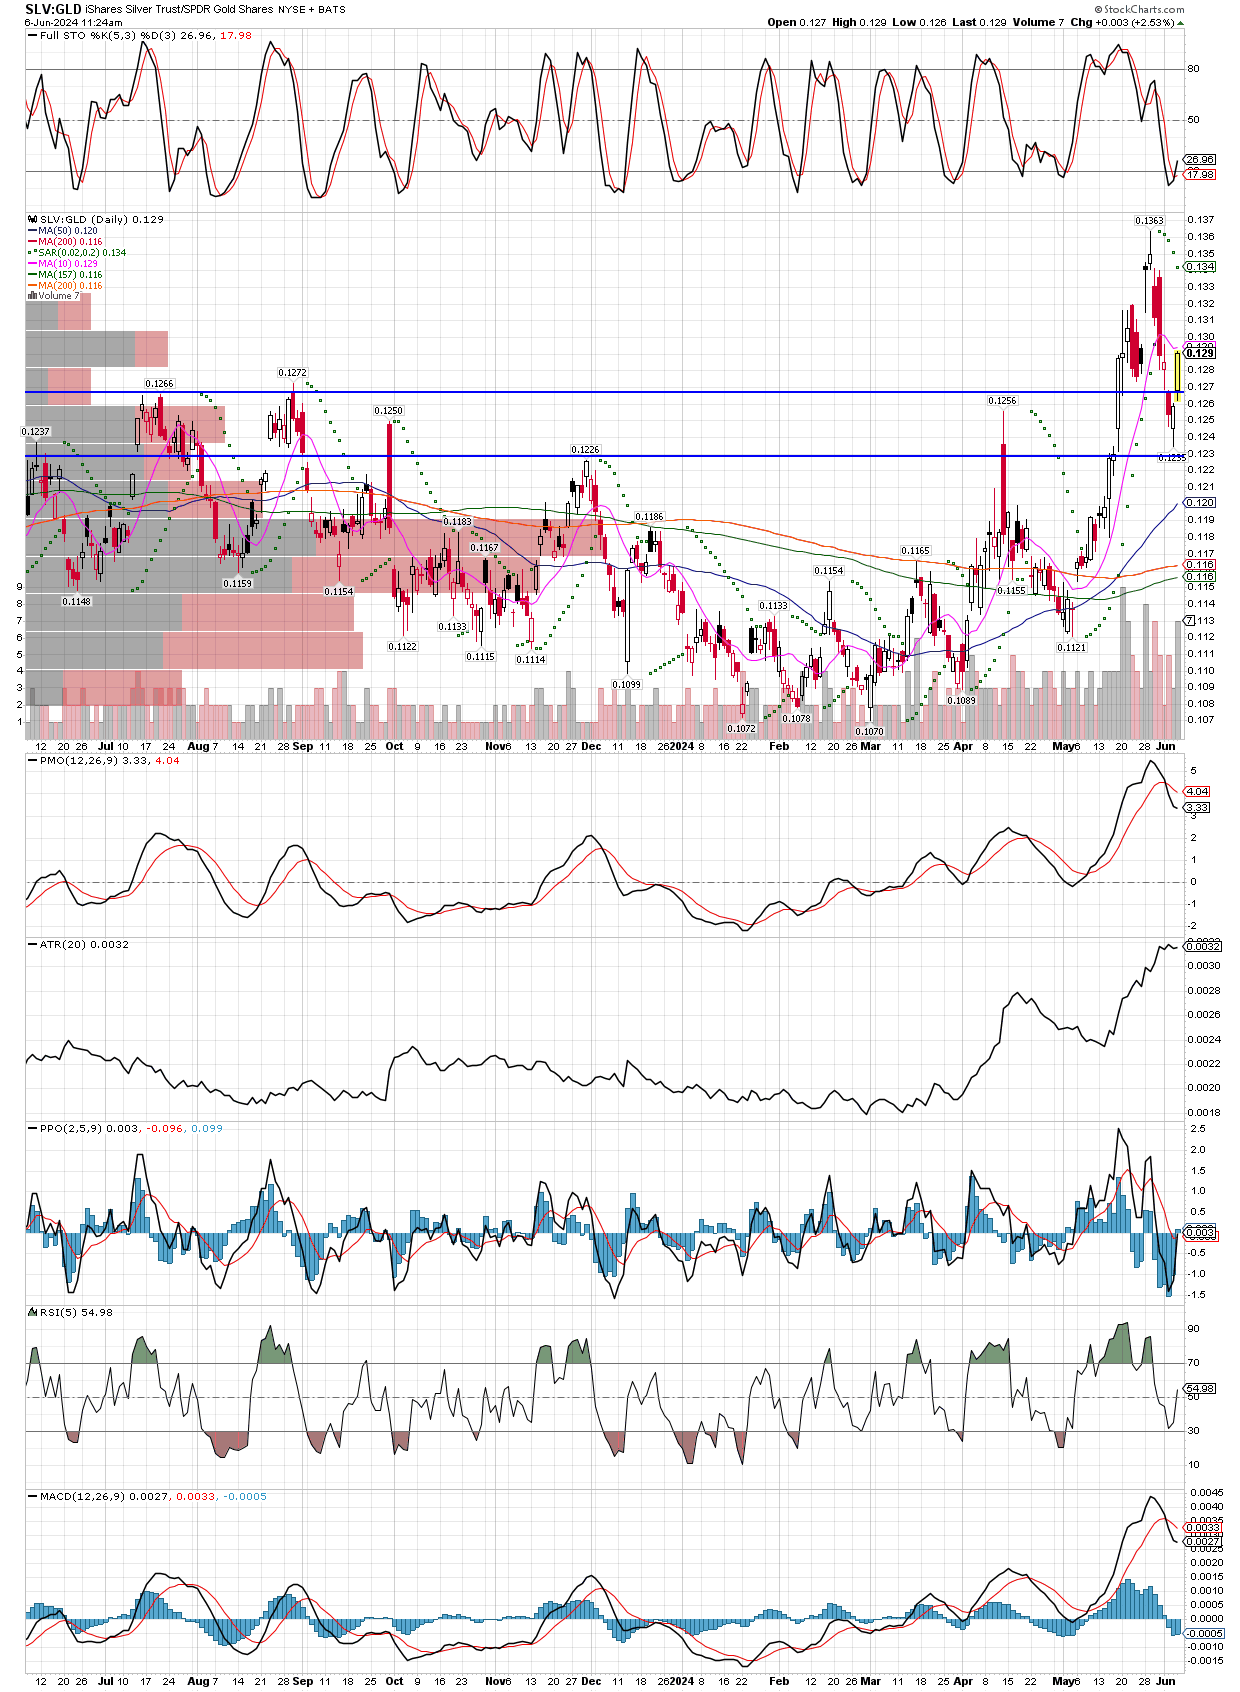
First is the SLV:GLD ratio, rebounding hard out of the support zone. As this chart trends higher, it reaffirms the bull market is underway. Oversold stochastics suggests this ratio has several more days upside, at least.
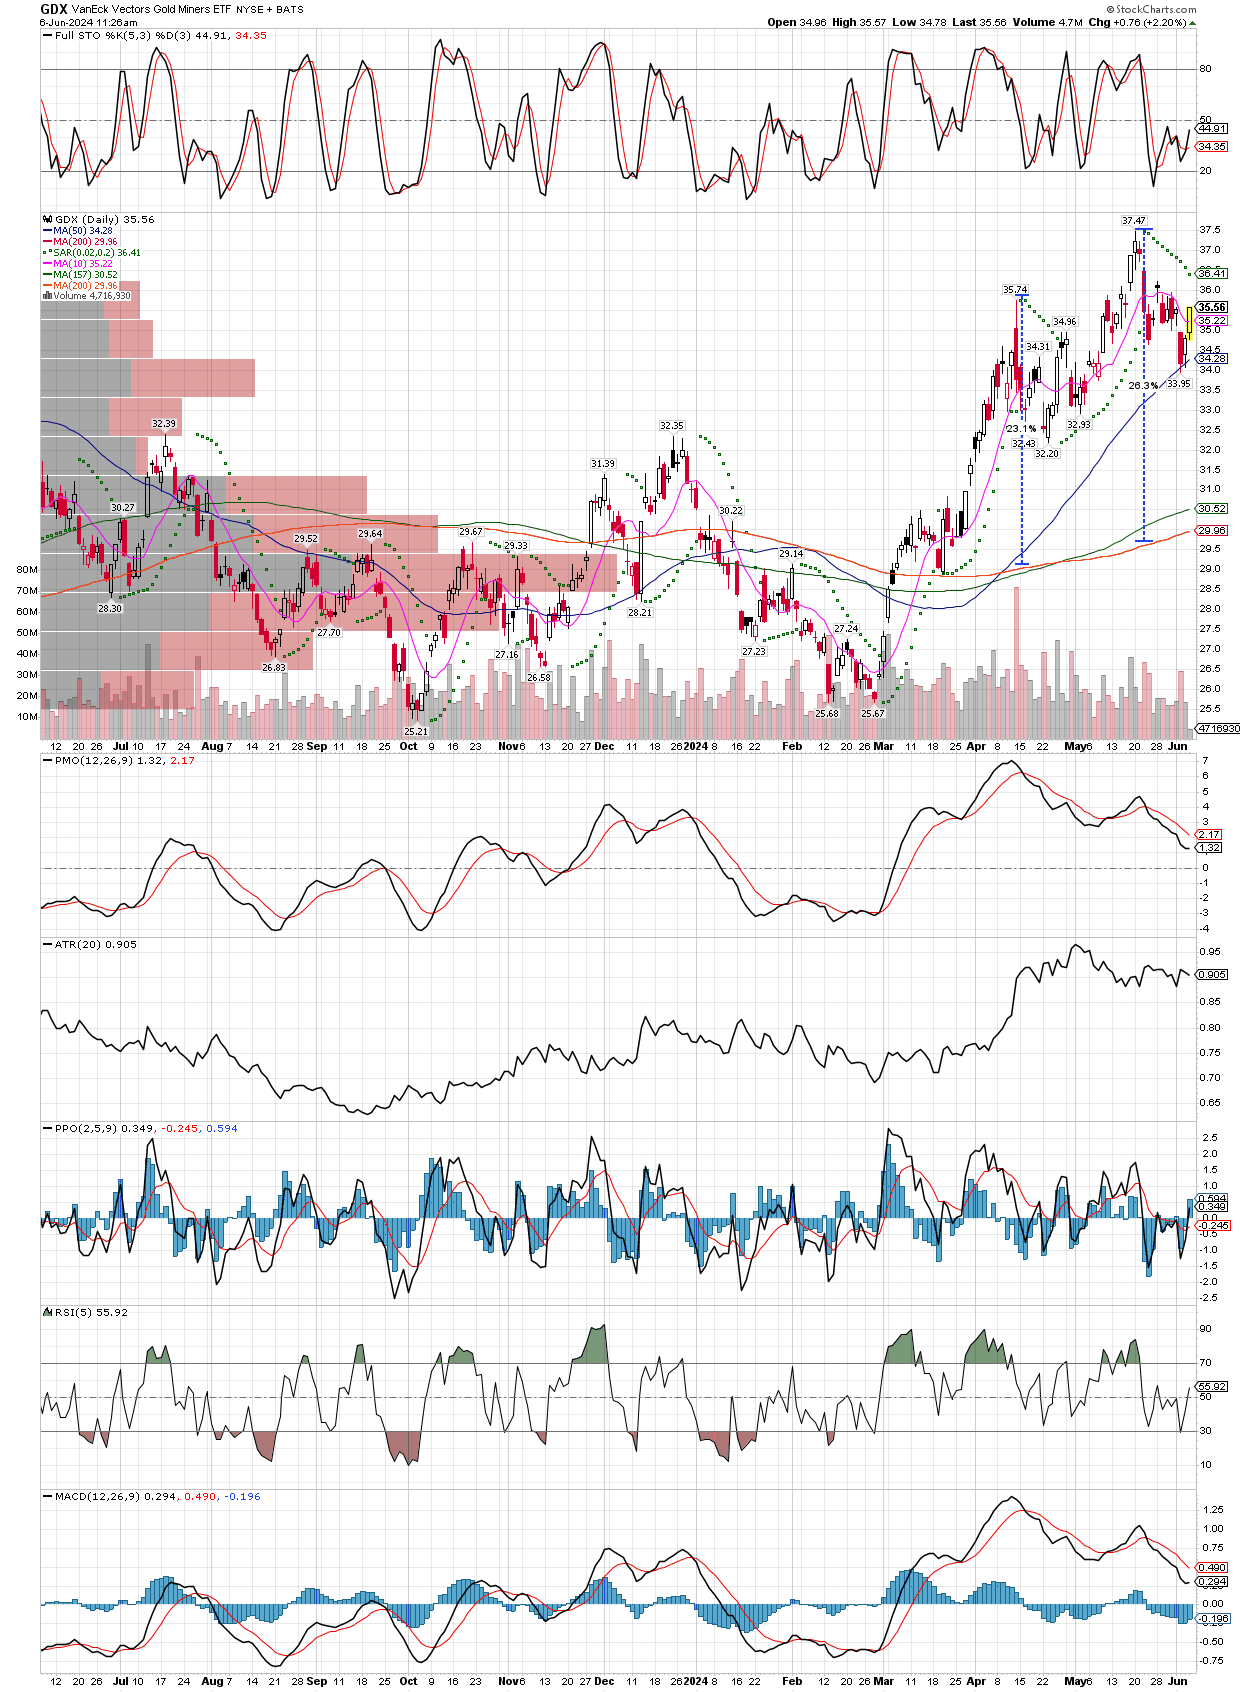
Next, we have the GDX daily chart, where I have measured the distance from the 200 day moving average thus far in this bull market. There is no way I will sell anything unless the GDX is at least 50-60% above it’s 200 day MA, as this typically is when the miners take a more significant break in their upside move. Until then, dips are to be bought, I don’t try to avoid them by selling and trying to buy back in at cheaper prices, because that is how one gets left behind.
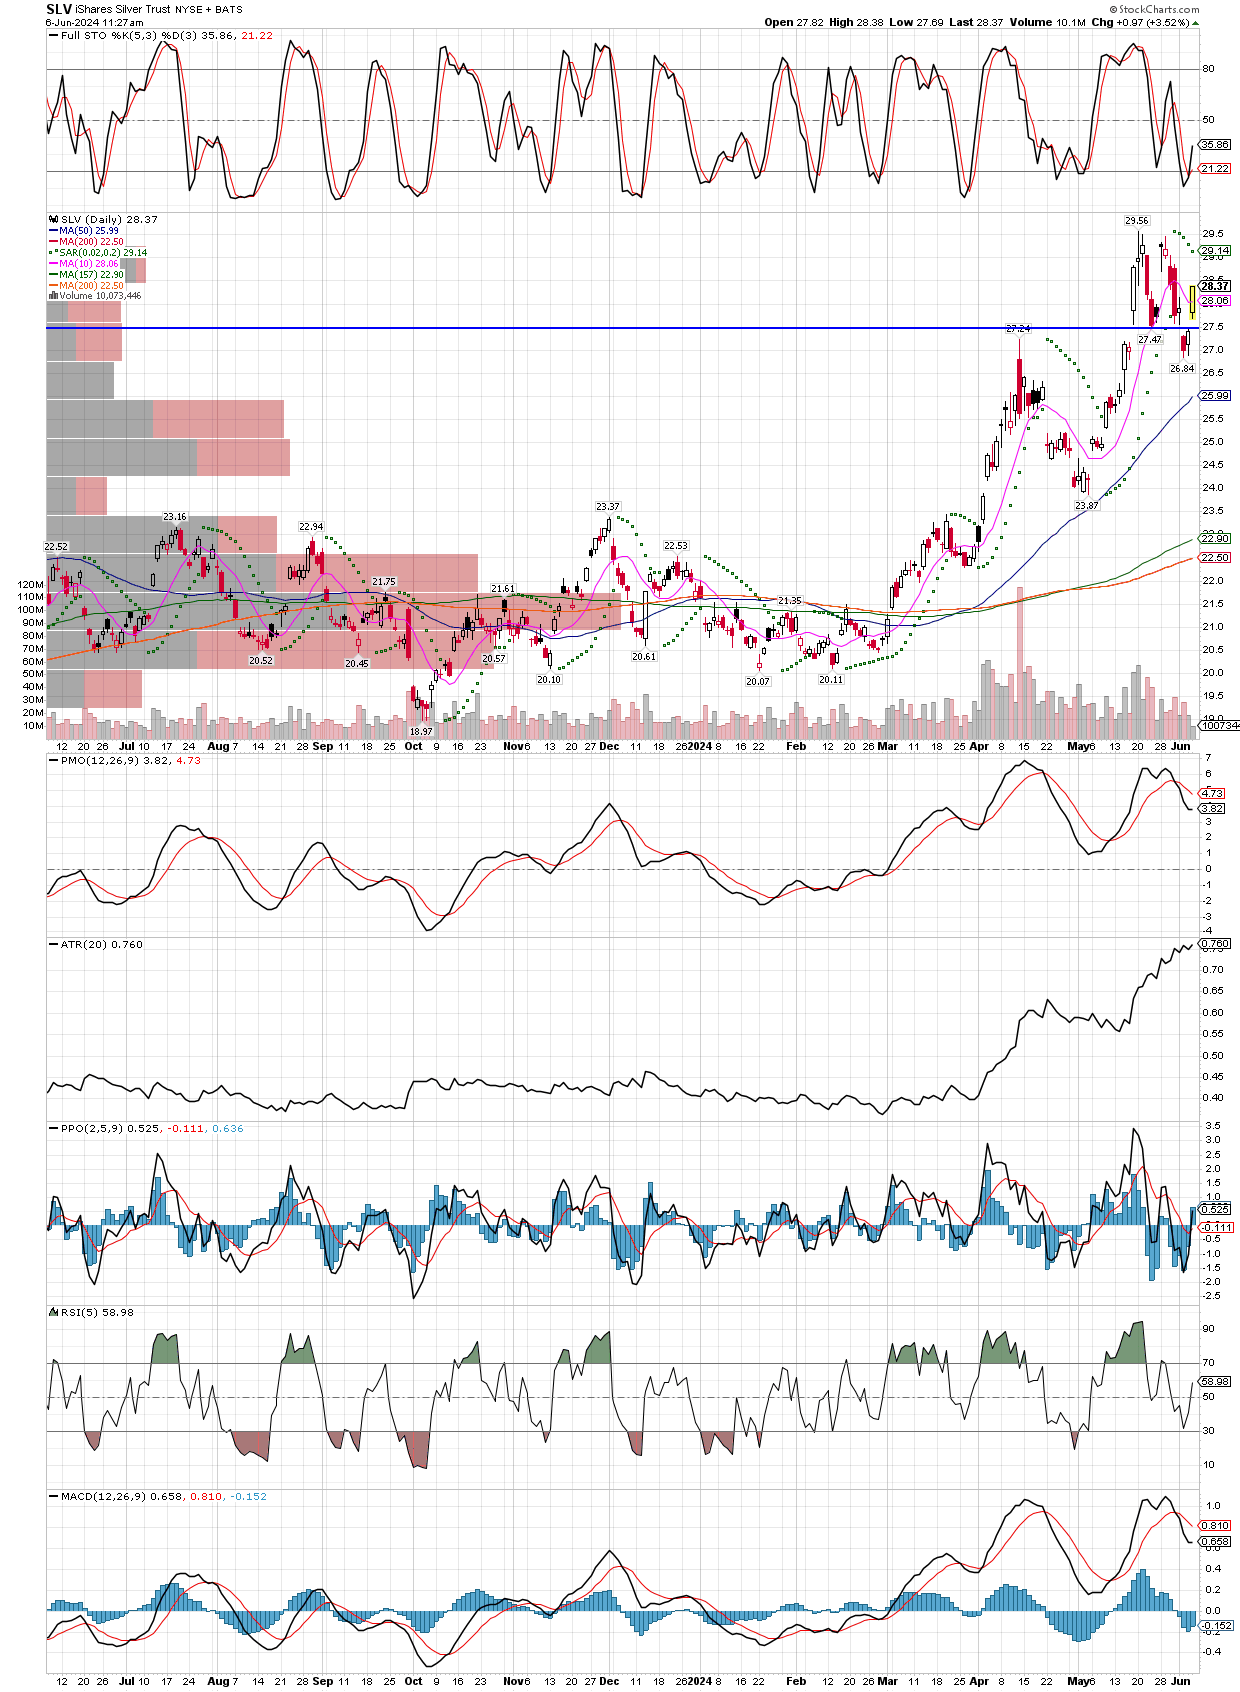
Now for the SLV daily chart. We see the oversold stochastics again, accompanying this sharp rally, pushing SLV back over its 10 day MA. It’s a sign that this pull back might have already ended. If it has, great because we added to many positions over the last few days, and it it isn’t the near term end of the correction, we will get a chance to add some more. However, bounces out of declines with this much force should not be ignored. Just like that, silver is only about $1.50 from new bull market highs, after taking out long held resistance. Note that it also bounced out of the new support area, which is the old resistance area.
June 4, 2024
The last few days have seen the metals and their miners pulling back to their 10 week MA’s. For example, SILJ and Silver futures have both retreated around 10%, while some miners have had sharper corrections.
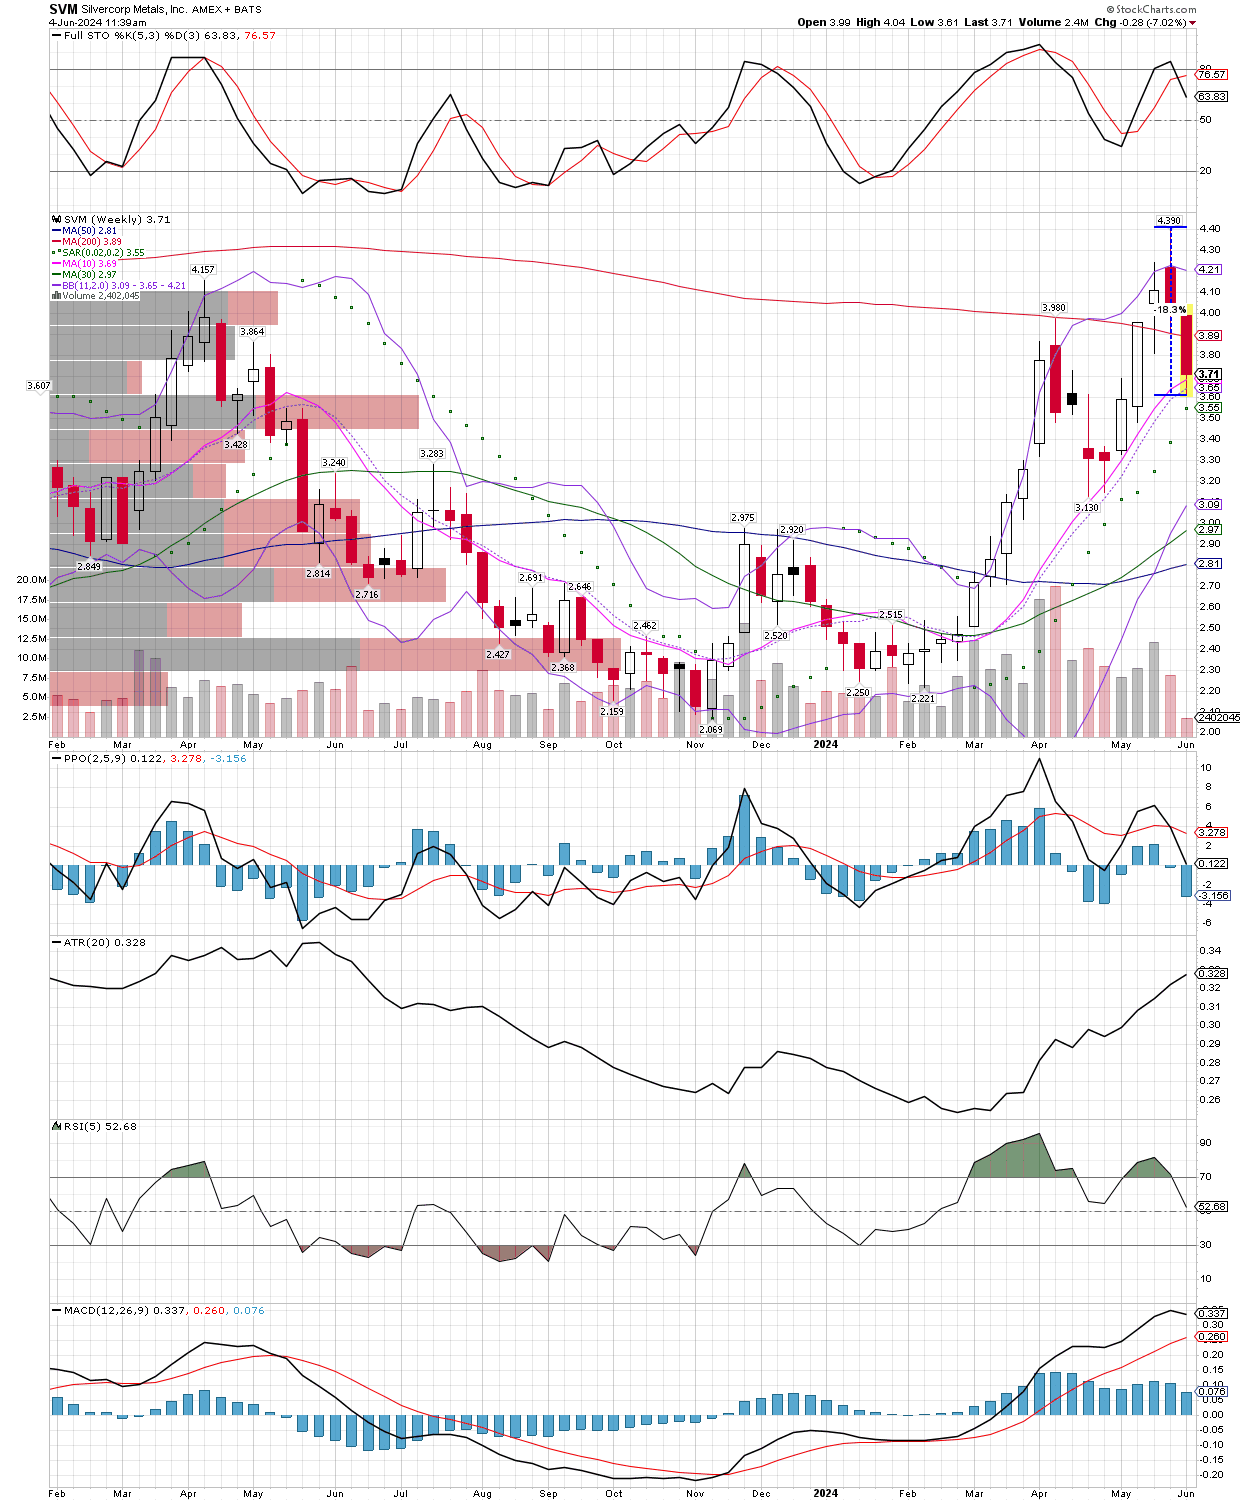
Now that the correction is here, the only question is how will you play it? Some weaker bulls, many of them late buyers into the runup, will be inclined to sell as they didn’t see enough gains to be able to hold steadfast into a decline. For those that bought in at much lower prices like we did, I am taking advantage and doing some moderate buying today, adding to various miners and the SILJ etf at their 10 week MA’s, which seem to get respected in a verified bull market. For no other reason than I just had this chart up, I decided to post SVM (Silvercorp), which I am adding to now, as the charts shows it’s already corrected around 18%. Can it go lower tomorrow? Yes it can, but more often than not, buying a stock that is in a bull market and has dropped 18% back to its 10 week and 50 day moving average, is a high probability bet.
Regarding other commodity groups I am watching with interest, such as copper and base metal stocks, they have also experienced decent-sized corrections. It will be interesting to see if they can hold, then turn higher from these levels, or if the weakening economy drags them lower. Energy is another group I am curious to see how it holds up, as its been relatively weak in the commodity arena. Are these rolling over, the XOP and COPX, or are they presenting an opportunity to get on the bull train again? We will know soon enough, but for now my focus continues to be on precious metals and their miners, as they can go up, in fact should benefit, from a weakening economy and stock market.
May 31, 2024
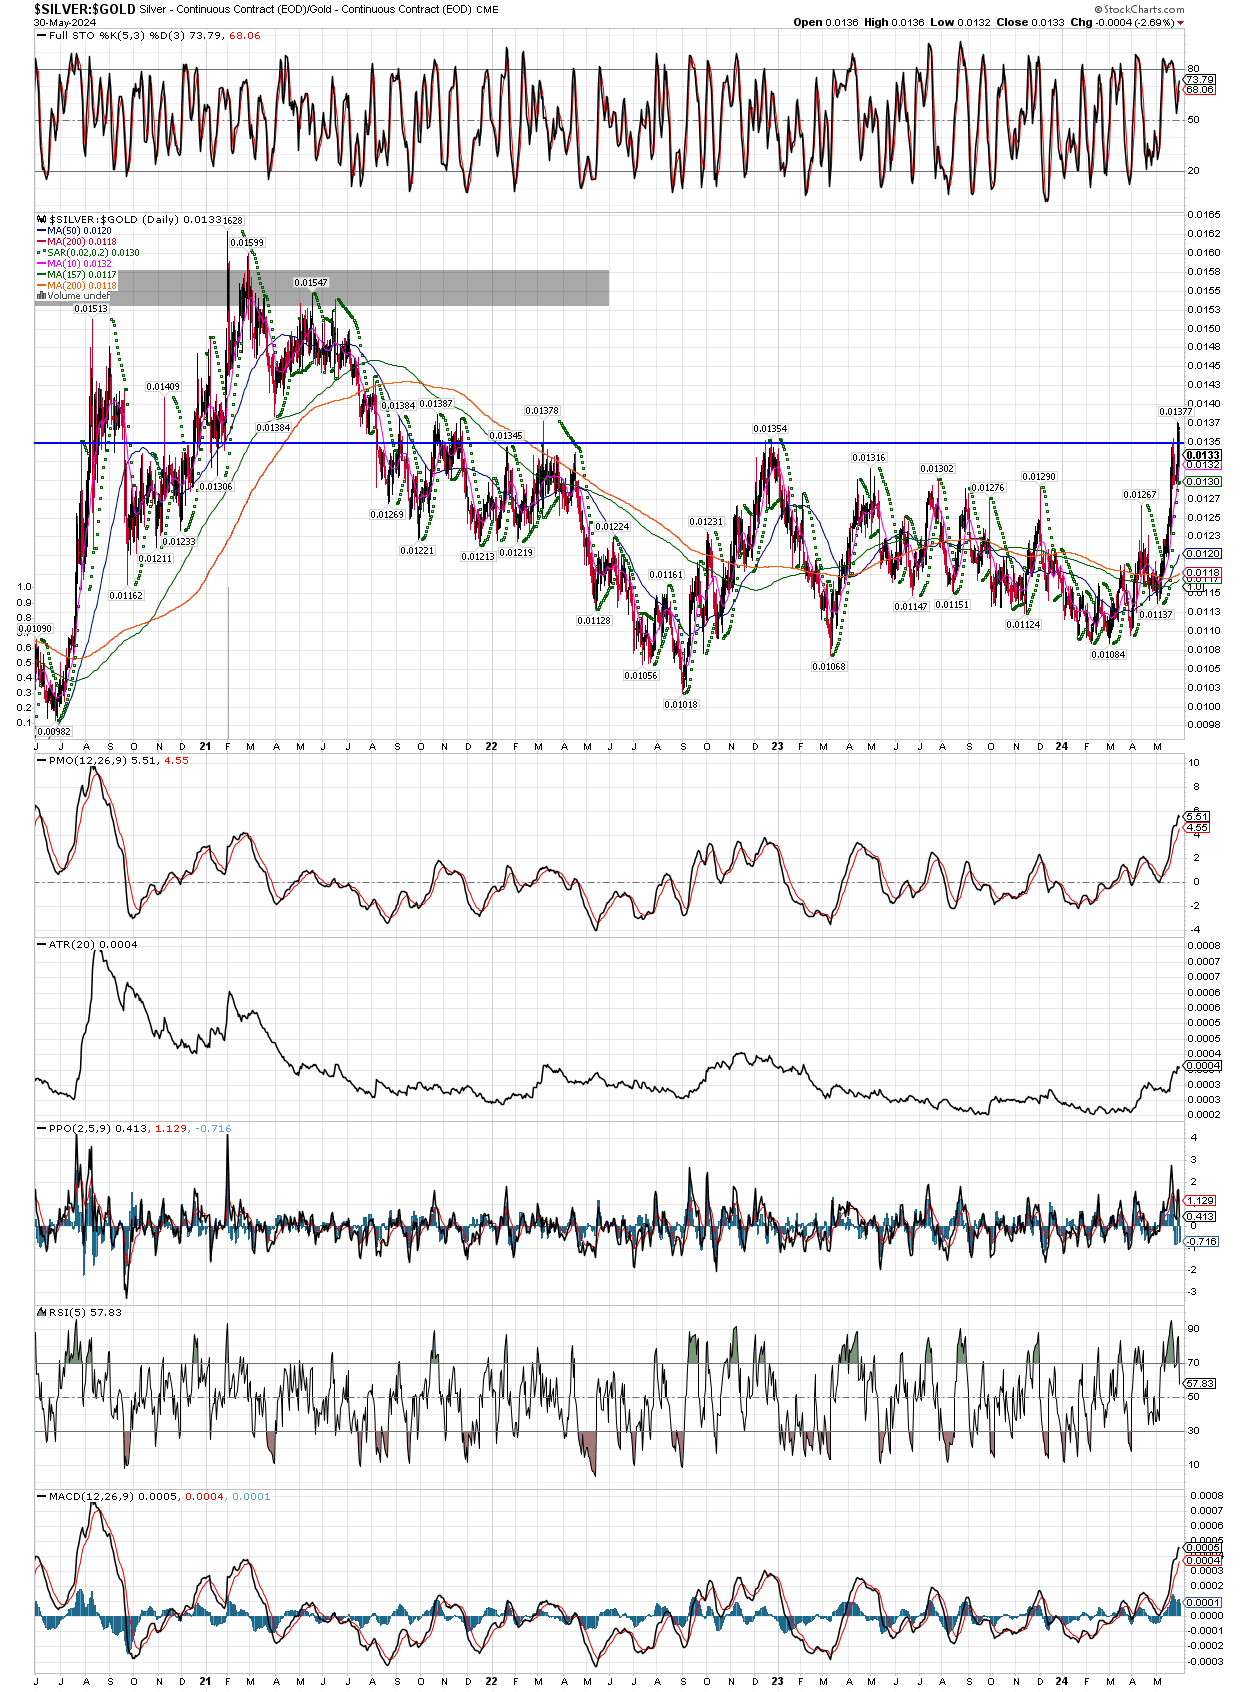
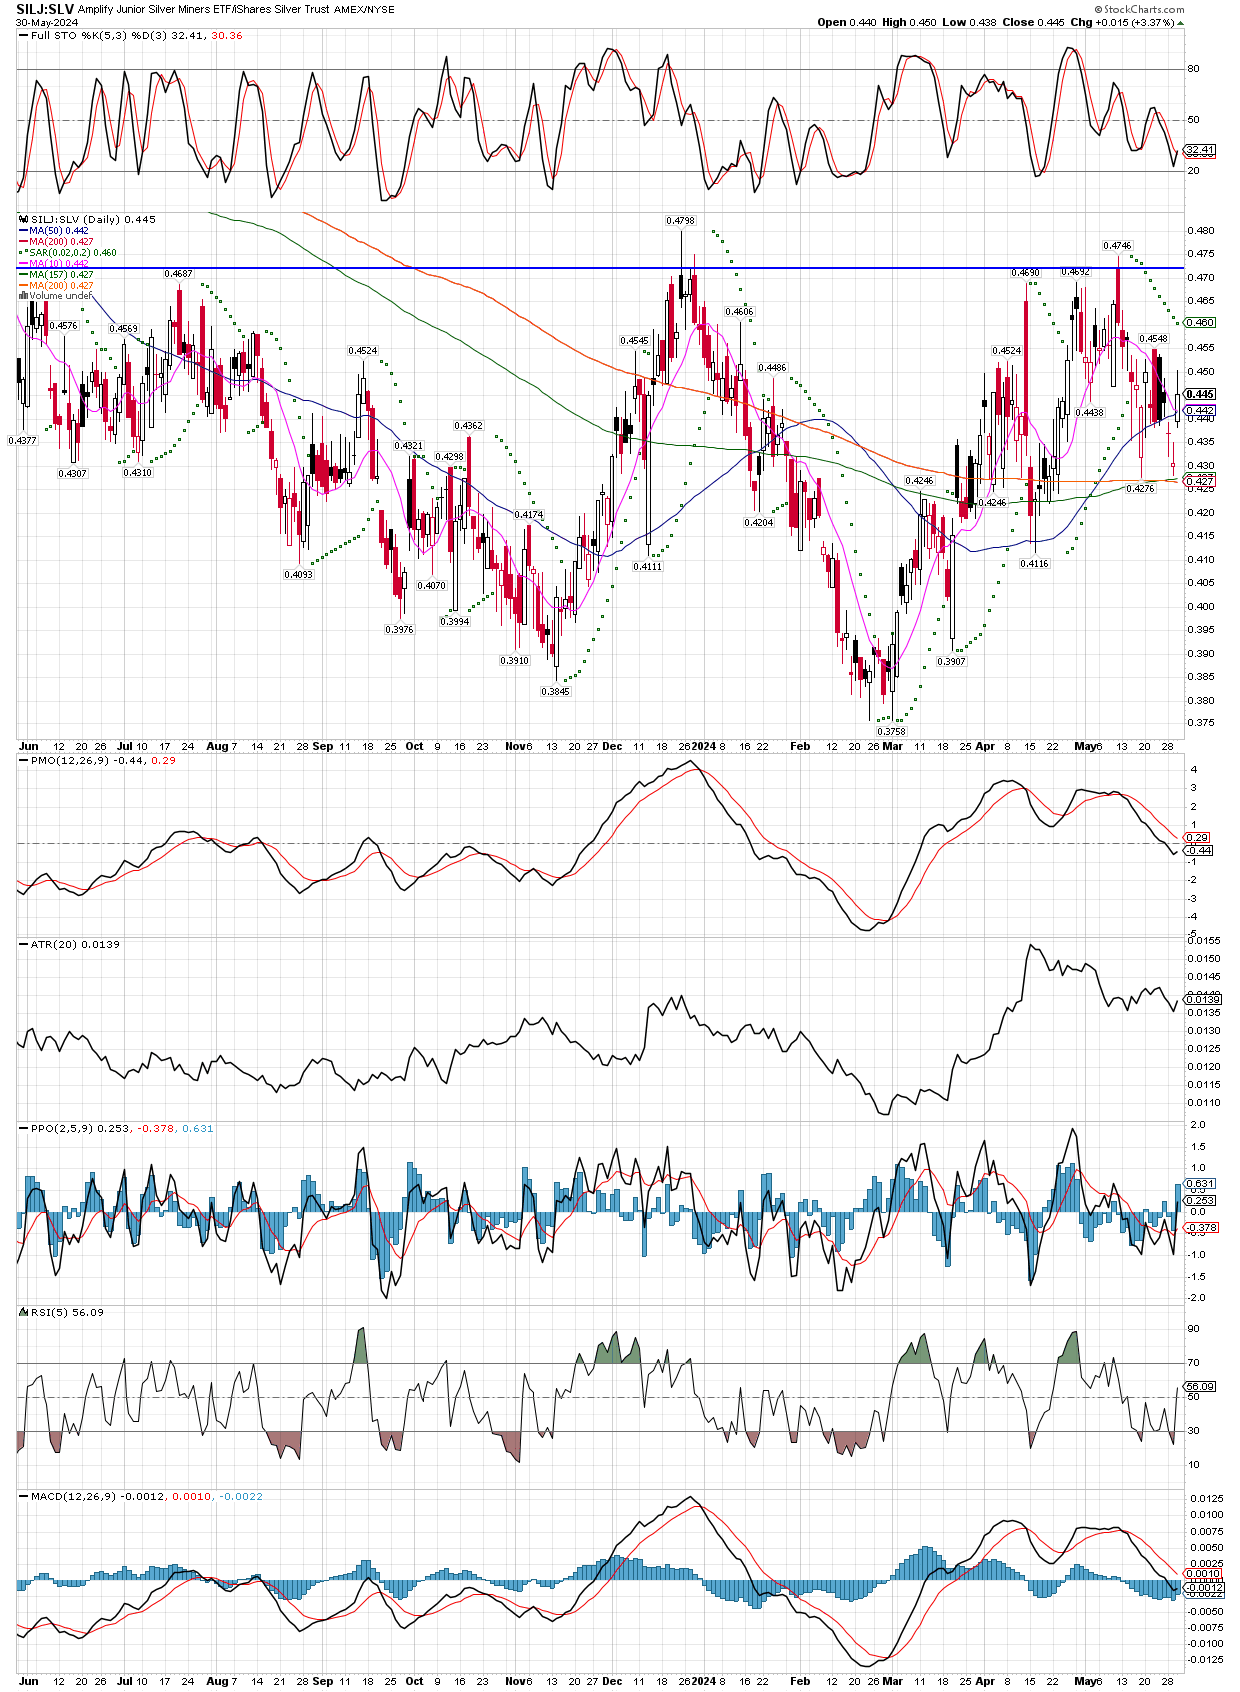
Two ratio charts showing developing trends, the $Silver:$Gold illustrates silver in breaking out vs gold, typically a sign of a precious metals bull market. The second chart is SILJ:SLV, interesting because yesterday silver was down 3.5% all day, while silver miners were in the green all day, finishing up on the day. Normally, one would expect to see silver miners down double the metal, or more, so a 7% down day would not have surprised me, but seeing the strength in miners sufficient to end the day higher, surprised me greatly! The bull is here, buy all dips!
Not only have we seen a recent breakout in silver vs. gold, not the trends in the moving averages in both charts. They have finished going lower and actually are just turning higher, so I expect to see silver and miners to lead gold, while gold also continues its march higher.

