Uranium stocks setting up for a BUY

This weekend I wanted to go through some uranium miners I see coming into potential buy zones, with oversold technicals. I’m not buying these just yet, but I am getting my list ready to put into action. Regarding uranium miners, some like Rick Rule are very positive on the group. While he is well known for his expertise in resource markets, and remains a staunch bull on the precious metals, he makes it clear that a dart-throwing selection process has a far higher probability of success in the uranium miners (roughly 8 out of 20 are investable- about 40% of the group), than it does in the precious metals miners, where we are lucky if 10% of a much larger group are worth our time and investment. That is not to say that precious metals miners are not lucrative when we do out homework, but the uranium sector is much “easier”, and our odds much better, if we have timed our macro calls well. Let’s look at some charts, and keep in mind that the only uranium stock I own at the moment is UROY (Uranium Royalty Corp.). I did own CCJ (Cameco Corp), but cashed out with good profits a few months ago. Now that it’s correcting, I am waiting for a good window to get back into CCJ along with the following uranium stocks.
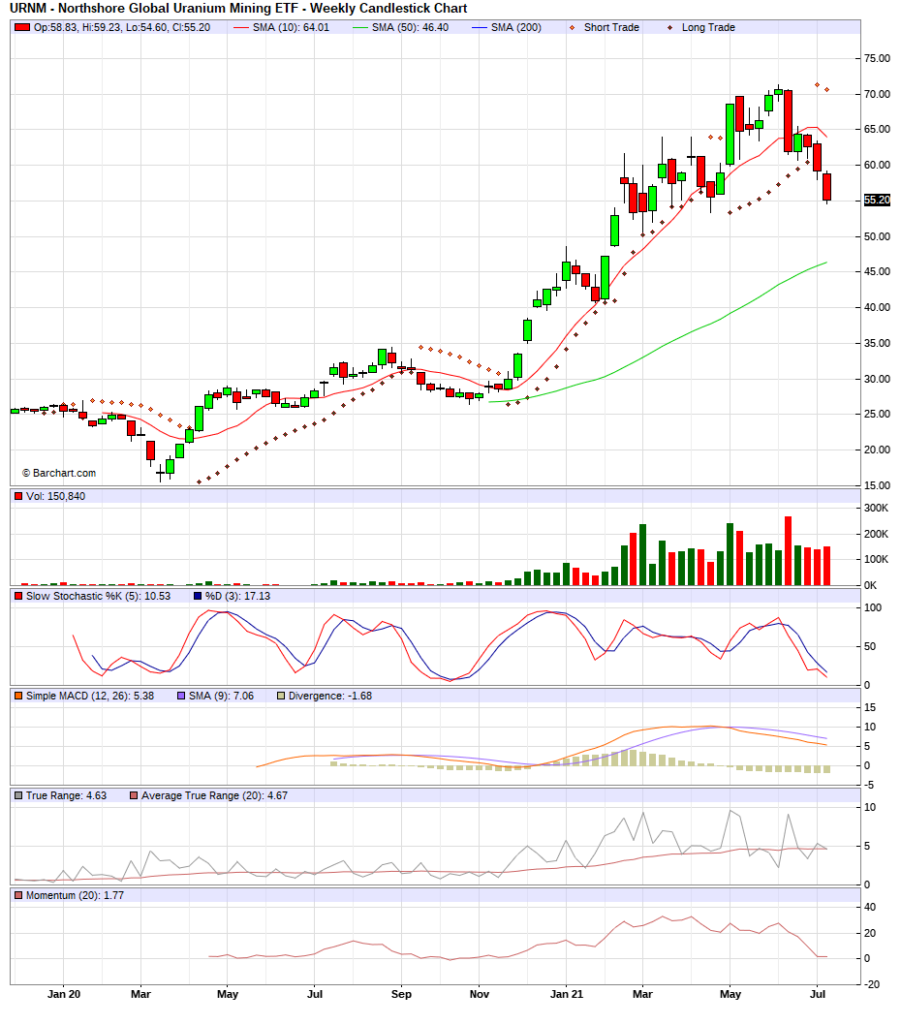
URNM WEEKLY- I use the etf to gauge when to buy the other individual uranium stocks

Notice that most of the charts to follow look similar in how they have made recent new highs, and now pulling back in a correction, just like the URNM etf. Each chart of a different stock will have it’s own areas where I might look to start a position. Some will be near their 200 day moving average, others might be nearing a 50% fibonacci retracement or some other important technical level, etc. The point is when it’s time to start getting involved in a sector, as defined by the leading etfs in the group nearing a buy signal, I start looking for points on each individual stock’s chart to pick my areas to start buying. Then, I continue to look for windows to add until I get up to a full position, as defined by my Total Risk (TR) level. I might buy all, or just one of the following, depending on what happens near term, on what the market offers me. Let’s look at some individual uranium stocks to see what buy signals might present soon.
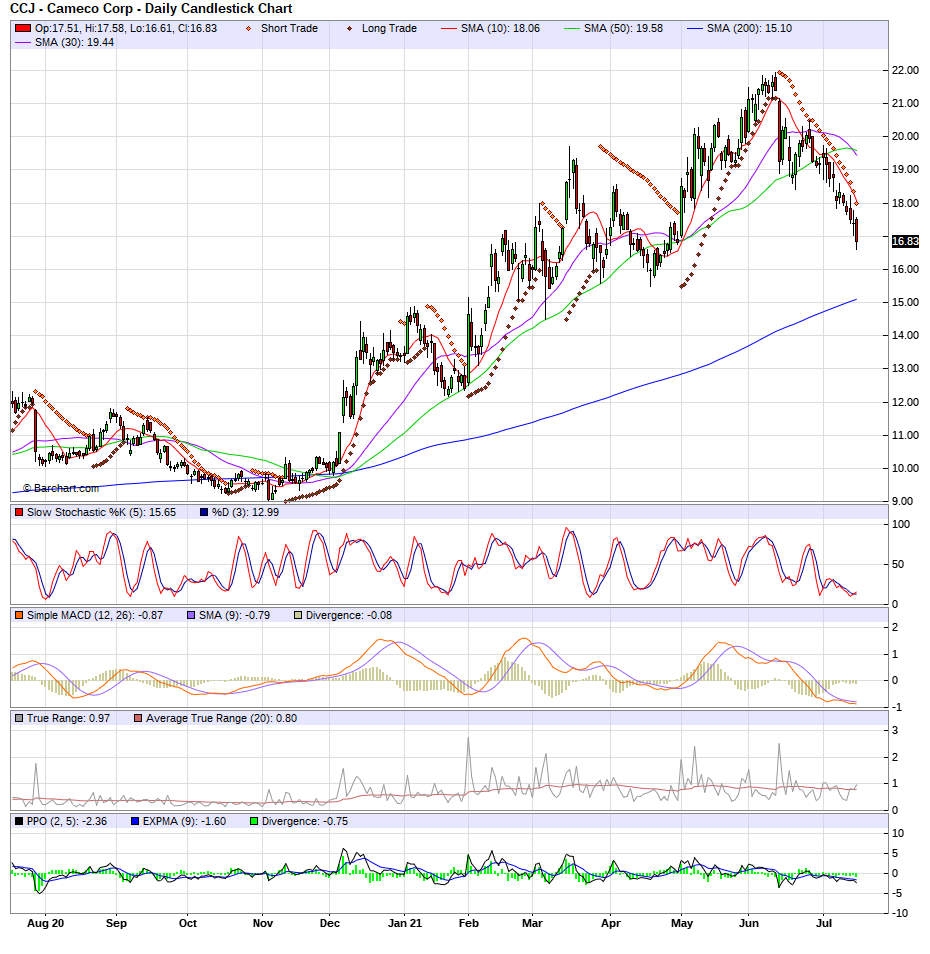
CCJ (daily chart) is the biggest and the best in the sector, according to many, the blue-chip uranium stock

I already cashed out with great gains on Cameco (CCJ) once in this bull market, but I intend to do it again. I will likely use the LEAP call options again, as they worked so well the first round. CCJ is the “easy” play, if anything in this business can be considered easy! Still, I will wait until the URNM etf is on BUY signal before taking a position. If I can only own a few uranium stocks, the URNM etf and CCJ will be among my holdings.
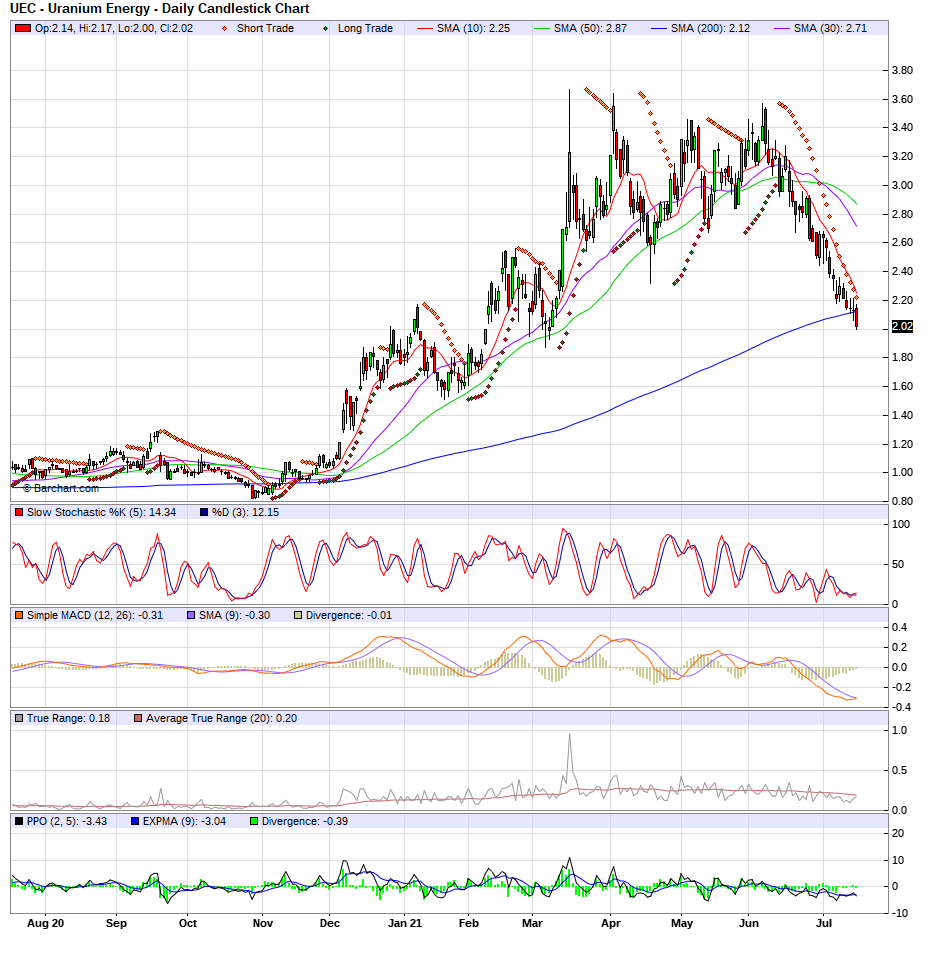
UEC DAILY chart-pulled back 40-50% and already testing its 200 day MA

Uranium Energy Corp (UEC) has a similar chart to CCJ in that they have both made new 52 week highs recently, and are now retreating, but UEC is more volatile so pulling back harder. It’s not my favorite uranium stock as far as fundamentals, but any stock that has corrected close to 50% after making new highs, and in a leading group, will get my interest and energy to look into it further. UEC is on my list of potential buys.
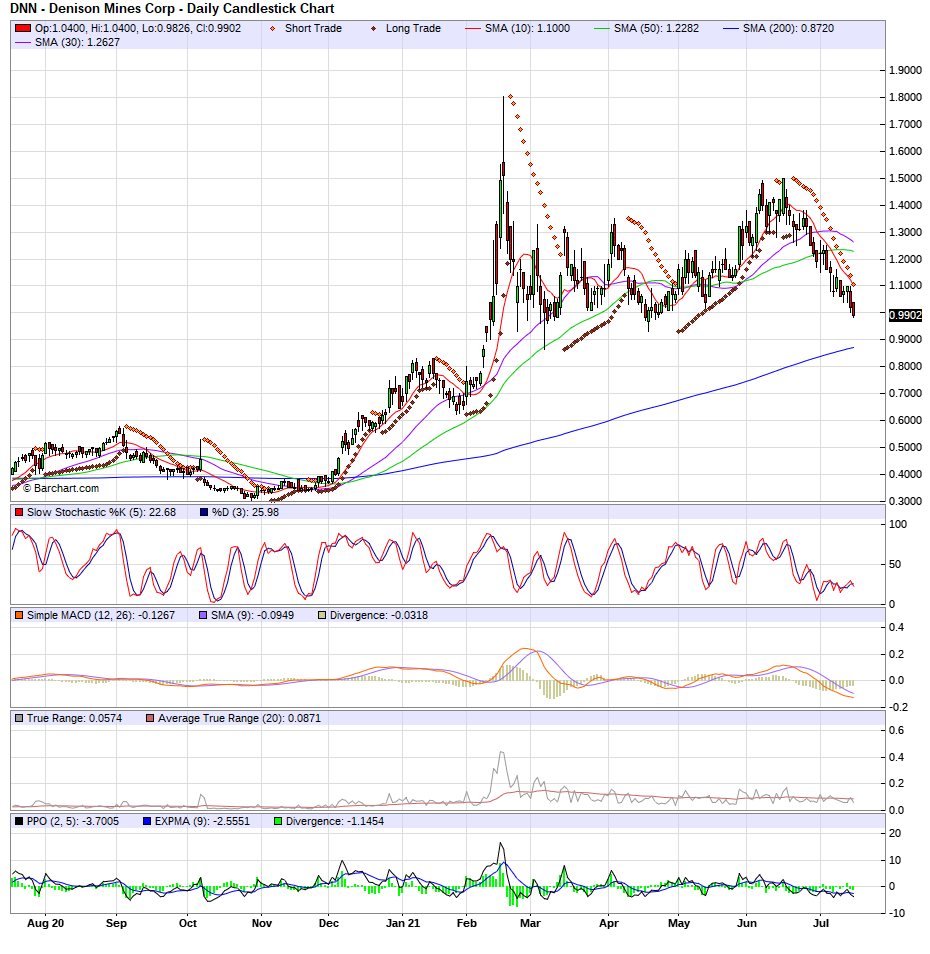
DNN DAILY chart-similar setup, pulling back in strong group with potential support not far away

Dennison Mines (DNN) is another uranium stock that looks to be experiencing a normal, expected correction in a bull market. The percentage moves offer lots of potential risk and reward, when one considers the 52 week high was $1.80 just a few months ago, and now the stock sits under a dollar. That is a 44% correction already, and equally important is the 200 day MA is only a little lower at 88 cents, from Friday’s closing price near $1.00. You will notice the MACD indicators are oversold on these charts too, usually along with the stochastics. With most of the stocks mentioned in this post, I will start by putting in lowball offers since we don’t have a full buy signal yet on URNM, hoping to get some lucky fills form a panicked trader on the wrong side, looking to exit at any cost. 🙂
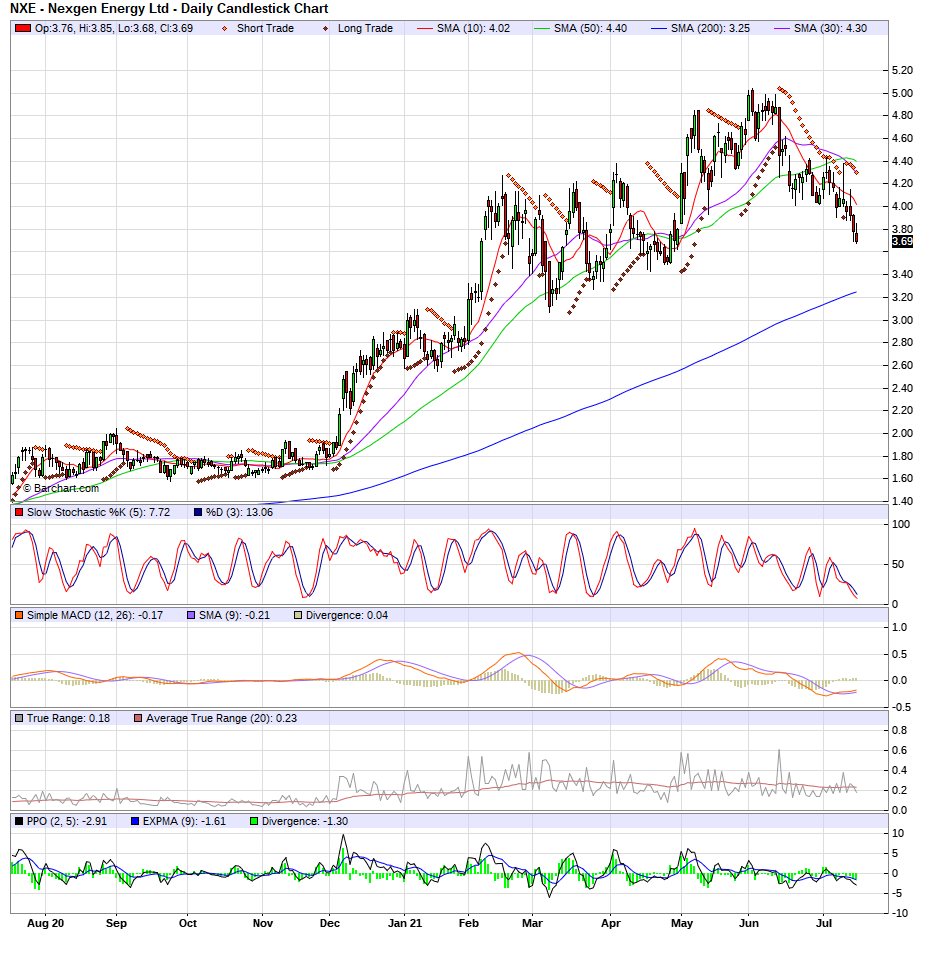
NXE DAILY- Nexgen Energy, same situation, a buy near its 200 day MA

Nexgen Energy (NXE) shows similar price action in the chart as the others I have to take a moment to say these are the best setups in my opinion, when stock after stock in a sector are sporting similar technicals and chart patterns. Here we see NXE is also possibly going to approach its 200 day MA. On any individual uranium stock, I might start acquiring shares at any moment now, as they are not only nearing supports, but also confirming the action in each other. Member have full access to my ACTUAL positions, sizes, stops, and unrealized gains and losses, just look into the tabs above.
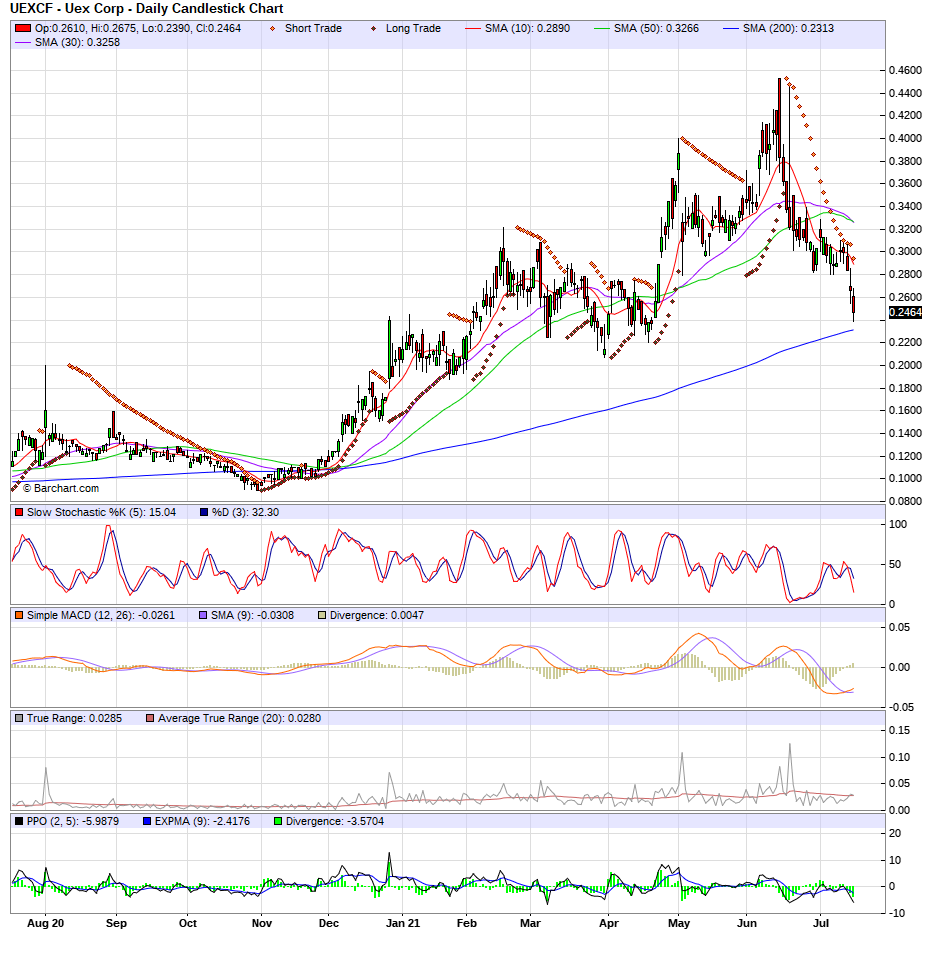
UEX Corp. DAILY chart-closer to its 200 day MA, more speculative, with higher risk and higher potential reward

UEX Corp is even closer to it’s support than the prior stocks mentioned. It has more potential risk, but also possibly more reward. The way to play a name like this is to adjust my position size based on the ATR (average true range). I like this one because it’s another stock in the group that has corrected 45% already, AND just made new 52 week highs a few weeks ago in June! We can benefit from the late chasers who bid the stock up in June, and are now sitting a a big loss, worried about what the next week or two might bring. I will start by putting in low-ball bids on Monday, and know that I likely have time to acquire my uranium stocks, I don’t have to chase, I can wait for them to come down to me at my bid levels, or near the 200 day MA’s, etc.
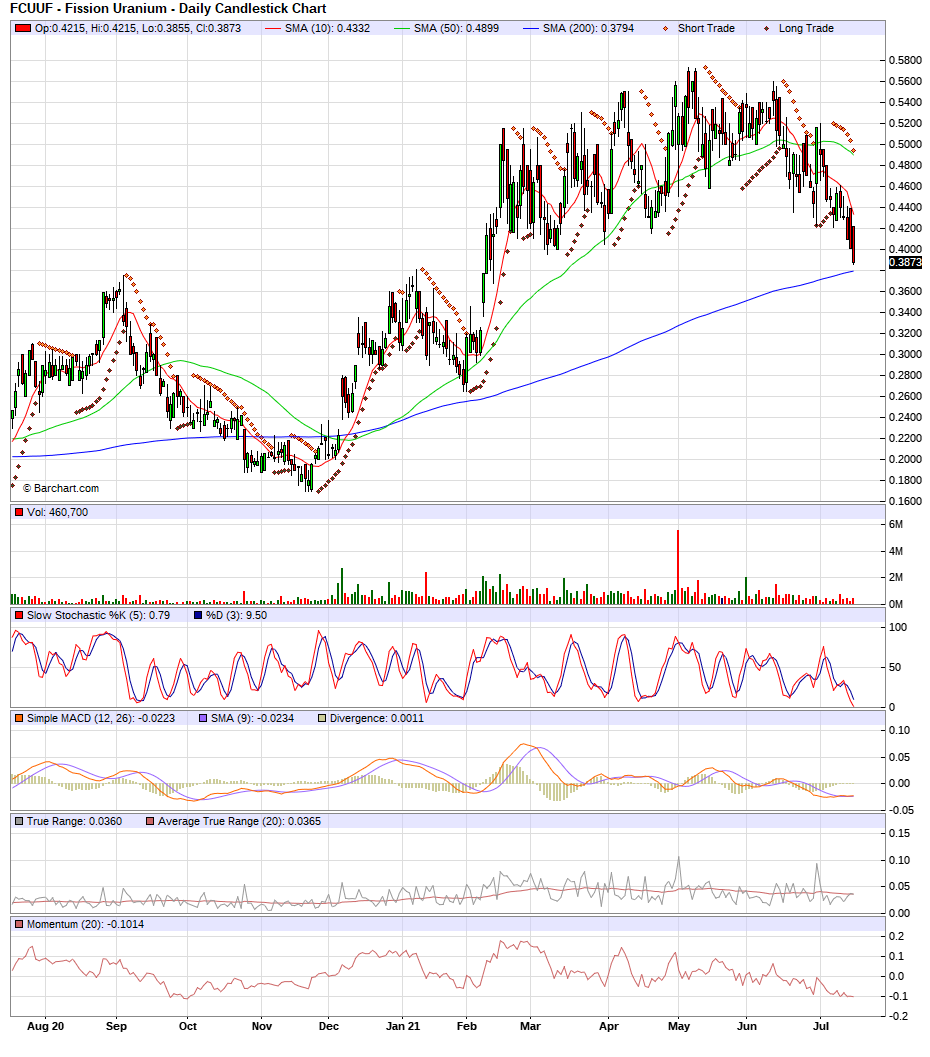
Fission Uranium- FCUUF

Fission Uranium is not only pulling back like the others to its 200 day MA, we can also see that area coincides with old resistance, which is now support) in the 38 cent level. This and UEX are more speculative names, so be sure to size your positions correctly according to your risk tolerance. Position size is the single more important factor in a trader’s results, members can learn more about how I determine correct position sizes for my system in the tabs above. I won’t likely bet too heavy in FCUUF or UEXCF to start, but I could end up buying a lot if the trades are working well for me after I get involved, as I like adding to winning trades.
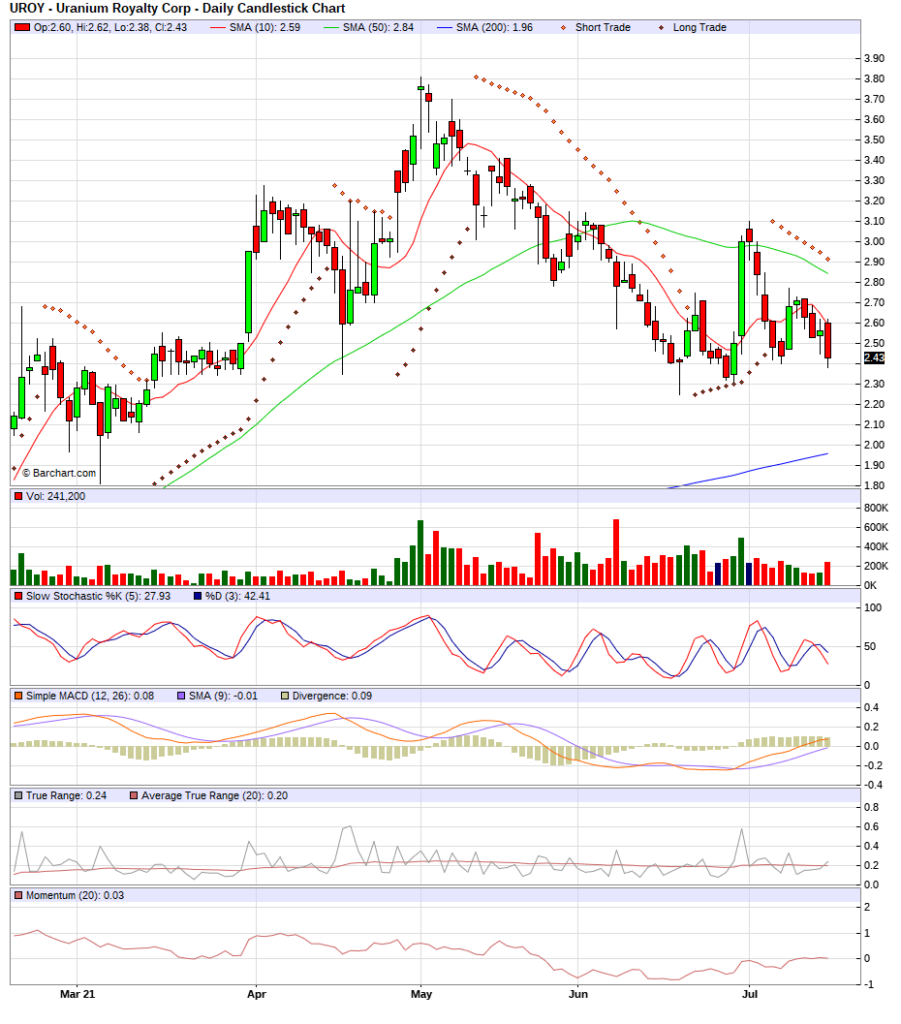
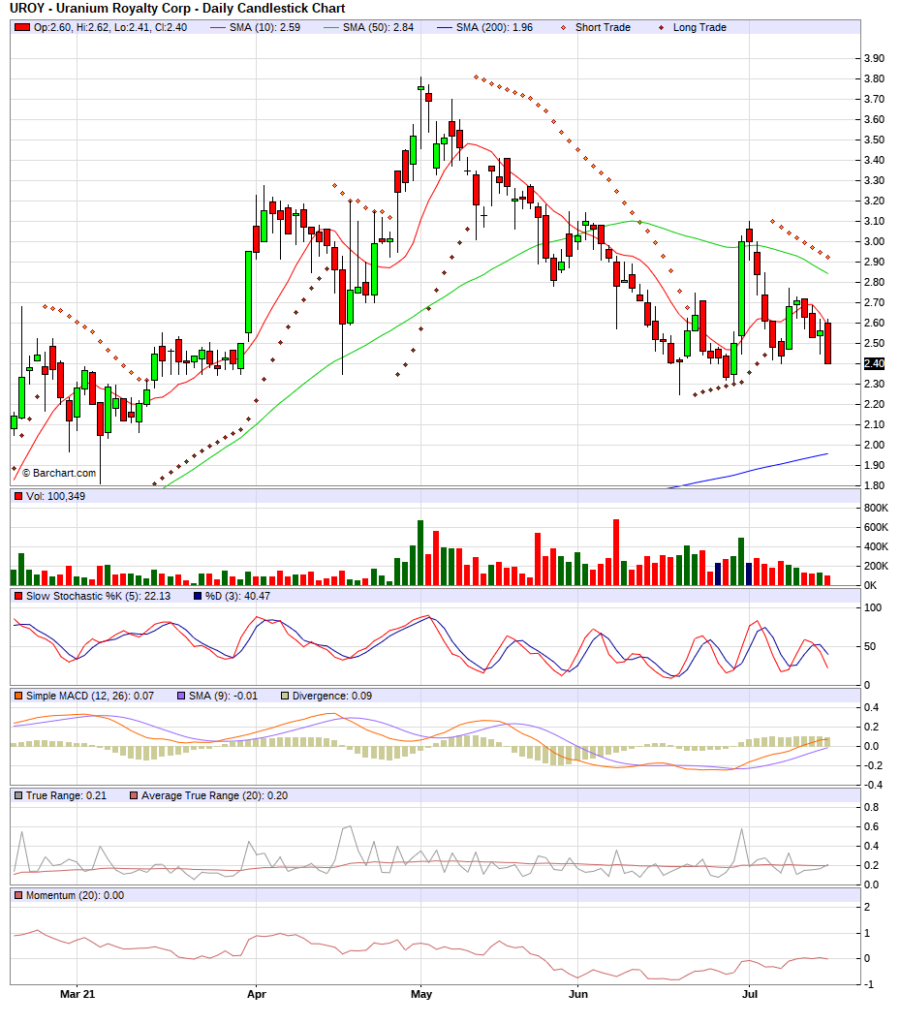
UROY DAILY Uranium Royalty Corp. Already own this one and looking to add

The last uranium stock I’m going to mention today is UROY, which readers have seen mentioned a lot lately in recent posts, as it’s the only uranium stock I own at the moment. Being a royalty company, it should have less risk than outright miners with their concentrated, capital intensive investments. We can also see in the chart that while UROY is pulling back with the group, it is not dropping as harshly, nor is it as close to its 200 day MA yet as the others. I WILL BE ADDING TO UROY, probably before I buy the others, since it is acting better and I will be adding to a winner on it’s pullback, my favorite trade setups. Like with the others, I will put in lowball offers this week and wait for fills to come to me. If I don’t get many fills, I can always decide on which stocks I will pay the current price, UROY is one I would be ok doing that, but I still think I might be able to get it cheaper, maybe close to its 200 day MA. That is down near $2, and while 50 cents further decline does not sound like much, its still a 20% drop from here, so patience is a virtue!

Stopped out of 5 positions!

Miners were weak enough that I was stopped out of 5 miners, and decided to trim a portion of my SILJ holdings. Members can check daily account screenshots for specifics on total holdings remaining, average cost, etc. I was stopped out of the following today….DV.V, PGM.TO, AAG.V, ISVLF, and AMXEF (though AMXEF was not actually a stop out, just close enough to the stop price and small enough position to jettison it). I also trimmed some SILJ, but still maintain heavy exposure at the moment.

When I stop out of positions like this, it does not mean I’m negative on the group or anything in my analysis has changed, its simply that the stock has dropped to a level where I no longer want to hold it to wait and discover what is “wrong”. My suspicion is that none of this is related to the miners specifically, they are down without company specific news to justify it in each case. That doesn’t mean we don’t sell, but it does mean we might even buy them back at some point. I typically like to give them some time before hopping back in, however, of the 30 positions or so that I manage, these 5 have proven to be weak enough that they came down to their stop-out levels.

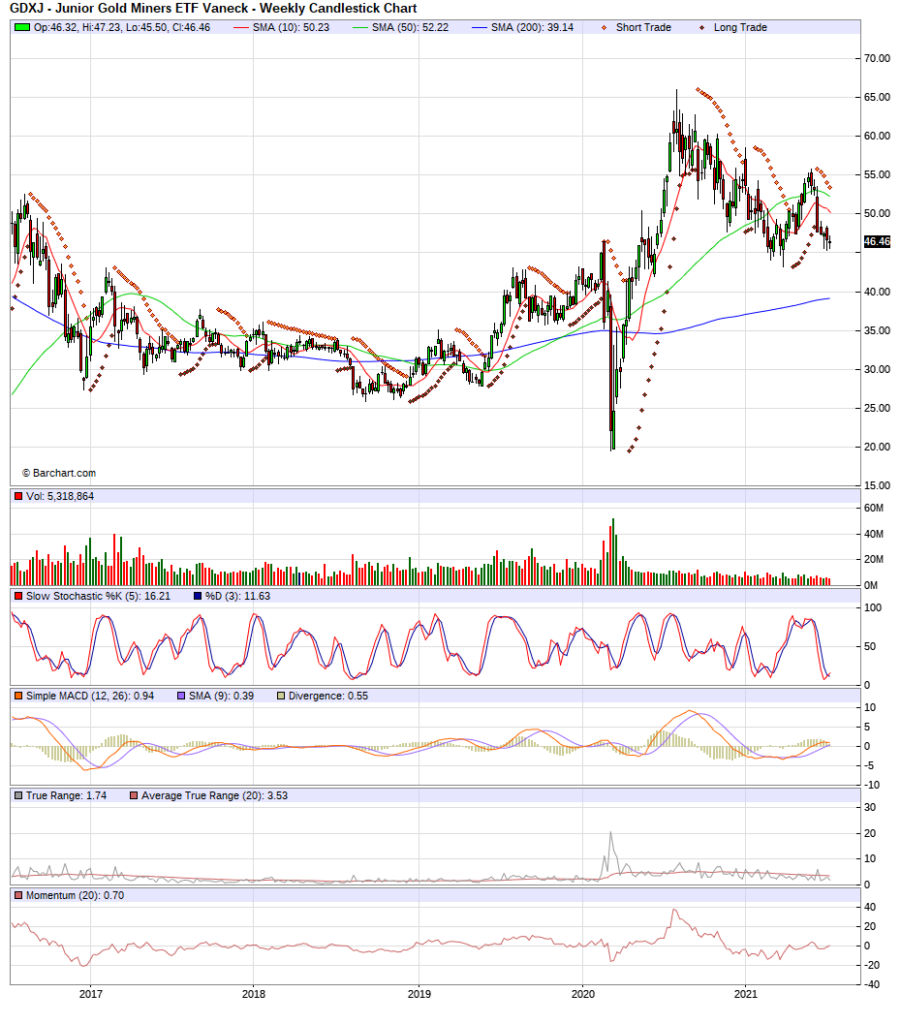
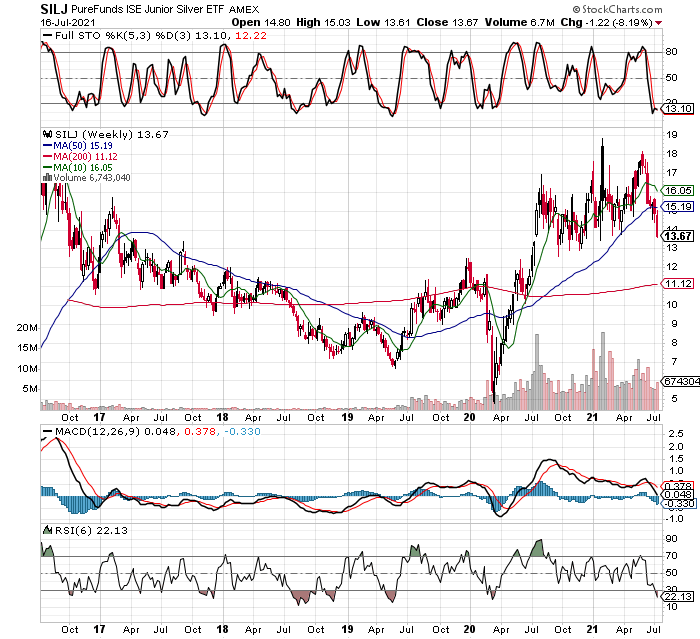
It was a tough week, with SILJ down over 8%! I’m going to leave you with the WEEKLY chart of SILJ, then get away from the computer to keep my sanity! LOL I will have more observations to share this weekend, after I have a chance to digest how the markets are transitioning. It’s possible I might need to make some substantial portfolio changes, for example if the new “delta variant” of Covid is used as an excuse to shut down the world economy again, or shutter mines. For now, I won’t act on fear or emotion, instead will wait for this stretched extreme short term to normalize, then assess how things are shaping up. Losing is part of the game, we must do it gracefully so it doesn’t get out of control, let your stops do their job!

SILJ is oversold on the WEEKLY chart

While SILJ stochastics are oversold on the weekly chart, one could argue its heading down to test its 200 week MA (moving average). I trimmed about 15-20% of my SILJ holdings today, members can log in to see the exact figures, but I remain bullish. I will look to put the proceeds to work again, perhaps at lower prices, or in my best performing miners, maybe in entirely different groups. I need to see if I can figure out what is driving this perceived turn in markets, is it more covid fears and economic slowdown that comes with it, or maybe just a correction in commodity and value stocks? We will know more before Monday, and I’m prepared to make any necessary changes, as long as they are necessary and not driven by fear or emotion!

Added to GDXJ, UROY, and MUX now a full position

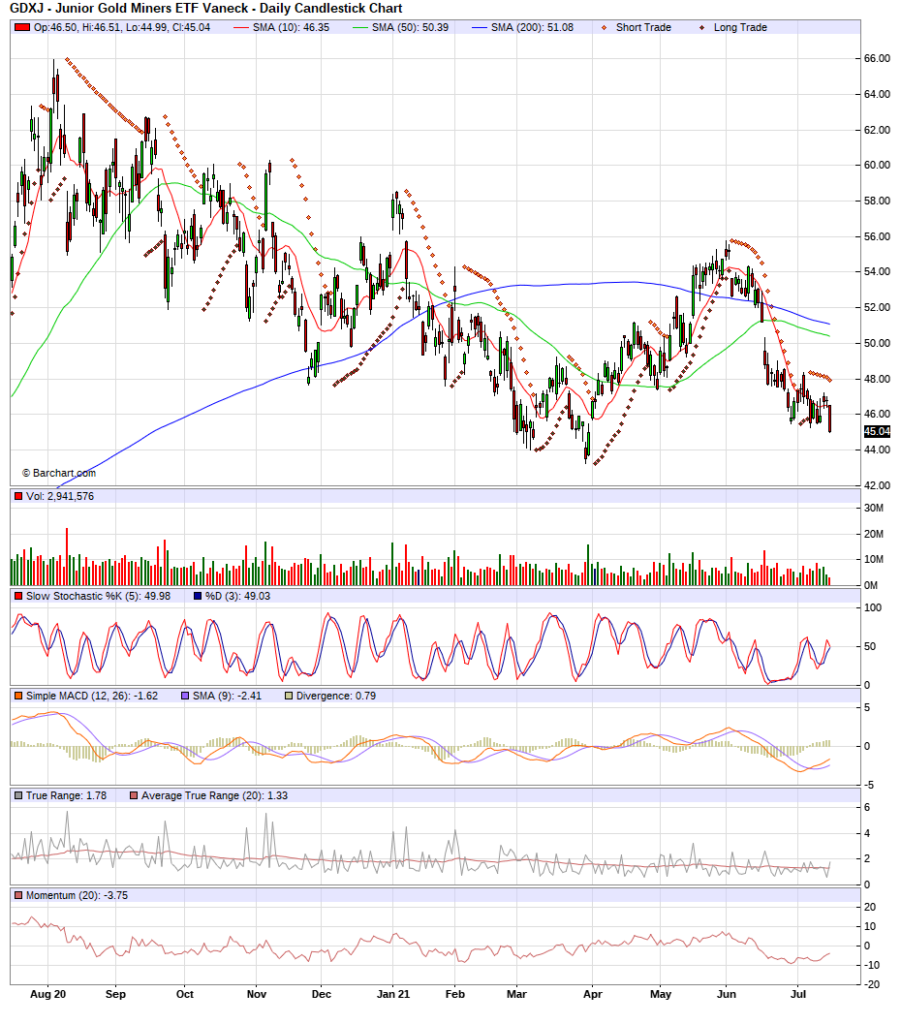
With miners getting hit again today, I am getting fills on some orders to buy I left in below the market prices of the last few days. I added to my GDXJ Jan 2023 expiry LEAP calls (added to loser), and also brought up my MUX holding (added to winner) to a full position now. I am also very close to stopping out of a few positions, will update if it occurs. In the uranium area, I added to my winner in UROY, as I look to bring it up to a full position. Here is the daily chart of GDXJ, sure looks ugly, but they always look their worst before they change for the better, just like its always darkest just before dawn. This has been a relentless pullback, lets see if I can survive it, even make money from it!

GDXJ LEAPS expire in Jan. 2023, plenty of time to work
UROY-Uranium Royalty Corp, continue to buy

Members get specifics like stop levels I’m using, average prices paid and total position sizes for all holdings, as well as unrealized gains and losses with their subscription.

Sold PSLV at loss to move to Miners

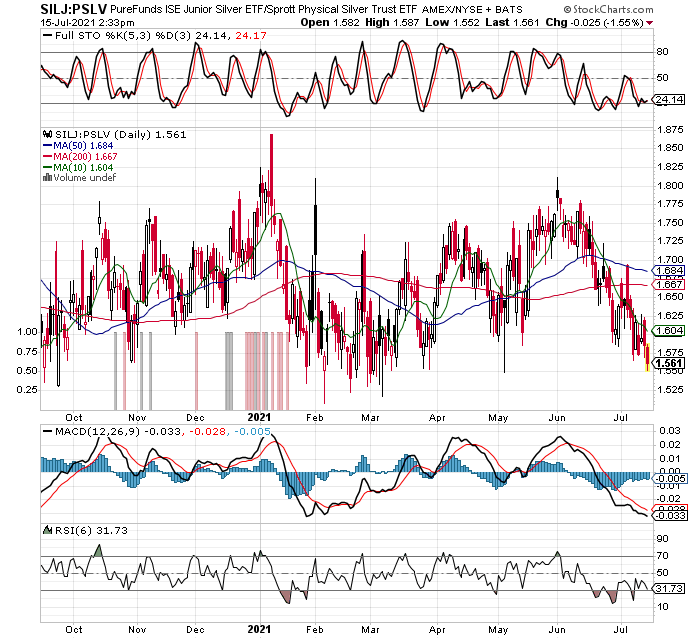
While I am not stopping out of PSLV etf (Sprott Physical Silver etf), I keep an eye on the ratio between the miners and the physical metals for times like this where one outperforms the other drastically. It can be a good time to make the switch to a different, but related investment. From the chart below you can see that physical silver has been doing much better than it’s miners for awhile now. I will take the bet that this ratio is overdone and soon we will see the relationship reverse like usual. In this case I’ve decided to liquidate my PSLV holdings and will use the proceeds to get more invested in silver and gold miners over the next few days. The first stage, the sale is complete, now I just need to get the money back to work while miners are trading at low prices. The list of prospects has been mentioned here many times already, like I have already added some more MUX (McEwen MIning) today, and though not a silver miner, I added copper royalty company NOVRF (Nova Royalty Corp) on this decline today. I might even put the proceeds into an etf like GDXJ or SILJ, if individual names don’t offer up a buy opportunity or start to move higher without me. I also have had a bid in all day for more WLBMF shares (Wallbridge Mining), and Canadian junior gold explorer. Here is the ratio chart of SILJ:PSLV, note it is “oversold” on the daily stochastics, but know the weekly chart stochastics are as well.


SILJ:PSLV ratio shows how silver has outperformed silver miners since June 1

I am also close to stopping out of a couple junior miners, and will keep members posted if I sell. I will continue to add in the pullback to MUX until I get a full position, it’s almost there. I’m still looking to add to every name I have been buying recently, it just depends on which one is offering up the best opportunity each day. Members can see the loss I took on PSLV today, as well as my revised stop levels, and new total position sizes in the tabs above.

Putting bids in for GDXJ, ATUSF, and others

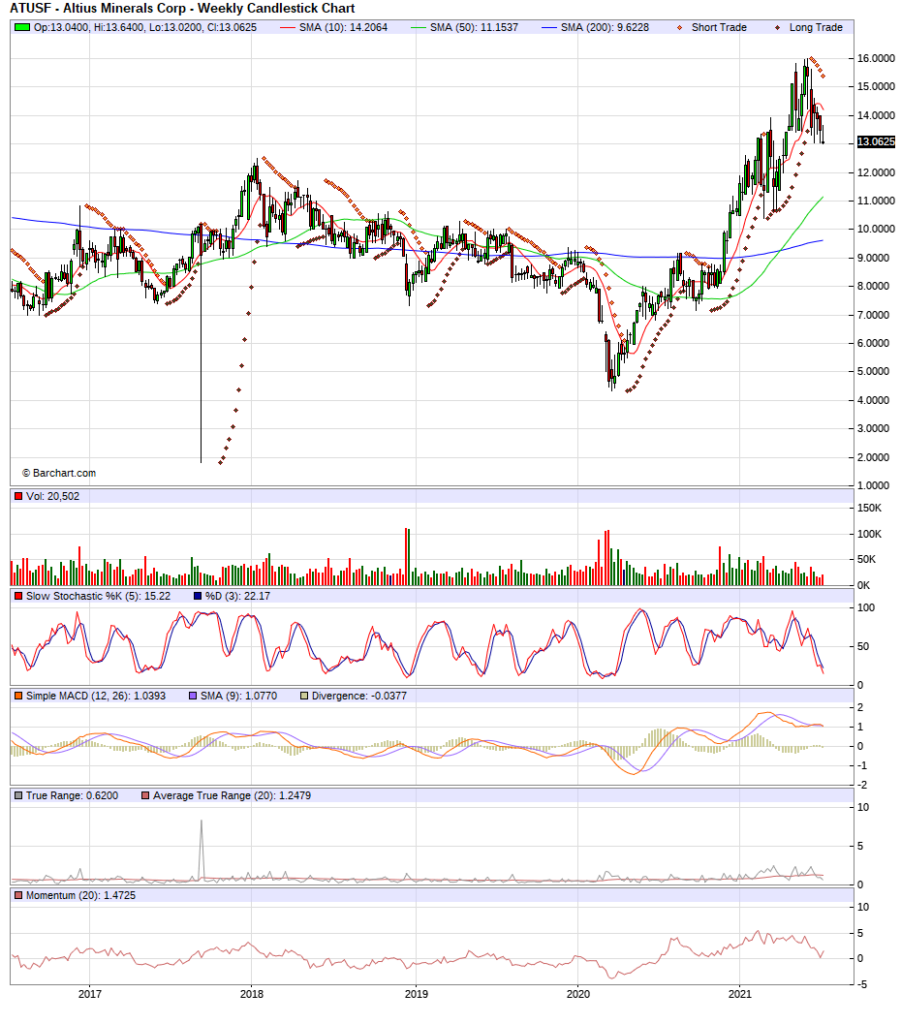
Please note I’m using the weekly charts in the charts below, because that is the time frame with the most attractive signal at the moment, the most oversold technicals. With regard to GDXJ, I already own some LEAP call options not expiring until Jan 2023, so I will likely focus there for my additional purchases. As usual, I will bid for them and be patient since there is no rush and miners have not yet proven they can hold their strength each day of late. If I get filled on the GDXJ LEAPS it will be adding to a losing position, so requires I keep an eye on it, since with more size but the same total risk I’m allowing, it means I give each LEAP less room on the downside before stopping out. In any case, I still have example room being I am not near full position in this idea yet. Weekly chart below…

GDXJ LEAP call options, looking to add but at my price only

Another stock I’m interested in buying on the pullback is Altius Minerals (ATUSF), another commodity play and Rick Rule’s favorite stock as of a month or two ago. I saw one of his interviews on youtube, and he was very positive on the fundamentals, visit the company site to better understand what they do at altiusminerals.com

Again, we see the stock is oversold on the weekly charts, and also made new 52 week highs not too long ago, typically a good setup in my trading. I’m not buying at the market, but sitting on a bid below the current price, hoping for a drift lower to fill me. Patience pays, either I get filled at a great price, or I don’t, and I just scope out the next opportunity that is always around the corner!

Altius Minerals, a little lower and I want to buy

These are in addition to the names mentioned in prior posts over the last week or two, like MUX, KWEB, DSVSF, URNM, etc. Members can see all changes, buys and sells, and adjusted stop prices, along with unrealized profit and loss and total position sizes in the tabs above.

Added to WINNER in MUX, update, and some charts of interest

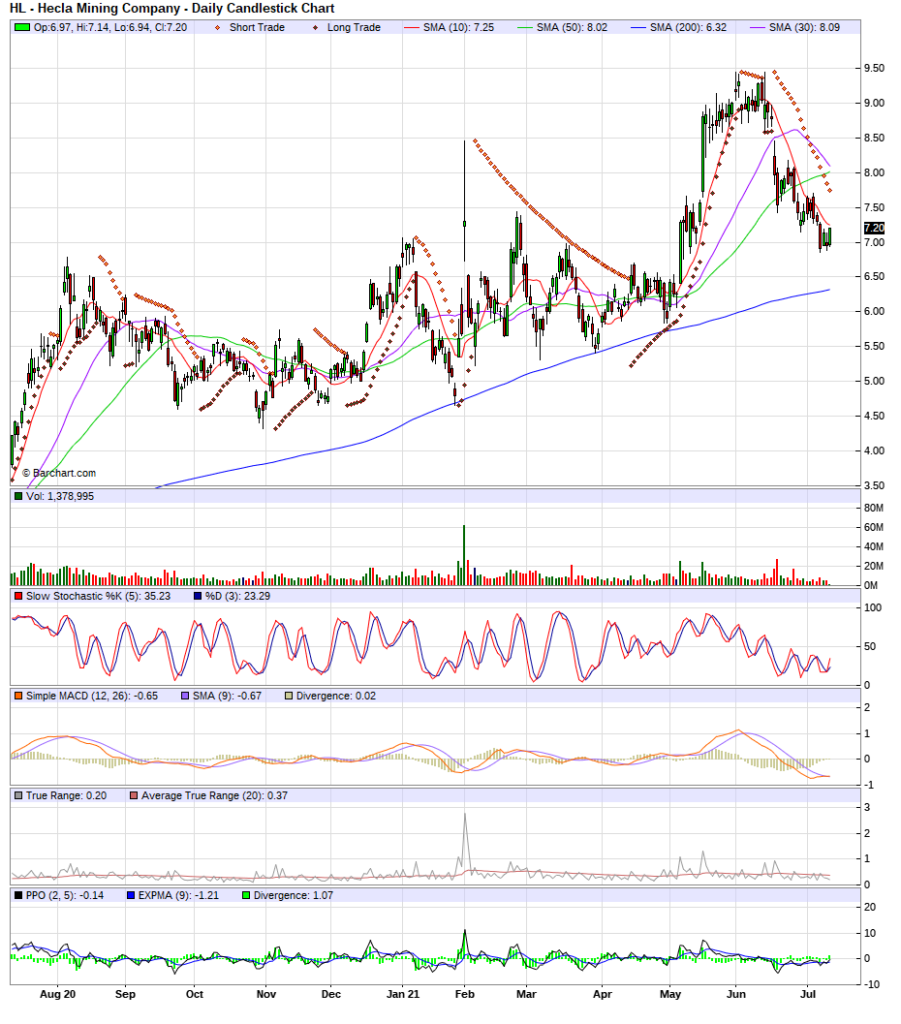
So far, all I have done today is nibble on some more shares of MUX, adding to the pile and now right up near a “full position”, as defined by my total risk on the position. Should the stock go higher, I can always add easily as long as I keep my total risk fixed. Some recent leaders in the mining group are looking as if they want to stop dropping and maybe turn higher. A chart of interest to me and representative of my observation, is a stock like Hecla Mining (HL). While I no longer own this one outright, it is a large holding in the SILJ etf, which I am heavily invested in. Take a peek at the chart,and notice the stochastics, MACD, etc all oversold and turning higher on this daily chart, but its happening on the weekly chart as well, for those that need even more confirmation.

Is HL getting ready to start a move higher? Many miners look similar.

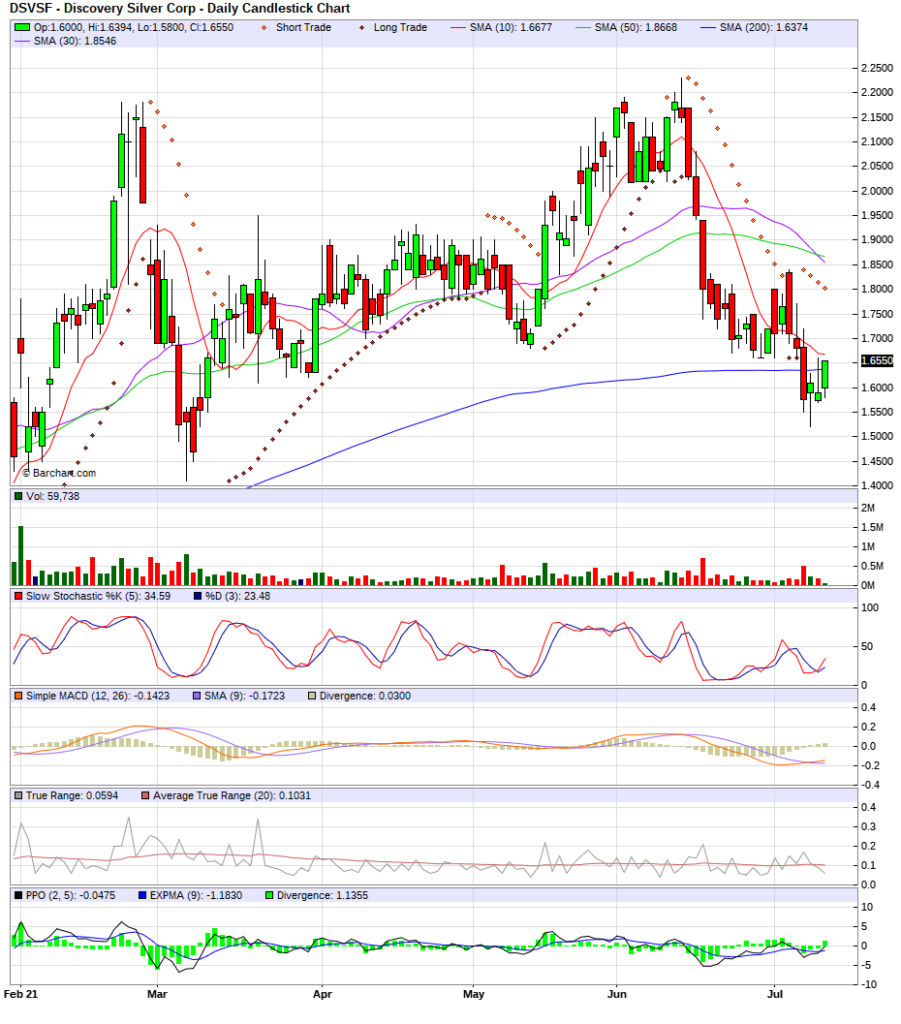
Another one I mentioned yesterday was DSVSF (Discovery Silver) as one I wanted to add to my holdings, but today we see a classic “false breakdown” below the 200 day MA on the daily chart. If this strength can hold or build on itself, DSVSF is another that looks as if its decided to turn and go higher for awhile. I already have a full position on this stock, but long time readers will know I often go over the amount of shares I originally planned based on my total risk, as long as I keep my total risk fixed I can get bigger positions because I also have unrealized gains as part of the cushion. This allows me to get much more aggressive in winning positions, meaning positions in which I have unrealized gains. Nice chart, take a look.

DSVSF springs back above it’s 200 day MA, was that a false breakdown?

Unfortunately, I was a little to stingy with my bid prices yesterday, so didn’t get any extra shares in KWEB (up 4% as I type), or NOVRF (jumping another 9.5% so far). While I already have decent sized positions, on the items I wanted to add to, I will now have to make a decision whether to add into strength or not. I will decide before the close, can always add later in the week, as well. Let’s see what sets up, or if we get a mid-day pullback to let me buy more shares. It might just end up being one of those great days for a trader, where he can sit back and watch his accounts grow without doing too much, since all the work was done ahead of time! Members should check the other tabs above to find current stop levels when they have been adjusted, and position sizes, unrealized gains and losses, etc.

Added to a WINNER in MUX on July 12, 2021

I added some extra shares to my MUX position today on this little pullback, I expect to get some extra NOVRF shares before the close as well, but won’t post their charts again since I’ve shown them enough in the last week. I’m currently slightly in the red with NOVRF, so it I get some fills this afternoon, it would be “adding to a loser NOVRF“. 🙂

Some traders will never add to a losing position. I understand the rationale, but have found some of my best positions occurred when I built them over time and at lower prices as I was buying into a pullback and getting better prices. However, this does not mean I don’t respect total risk, I still try to maintain my overall risk in a position close to my starting risk levels. So in this post I have added to both a winning trade and a losing trade (trying on the latter, though no fills yet).

Trying to add to a WINNER in DSVSF

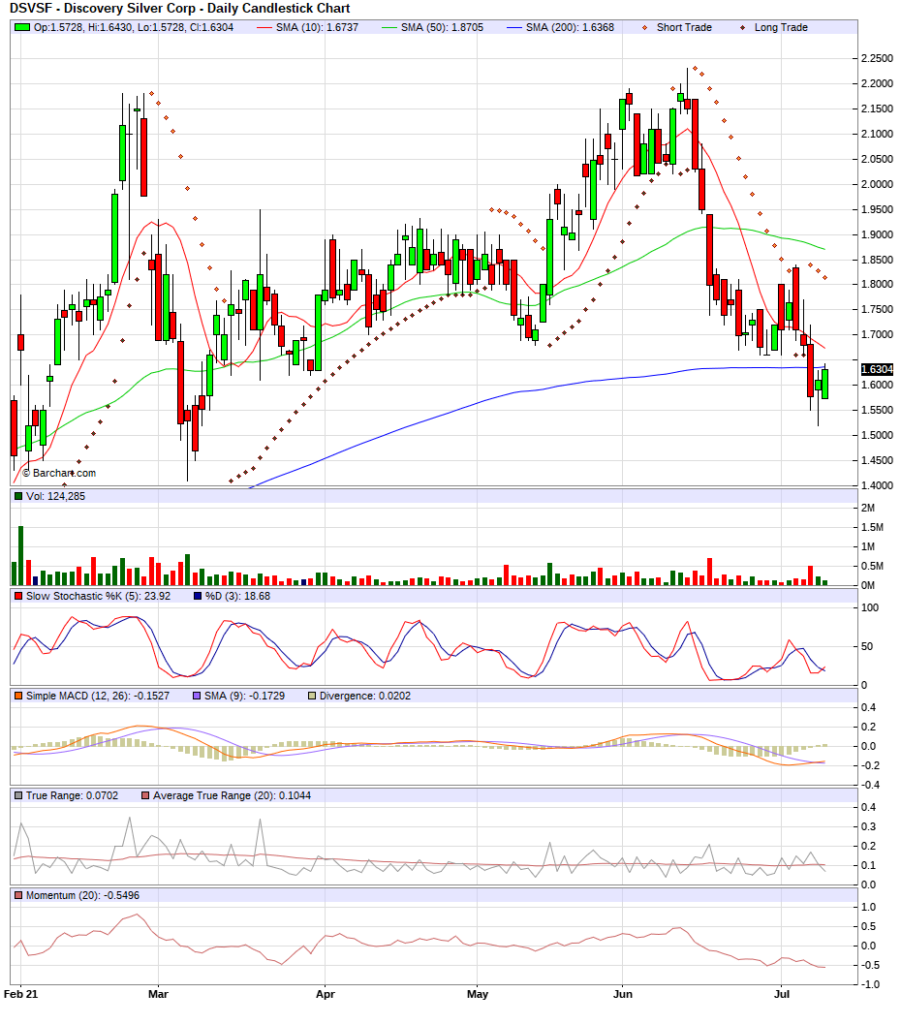
Discovery Silver (DSVSF) is a silver exploration company that has treated me well so far, even after the recent slide lower, I still have unrealized gains in the 30% area. Members can verify the specifics by viewing the daily snapshot of my managed account, which shows in detail everything one needs to know in order to follow my trading decisions and their results. I haven’t mentioned DSVSF lately because it was climbing higher for a long while, and outside the areas I would consider adding. After the pullback, its now coming into a zone where I will consider adding, though still just “on the bid”, meaning I am not in any rush and just bidding for stock, waiting for it to come to me. Let’s see the chart…

DSVSF-still up a lot, but one of my favorite setups to add to a winning position.

So I am sitting below the current bid by a little bit, waiting for possible mid-day market gyrations to pull it down and fill my orders. If I don’t get more shares today, the same strategy applies over the next few days while I have DSVSF in focus. On the other hand, if it just starts higher now without giving me extra shares, I’m already well invested in this one so can live with that option too! Before I get too many emails asking, the stock sitting just below the 200 day MA does not bug me in the least. In fact, I’ve come to learn that more often than not, support and resistance areas will hold, rarely are they just lines in the sand. With the stock sitting below the 200 MA, my bet is a few weeks in the future, its probably well above the moving average again. It’s just an observation, and it wouldn’t change my bet even if the stock were still below the line, as everything in a trade like this now is based on my TR (total risk), not patterns, cycles or anything else. The market has already shown DSVSF to be a good one, its enough to know with proper risk control.

MUX is a similar situation in that I am sitting on gains, but not as much as DSVSF. In any case, I’m bidding for more MUX as well. Members check snapshots of daily accounts to see what moves were made, and how it affects the numbers, stops, etc on the account. Please remember that I rarely fall in love with a stock, that can get costly. If I repeatedly mention a company several days in a row, its only to let readers know I am still adding, it in no way implies I like the stock more than others mentioned, or any others in my portfolios. Its simple time for action in that name, and I’m stalking the trade.

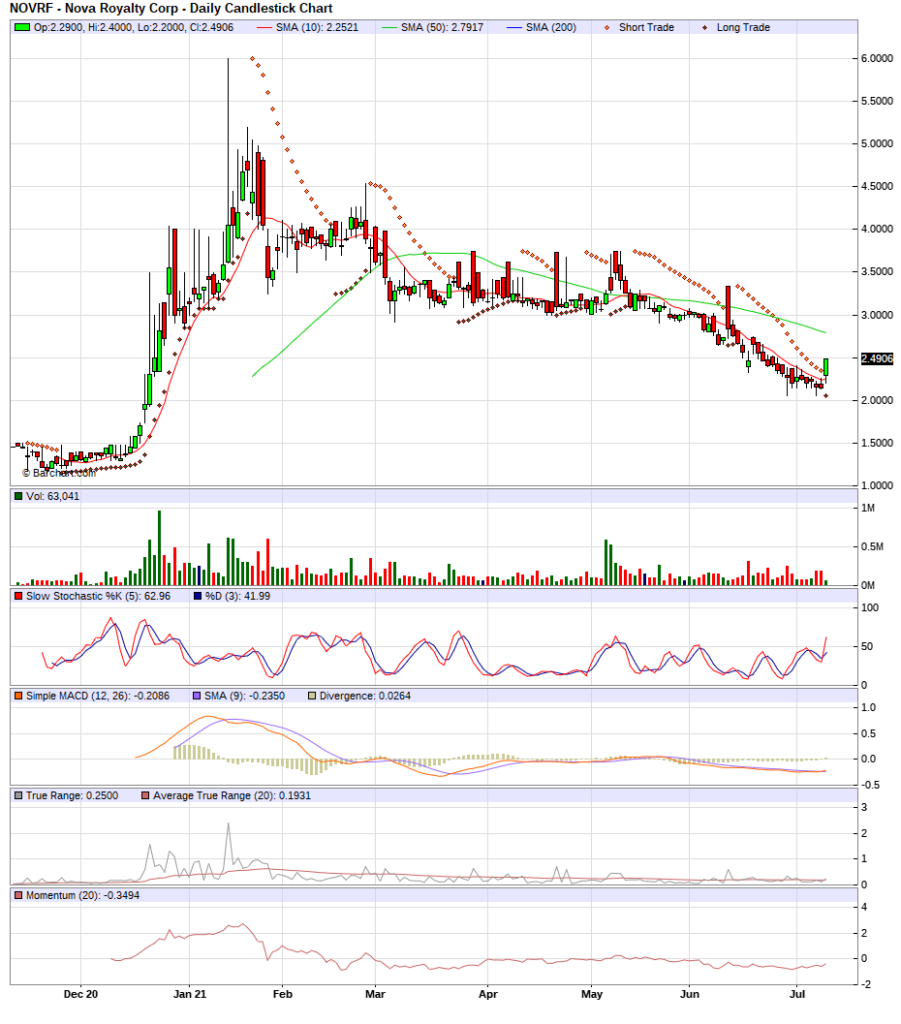
Stink bids in on NOVRF, KWEB

I haven’t made any changes yet today, but put in “stink bids” (low-ball bids) on both NOVRF and the KWEB etf. I will post the daily NOVRF chart below, but in each case we now have a good, strong reversal day. Today its NOVRF up over 16%, and Friday it was KWEB tacking on over 4%, so these two seem like they are trying to turn the corner, which means I want to get up to a full position as soon as possible as long as at favorable prices. Long time readers know I hate chasing a stock by paying, but in NOVRF’s case, you can see its the first good day in a long while, so I’m definitely not paying up on it!

NOVRF seeing its first real strong day in a long time- see last bar on right side of chart

The KWEB etf is pulling back today a couple percent, after having strong Friday. There is lots in the news about the Chinese government cracking down on internet giants over there, but it’s hard to put price on news, so we will let the charts remind us what to do. I’ve posted enough KWEB charts and nothing much has changed, just the price. Let’s see if they can push it a little lower and give us some great fills at low prices. As always, members should check revised stop levels, position sizes (most important), and unrealized gains and losses on the tabs above. I post DAILY screen shots of the typical account I manage for friends and family, a trader should find this very useful and informative, and it can not just make them a lot of money, it can save them from some grave errors like cutting winners too soon.

New video with Rick Rule worth watching

Rick touches on several commodities with focus on silver

SIGN UP FOR UPDATES

NO SPAM, EVER!