China imploding, added to loser KWEB, winner MGMLF, and a little more MUX

I might as well start with the Chinese internet stocks, as they are in the news and continue getting demolished. I don’t often trade off news items, but of course I consider them and how they are affecting prices. The news out of the government in China is nothing short of economic suicide, with over $1 trillion lost already, I think they started this campaign in February or March or 2021. I try not to let headlines force mistakes, so while the KWEB etf has come down enough that I could justify cutting it loose, since I am still not in a full position as defined by my total dollars at risk, I am willing to keep looking for spots to add, in order to bring me up to full size. I choose this route because these can be big winners, after such devastating declines on the charts. Note that my accounts are not devastated by the China events, just the the chinese stocks are, so we should have a big bounce play here soon. One after the other, chinese internet giants are getting taken out back and shot in the head, today saw Tencent Holdings ADR down over 10%, and that sounds bad enough, until you look at the chart of the last few months!

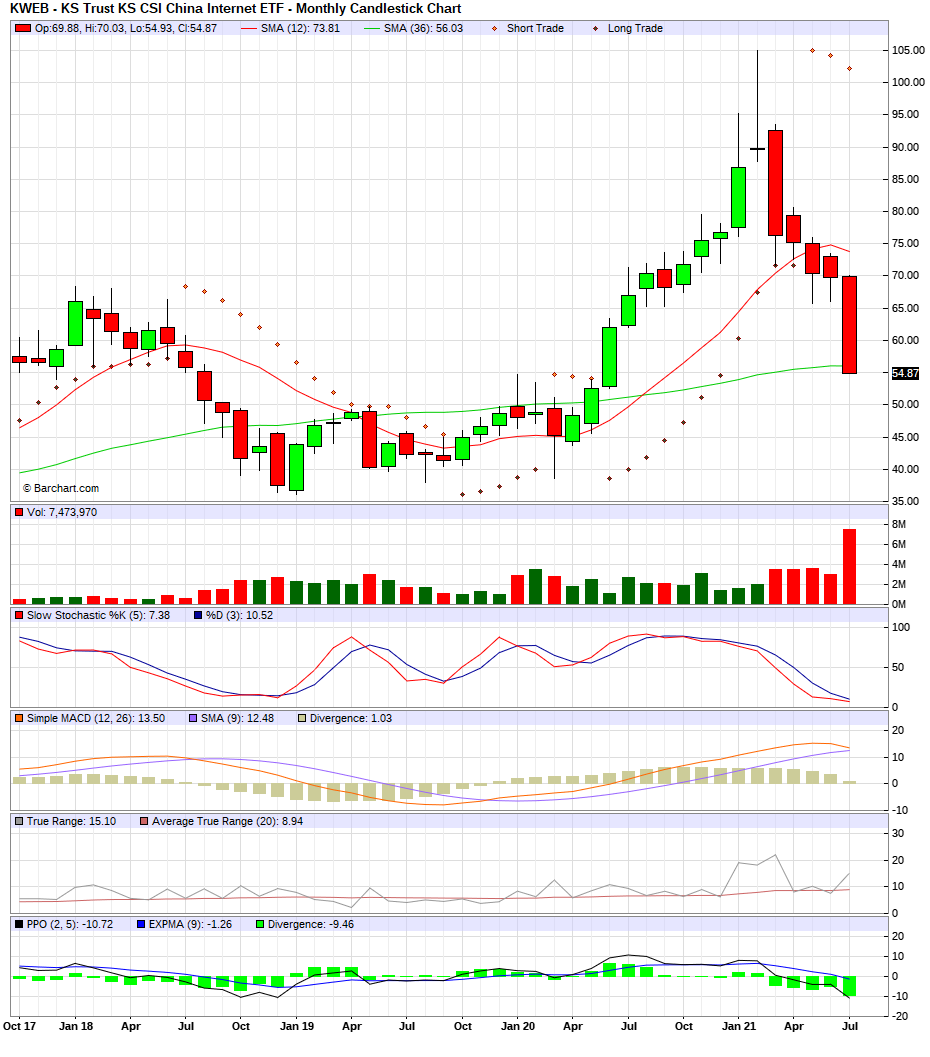
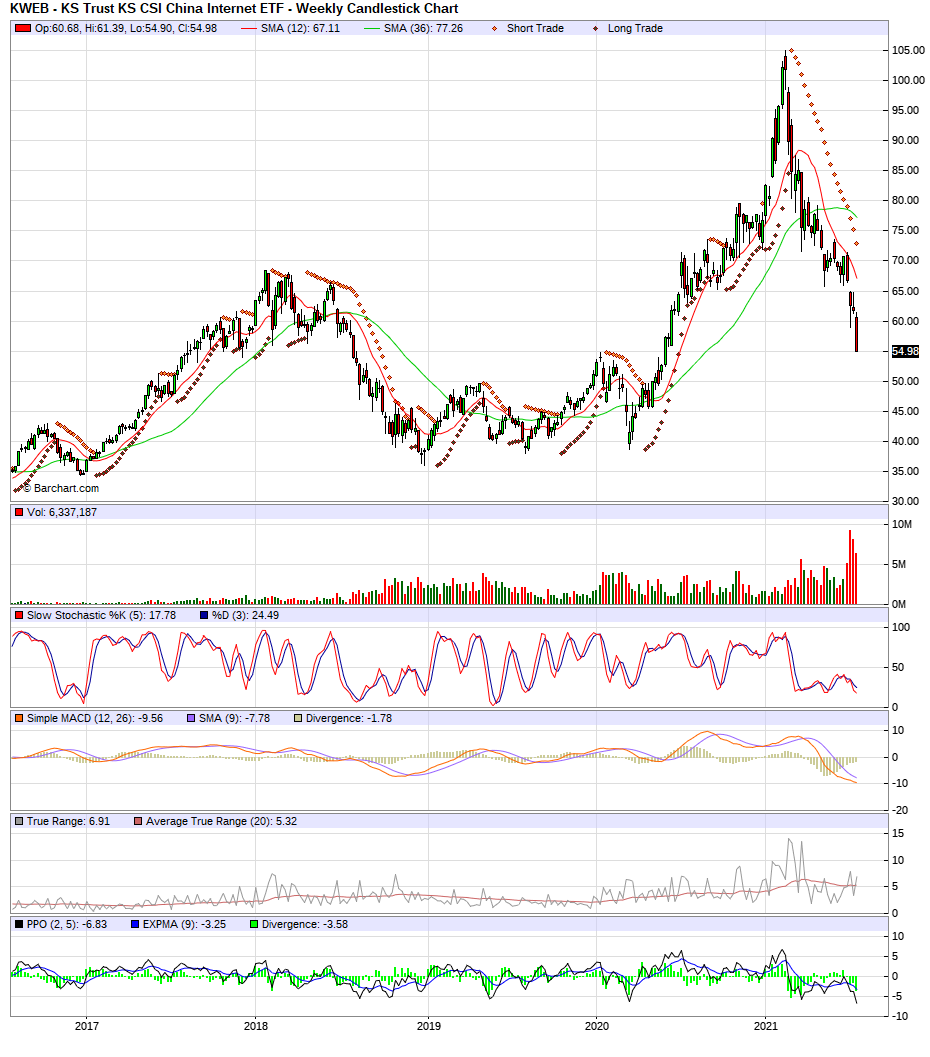
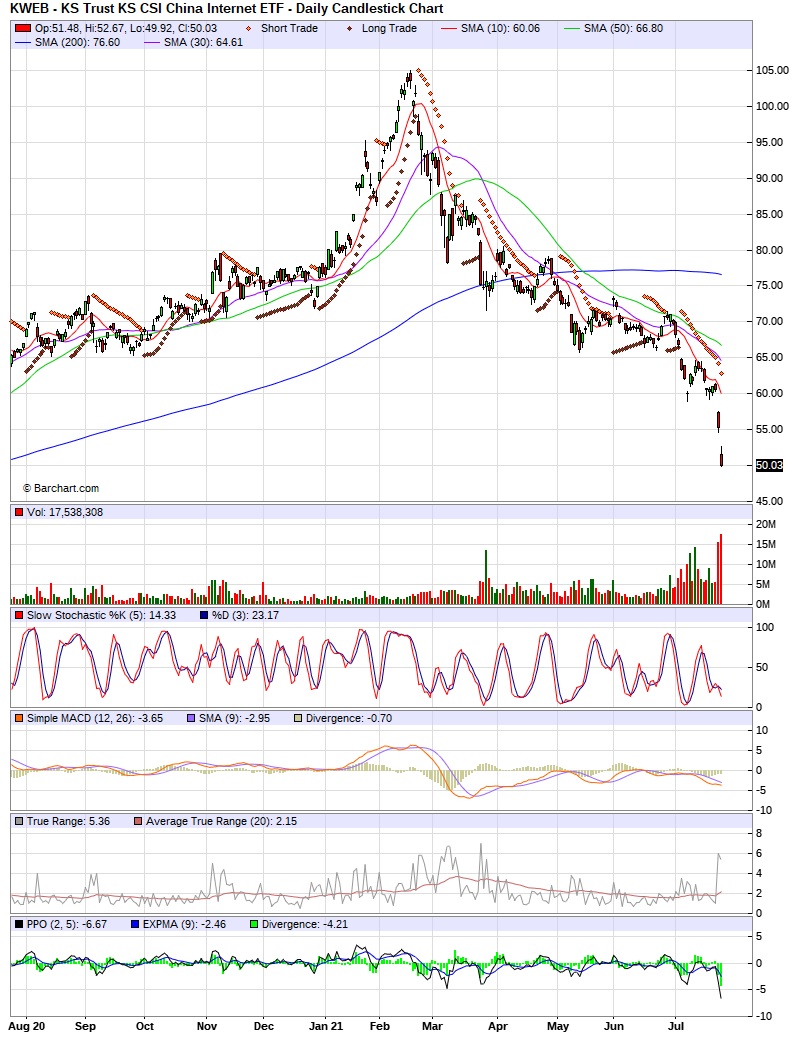
So this is an interesting situation that I might as well address right now, because I am sure to get lots of questions regarding how I handle a stock that drops to my stop out level BEFORE I even have a full position size? It’s pretty simple, if my total dollars lost are not yet at my Total Risk level, I consider the trade still valid and active. In fact, I like to buy at the cheaper prices, however we must keep an eye on such stocks as there is something much bigger happening than what charts typically tell us. That does not necessarily mean it’s a negative, it could be a huge winner depending on the news flow, but we must admit that we cannot know so early, otherwise the KWEB etf and it’s components would not have gotten hammered so hard to begin with. I will continue to build up to a full position, and always keep my total risk amount in the back of my mind. I hope I’m not stopped out of KWEB, being it’s already suffered so much that I think the upside could be very substantial as soon as the bleeding stops. Let’s see if I can stay in it long enough, and without losing too much sleep, before its starts screaming higher as everybody looks for bargains they threw out yesterday! I’ve already posted it many times recently, as my buy orders got filled here and there, but let’s take another look at the daily chart, then the monthly chart to step back and get the bigger picture. Suffice to say, if a trader can be invested in such a terrible looking chart and still make money on the trade, he is adept at risk control and money management. Heck, if they can lose just a little on such a horrendous chart, they are likely a very profitable trader overall. KWEB daily and monthly charts:

KWEB DAILY-looks like no end in sight for the drop, but it will turn before long is my bet

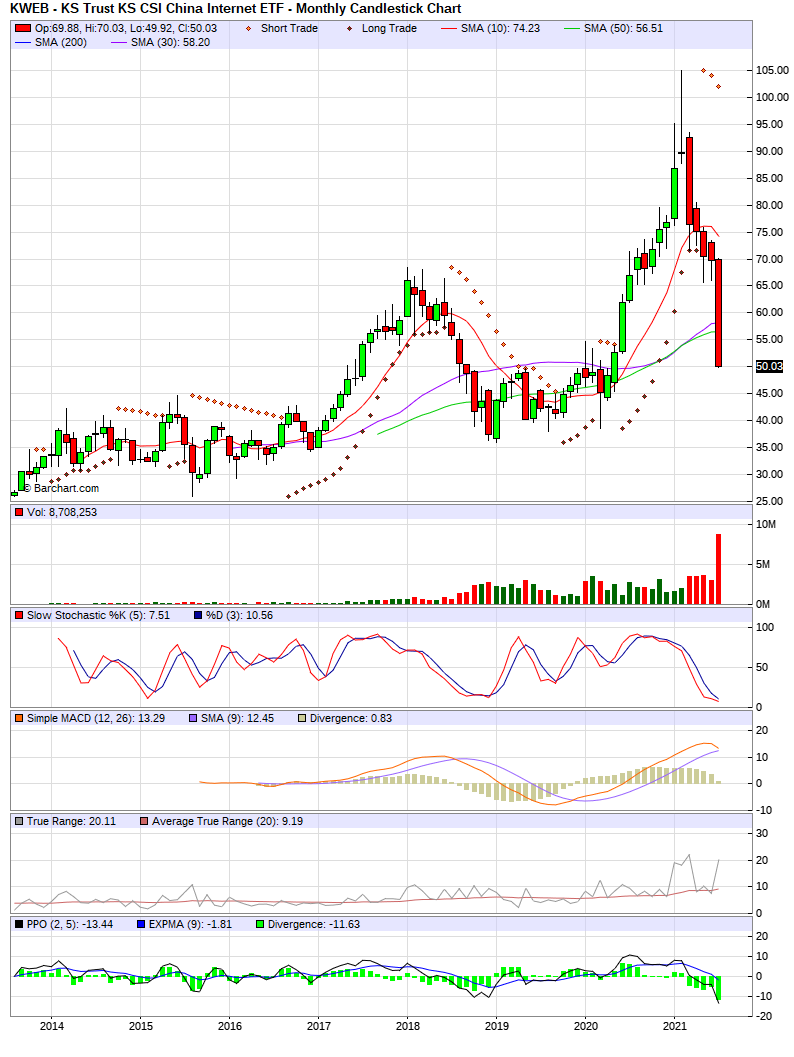
And here we have the MONTHLY KWEB chart, equally as ugly, which is pretty rare in this business!

KWEB MONTHLY, if one can stay invested and not get shaken out, these can become big winners

The final take for today is that I will keep it simple and trade KWEB like I would trade any other setup. This could end up being a huge winner with so much potential, maybe we have bought the leaders in China’s e-commerce at bargain basement prices for many years, or we might be too early and get washed out along with millions of other investors that are hating these stocks at the moment. It’s ok, we don’t care about any one trade more than the next. We want them all to work, but realize that isn’t what will happen, we will win, we will lose, we just want to win a lot more than we lose. Simple! 🙂

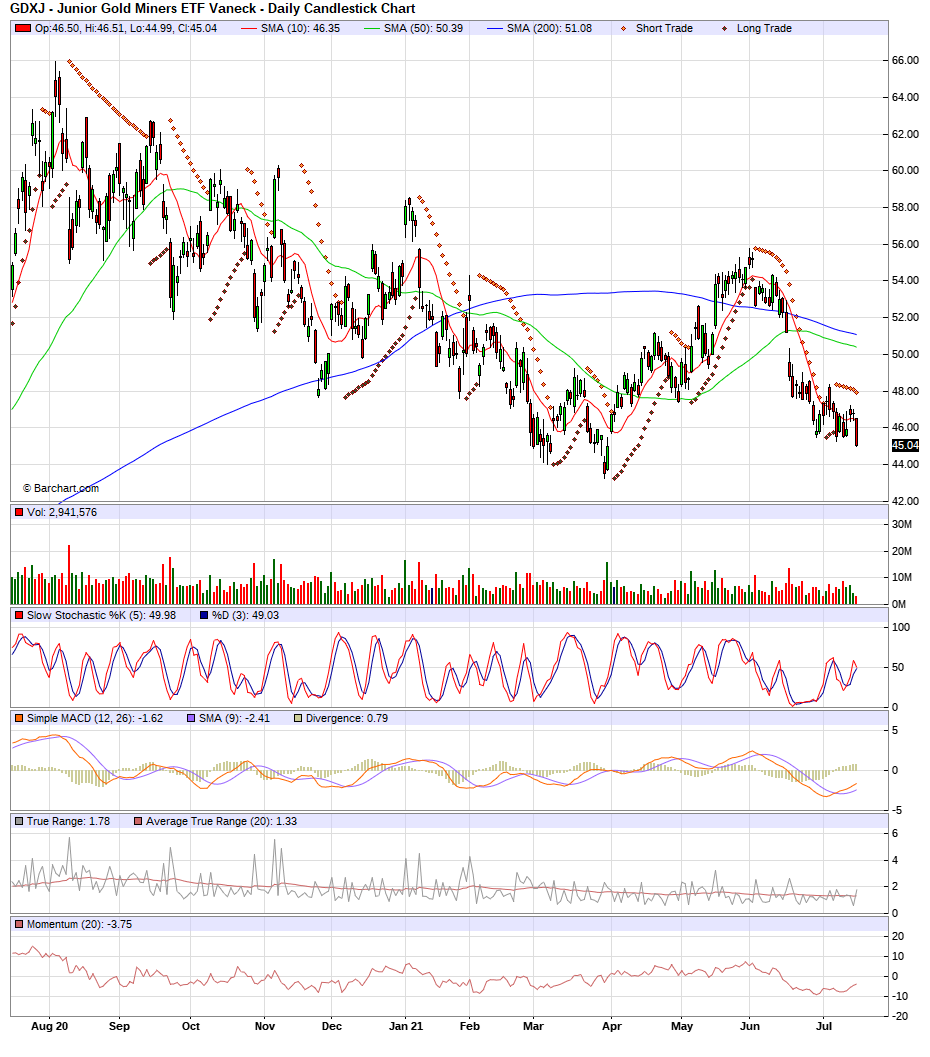
I also added to my winner in Maple Gold (MGMLF) on this big pullback in the mining sector. I have a large position already, soo didn’t go overboard, this buy was just to remind myself to keep and eye on MGMLF and be look to add over the next few weeks as opportunities set up. I have watched pullback to its upward sloping 200 day MA, where it sits now, so today was a good time to step up and get my feet wet (again). Member can see my current total holdings, average price per share and unrealized gains and losses on the tabs above. I haven’t adjusted the stop levels on this stock yet, as I’m up a good amount and not near stopping out, so wasn’t pressed to get it done considering all the fireworks happening in China, bitcoin, etc. Take a peek at what I was looking at when I added today.

Maple Gold (MGMLF) pulled back to it’s 200 day MA, so I added to my position

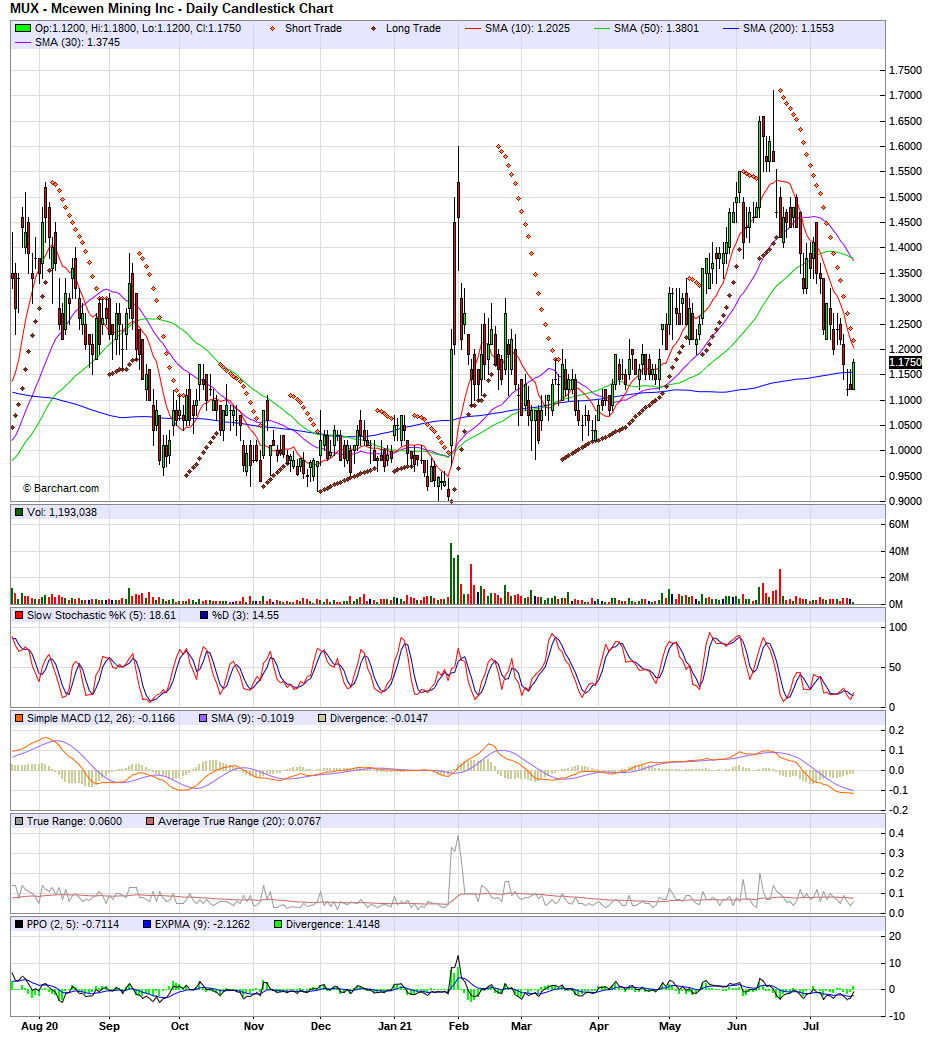
I also nibbled some more on shares of MUX (McEwen Mining), this one has to be reported as added around break-even. I will post the chart again for those interested, there wasn’t any news or catalyst for the buying today, but I like that miners appear to be running out of downside, as a group. I also like that MUX does not seem to want to drop more, it hangs in on days the sector is weak, leading me to believe it’s had enough downside and sellers are getting exhausted. That might change, and that is what stops are for, but for now I like adding to names like this when they hold up, after having already pulled back to support levels, in this case the 200 MA. Yes, I realize that perfectionists will remind me it’s actually sitting below it’s 200 day MA, but to me it’s close enough. Remember that I always assume support and resistance will HOLD UP, rather than get ¨broken¨, but of course breakdowns do occur sometimes. Again, that is why we use stops. I will assume MUX has a higher probability of bouncing soon, than collapsing or especially dropping much further from here, after a substantial pullback. Let’s see if I’m correct, for now here is the chart to contemplate.

McEwen Mining to me has better odds of a bounce than further decline, sitting near it’s 200 day MA

Tomorrow, I will look to buy more KWEB LEAP options, I had other limit orders in today, but only got filled on one order to buy. While the KWEB etf did go lower during the day, the LEAPS held up and didn’t trade as low as my entry price the whole day. Maybe they are signaling it’s done with most of the drop, or tomorrow morning the LEAP options “catch up”and drop some more, giving me some great fills as I get up to a full-sized position. That’s ok, we are not in a rush and we know patience is a virtue!

Added to loser KWEB etf

The big Chinese internet etf is getting clobbered today, down about 9% as soon as US markets opened. Since I am not yet stopped out, and don’t yet have my full desired position, I will view this drop as an opportunity to pick up some LEAP options on sale. As I near the full position size, I will have to be more strict with how much room I give each contract to go against me. KWEB is still intended to be a several month trade, roughly 6-10 month hold time is my best guess, and it’s oversold too on the weekly charts. I will post both below since I have a few extra minutes and am not overly active today in the markets. I still have several buy limit orders in, and will report any fills I get through the email-alerts for members.

First, the monthly KWEB chart. Notice how oversold the stochastics are, nice setup, in fact the only thing I’m not thrilled about is the MACD is only now just turning lower after a huge uptrend the last few years. That might not be too troublesome, the moves in this etf are large enough that we could see great gains before we see too many technicals change on the monthly chart, as a result of the big Average True Range (trading ranges), especially on the longer term charts.

KWEB MONTHLY VERY OVERSOLD

Now, let’s look at the weekly chart. The first thing that jumps out at me is the speed with which this etf has collapsed almost 50%! The second is the stochastics, quite oversold like on the monthly chart, but the weekly also sports a better looking MACD. So in a case like this, I can imagine many traders that take a shot of KWEB will be tempted to cash out after a good bounce, a bounce that shapes the weekly chart more positive like if the stochastics can reach overbought. However, I will try and push for more by sticking with the monthly charts prospective hold time of 6-10 months to turn the technicals positive. I can always change my mind if some new information pops us, but I typically find changing plans mid-trade hurts more often than it helps! I’ve already adjusted the Stops page to reflect the new LEAPS I’ve added, members should check out that tab and also the Daily Account Screenshot, which is an actual account I manage for a family member. I selected this account for the website because it was most representative of the style and size of accounts I managed when I maintained a license and handled retail accounts, whereas now it’s just Friends and Family accounts.

KWEB weekly chart says we should be due for a good bounce, too! Take your pick of what time frame interests you most, because KWEB is lining up on several.

KWEB WEEKLY-oversold stochastics and MACD about to turn up

Only one small trade today, but a few charts of interest to share.

At first glance I thought I didn’t make any trades today, but on review, I was filled on a small buy order to add to MUX today. Other than that, I just have a few observations and charts to share, being some interesting activity occurred in a few of my positions. First, NOVRF (Nova Royalty Corp.) had a nice jump today, gaining 11% and strong all day, while UROY (Uranium Royalty Corp.) outperformed in a generally weak uranium sector, making a late day run to finish up just under 5% on the day. Today’s action puts both of these stocks into the positive with unrealized gains now, so I will look to get more aggressive (heavier positions) in these when opportunities present themselves, preferably into a dip lasting a few days or more. Below, I will post the daily for both NOVRF and UROY, note they both are now above all moving averages now, after today’s strength.

NOVRF closed near the highs and convincingly above all moving averages.
Uranium Royalty Corp. looks similar, now above all moving averages, looking good

So both stocks are sporting similar patterns, when a stock moves above all moving averages it can be a signal that a trend is about to initiate, in this case we should expect and uptrend. If the uptrends materialize, these stocks become great “buy the dip” candidates on most pullbacks, so expect to add to these positions. Here is an intraday chart, just to show how quickly buying can come into a stock. While I don’t often trade off the 5 min bar charts, other than to time entries and exits I had planned from a daily or weekly chart signal, here we can see how quickly the buying came into UROY, after spending most of the day not doing much.

UROY intraday, the move didn’t start until 3:20pm, then marched straight higher

So these are two stocks to keep an eye on, be ready to add. I had buy limit orders in on several names, but no other fills. I didn’t see any reason to pay up or chase things higher, so I will sit and wait patiently for pullbacks in which to add to my positions.

Added to LOSING position in GDXJ

While I normally prefer to add to winners on a pullback, I also like to add to a position I like but that I am down on, especially once it starts showing strength, as the mining sector is doing today. It is more risky than adding to a winning position that has already has a cushion to buffer any downside, but also can give great entry prices or lower our average cost from earlier purchases, assuming the trade is still a good one and will work out. As I type, I am still not up to a full risk position in GDXJ LEAPS but I’m getting close, might even get there before the close of trading today. Members can get all the details in the Stops and Daily Account Screenshots tabs above, but they also receive real-time trade alerts whenever I make a move in the markets, as well as adjustments to stops levels, unrealized P+L, etc.

The other day I posted the WEEKLY GDXJ chart, here I will post the daily chart. Warning: It sure looks ugly, the moving averages are in a death cross and headed lower, the stock price in at the lows, what else could be wrong?! LOL While I enjoy being in a firm uptrend, with momentum at my back, I have also learned that things often look their worst right before they turn great again. Recall my GDXJ buy the other day when I posted the WEEKLY chart, that told a different story, showing well oversold stochastics and the stock near potential support, and since this is a trade with a WEEKLY hold time expectation of 6-10 weeks, I can live with an ugly daily chart. Let’s see if we can hold this one through to see it transform into a winner. If it can, these are the biggest profit potential trades of all, riding something from the trash dump all the way to the pinnacle of every portfolio! 🙂 In any case, I will be taking profits when we get to overbought stochastics on the WEEKLY chart, whether I am up or down on the position. Members get updated stop prices, and overall position sizes and unrealized P+L numbers with their subscription, something I not only think is the most important aspect of trading, but little or no newsletter writers provide. I don’t understand this, as its the single most important aspect of successful trading, just picking a name to buy and sell in the most basic step, and not nearly as important as how much we buy, if and when we stop out, as well as when we sell for profits. GDXJ daily chart:

A chart only his mom could love- GDXJ DAILY is ugly but I added today

I’m not far from getting to a full-risk position, keep up with the position sizes and stops in the member’s section.

After the close update: I was filled on a buy order to add to my NOVRF position just before the close. I have to report this buy as an “adding to a losing position”, as I’m down slightly on this stock so far. Being that copper stocks are turning higher like many commodity stocks today, I don’t expect my Nova Royalty Corp to be a loser for long. For those that want immediate updates and alerts, becoming a member gives them not only real-time trade alerts, but also a real, daily screenshot of the account I am managing for this site (it’s a real account, real money, real time), including total position sizes, average prices paid for positions, buying power, margin amounts, etc. All of the most important details are available to subscribers, and I’m very sure the information is well worth the cost of membership. I don’t know of any service out there that lays the actual and true numbers all out there for their subscribers, instead all I have seen is a constant barrage of buy recommendations, with very little regard to the position sizing and stop placement. These are the most important aspects of a trader’s plan, and ultimately they determine our results, what we decide to buy and sell is secondary to risk control and learning to push winners for all they want to give. Money management and risk control are far more important than what we choose to trade, it’s that simple.

Added to winner MUX- McEwen Mining

Miners look to have turned the corner and are headed higher today. I showed a chart of McEwen Mining recently, but today it looks even better as its nudging back above its 200 day MA. MUX is a live case where where my position size is larger than my original desired position based on my fixed Total Risk (TR). I will still keep the risk close to the original level, just have more shares which means I will give them less room to be wrong. Because MUX looks like it’s about to start higher again and getting over it’s critical 200 MA, I feel the momentum near term has changed in my favor, so I am comfortable with more shares. I will continue to play this one the same way, if I get more chances to add while still sitting on unrealized gains, I will do so. I might add to this post later, as I have open bids on the market for more UROY, NVROF, and GDXJ LEAPS to name a few. Members get real time email alerts whenever I make a move, buying or selling, as well as access to account screenshots daily.

Can MUX stay back above it´s 200 day MA and turn the trend UP again?

I only focus on MUX today because that is one I got some fills on, but the whole sector is acting better and many charts look similar. This afternoon might be a good time to add to some positions, let’s see if they present an opportunity!

Added to losing position in GDXJ

I’m still not up to a full risk position in GDXJ LEAPS, the ones I bought expire in Jan. 2023, and I am about half way to my desired position size. Of course, if the trade starts working out and showing me unrealized gains, I could get quite a bit “heavier” into the position, sometimes as much as double or triple my original planned size. However, I am always trying to keep the Total Risk (TR) near my original amount.

Members can get all the details in the tabs above, including revised protective stop levels, but here is the WEEKLY chart of GDXJ. Once again, we can see GDXJ iw well oversold on the technicals, but it also could be that it wants to come down and the red 200 week MA, in which case I would increase my position size to full risk with full size. Since this is a weekly signal, I expect to be in the trade a minimum of 6 weeks, maybe as much as 10 or 12 weeks depending on how well the trade is working.

GDXJ LEAPS-added today as I work up to a full-sized position as defined by Total Risk (TR)

Late afternoon update, added to my UROY (Uranium Royalty Corp). I used barcharts.com for the larger graphics on something like UROY which is less actively traded, in case readers wonder why I alternate between charting services. I’m still not up to a full position as defined by my Total Risk (TR) levels, but I keep buying until I get there, as long as I am not stopped out.

Stopped out of two miners, added to NOVRF

With the relentless beating the miners have taken since the FOMC meeting a few weeks ago, I have been stopped out of two more positions. I don’t like it, but we have trading rules for a reason, and more often than not I end up being happy I stopped out when the stock reached my limit. This morning, Irving Resources (IRVRF), and Lion One Metals (LOMLF) were jettisoned. I hate to see LOMLF sold, being on the weekly chart its coming down to its 200 day MA, but again, we must adhere to our discipline. The charts below are DAILY bar charts.

I also added to Nova Royalty Corp (NOVRF) as the copper sector is getting smashed again too, and since I like buying things on sale while I don’t yet have a full position, today is as good a time as any. I intend to keep adding to NOVRF and acquire a few other copper miners, as well as some uranium stocks since they are pulling back hard also. In fact, even the general stock market is starting to weaken, something I have been patiently waiting for, as I expect it to lend some strength to precious metals once we see a weak month or two in the S&P500 and Nasdaq. Stocks I’m looking for buy signals on over the next few days include URNM, CCJ, URPTF, DNN, NXE in uranium, and WRN, COPX etf, IVN.TO, TGB, ATUSF, and a few others. Looking out a few weeks, the TAN (Solar etf), and PBW (Wilderhill Clean energy etf) might be setting up for buy signals soon on the WEEKLY charts, and SPCE (Virgin Galactic) could be doing the same, after losing close to hlf it’s value in just the last month! I posted a chart of SPCE to show how quickly something can drop on a “buy the rumor, sell the news” situation. Just after Richard Branson took his own service to visit space, SPCE stock started dropping like a stone, the opposite of what most investors would expect!

LION ONE METALS-stopped out!
IRVING RESOURCES-stopped out today
Virgin Galactic (SPCE)-don’t own it yet, but might one day soon

After a good start to the year, it’s been a tough stretch the last couple months. It’s part of the game, and at times like this we must remind ourselves that a solid game plan with the discipline to follow it, are what determines our overall success in trading and investing. Drawdowns are just another part of the process, it’s how we manage them that matters. Let our well-placed stops take us out when a stock gets there, it’s about risk control, not opinions or emotions at that point.

Uranium stocks setting up for a BUY

This weekend I wanted to go through some uranium miners I see coming into potential buy zones, with oversold technicals. I’m not buying these just yet, but I am getting my list ready to put into action. Regarding uranium miners, some like Rick Rule are very positive on the group. While he is well known for his expertise in resource markets, and remains a staunch bull on the precious metals, he makes it clear that a dart-throwing selection process has a far higher probability of success in the uranium miners (roughly 8 out of 20 are investable- about 40% of the group), than it does in the precious metals miners, where we are lucky if 10% of a much larger group are worth our time and investment. That is not to say that precious metals miners are not lucrative when we do out homework, but the uranium sector is much “easier”, and our odds much better, if we have timed our macro calls well. Let’s look at some charts, and keep in mind that the only uranium stock I own at the moment is UROY (Uranium Royalty Corp.). I did own CCJ (Cameco Corp), but cashed out with good profits a few months ago. Now that it’s correcting, I am waiting for a good window to get back into CCJ along with the following uranium stocks.

URNM WEEKLY- I use the etf to gauge when to buy the other individual uranium stocks

Notice that most of the charts to follow look similar in how they have made recent new highs, and now pulling back in a correction, just like the URNM etf. Each chart of a different stock will have it’s own areas where I might look to start a position. Some will be near their 200 day moving average, others might be nearing a 50% fibonacci retracement or some other important technical level, etc. The point is when it’s time to start getting involved in a sector, as defined by the leading etfs in the group nearing a buy signal, I start looking for points on each individual stock’s chart to pick my areas to start buying. Then, I continue to look for windows to add until I get up to a full position, as defined by my Total Risk (TR) level. I might buy all, or just one of the following, depending on what happens near term, on what the market offers me. Let’s look at some individual uranium stocks to see what buy signals might present soon.

CCJ (daily chart) is the biggest and the best in the sector, according to many, the blue-chip uranium stock

I already cashed out with great gains on Cameco (CCJ) once in this bull market, but I intend to do it again. I will likely use the LEAP call options again, as they worked so well the first round. CCJ is the “easy” play, if anything in this business can be considered easy! Still, I will wait until the URNM etf is on BUY signal before taking a position. If I can only own a few uranium stocks, the URNM etf and CCJ will be among my holdings.

UEC DAILY chart-pulled back 40-50% and already testing its 200 day MA

Uranium Energy Corp (UEC) has a similar chart to CCJ in that they have both made new 52 week highs recently, and are now retreating, but UEC is more volatile so pulling back harder. It’s not my favorite uranium stock as far as fundamentals, but any stock that has corrected close to 50% after making new highs, and in a leading group, will get my interest and energy to look into it further. UEC is on my list of potential buys.

DNN DAILY chart-similar setup, pulling back in strong group with potential support not far away

Dennison Mines (DNN) is another uranium stock that looks to be experiencing a normal, expected correction in a bull market. The percentage moves offer lots of potential risk and reward, when one considers the 52 week high was $1.80 just a few months ago, and now the stock sits under a dollar. That is a 44% correction already, and equally important is the 200 day MA is only a little lower at 88 cents, from Friday’s closing price near $1.00. You will notice the MACD indicators are oversold on these charts too, usually along with the stochastics. With most of the stocks mentioned in this post, I will start by putting in lowball offers since we don’t have a full buy signal yet on URNM, hoping to get some lucky fills form a panicked trader on the wrong side, looking to exit at any cost. 🙂

NXE DAILY- Nexgen Energy, same situation, a buy near its 200 day MA

Nexgen Energy (NXE) shows similar price action in the chart as the others I have to take a moment to say these are the best setups in my opinion, when stock after stock in a sector are sporting similar technicals and chart patterns. Here we see NXE is also possibly going to approach its 200 day MA. On any individual uranium stock, I might start acquiring shares at any moment now, as they are not only nearing supports, but also confirming the action in each other. Member have full access to my ACTUAL positions, sizes, stops, and unrealized gains and losses, just look into the tabs above.

UEX Corp. DAILY chart-closer to its 200 day MA, more speculative, with higher risk and higher potential reward

UEX Corp is even closer to it’s support than the prior stocks mentioned. It has more potential risk, but also possibly more reward. The way to play a name like this is to adjust my position size based on the ATR (average true range). I like this one because it’s another stock in the group that has corrected 45% already, AND just made new 52 week highs a few weeks ago in June! We can benefit from the late chasers who bid the stock up in June, and are now sitting a a big loss, worried about what the next week or two might bring. I will start by putting in low-ball bids on Monday, and know that I likely have time to acquire my uranium stocks, I don’t have to chase, I can wait for them to come down to me at my bid levels, or near the 200 day MA’s, etc.

Fission Uranium- FCUUF

Fission Uranium is not only pulling back like the others to its 200 day MA, we can also see that area coincides with old resistance, which is now support) in the 38 cent level. This and UEX are more speculative names, so be sure to size your positions correctly according to your risk tolerance. Position size is the single more important factor in a trader’s results, members can learn more about how I determine correct position sizes for my system in the tabs above. I won’t likely bet too heavy in FCUUF or UEXCF to start, but I could end up buying a lot if the trades are working well for me after I get involved, as I like adding to winning trades.

UROY DAILY Uranium Royalty Corp. Already own this one and looking to add

The last uranium stock I’m going to mention today is UROY, which readers have seen mentioned a lot lately in recent posts, as it’s the only uranium stock I own at the moment. Being a royalty company, it should have less risk than outright miners with their concentrated, capital intensive investments. We can also see in the chart that while UROY is pulling back with the group, it is not dropping as harshly, nor is it as close to its 200 day MA yet as the others. I WILL BE ADDING TO UROY, probably before I buy the others, since it is acting better and I will be adding to a winner on it’s pullback, my favorite trade setups. Like with the others, I will put in lowball offers this week and wait for fills to come to me. If I don’t get many fills, I can always decide on which stocks I will pay the current price, UROY is one I would be ok doing that, but I still think I might be able to get it cheaper, maybe close to its 200 day MA. That is down near $2, and while 50 cents further decline does not sound like much, its still a 20% drop from here, so patience is a virtue!

Stopped out of 5 positions!

Miners were weak enough that I was stopped out of 5 miners, and decided to trim a portion of my SILJ holdings. Members can check daily account screenshots for specifics on total holdings remaining, average cost, etc. I was stopped out of the following today….DV.V, PGM.TO, AAG.V, ISVLF, and AMXEF (though AMXEF was not actually a stop out, just close enough to the stop price and small enough position to jettison it). I also trimmed some SILJ, but still maintain heavy exposure at the moment.

When I stop out of positions like this, it does not mean I’m negative on the group or anything in my analysis has changed, its simply that the stock has dropped to a level where I no longer want to hold it to wait and discover what is “wrong”. My suspicion is that none of this is related to the miners specifically, they are down without company specific news to justify it in each case. That doesn’t mean we don’t sell, but it does mean we might even buy them back at some point. I typically like to give them some time before hopping back in, however, of the 30 positions or so that I manage, these 5 have proven to be weak enough that they came down to their stop-out levels.

It was a tough week, with SILJ down over 8%! I’m going to leave you with the WEEKLY chart of SILJ, then get away from the computer to keep my sanity! LOL I will have more observations to share this weekend, after I have a chance to digest how the markets are transitioning. It’s possible I might need to make some substantial portfolio changes, for example if the new “delta variant” of Covid is used as an excuse to shut down the world economy again, or shutter mines. For now, I won’t act on fear or emotion, instead will wait for this stretched extreme short term to normalize, then assess how things are shaping up. Losing is part of the game, we must do it gracefully so it doesn’t get out of control, let your stops do their job!

SILJ is oversold on the WEEKLY chart

While SILJ stochastics are oversold on the weekly chart, one could argue its heading down to test its 200 week MA (moving average). I trimmed about 15-20% of my SILJ holdings today, members can log in to see the exact figures, but I remain bullish. I will look to put the proceeds to work again, perhaps at lower prices, or in my best performing miners, maybe in entirely different groups. I need to see if I can figure out what is driving this perceived turn in markets, is it more covid fears and economic slowdown that comes with it, or maybe just a correction in commodity and value stocks? We will know more before Monday, and I’m prepared to make any necessary changes, as long as they are necessary and not driven by fear or emotion!

Added to GDXJ, UROY, and MUX now a full position

With miners getting hit again today, I am getting fills on some orders to buy I left in below the market prices of the last few days. I added to my GDXJ Jan 2023 expiry LEAP calls (added to loser), and also brought up my MUX holding (added to winner) to a full position now. I am also very close to stopping out of a few positions, will update if it occurs. In the uranium area, I added to my winner in UROY, as I look to bring it up to a full position. Here is the daily chart of GDXJ, sure looks ugly, but they always look their worst before they change for the better, just like its always darkest just before dawn. This has been a relentless pullback, lets see if I can survive it, even make money from it!

GDXJ LEAPS expire in Jan. 2023, plenty of time to work
UROY-Uranium Royalty Corp, continue to buy

Members get specifics like stop levels I’m using, average prices paid and total position sizes for all holdings, as well as unrealized gains and losses with their subscription.

SIGN UP FOR UPDATES

NO SPAM, EVER!