It’s a half hour before the close of trading today, but the day has been more quiet than anything else. In fact, I only made one transaction today, a buy adding to my EQX (Equinox Gold) position. Members received real time alerts, and should access the tabs above to see total position sizes, as well as other pertinent information like unrealized gains and losses. We show the actual account statements here each day after the close of trading, unlike any other site I have visited, so make good use of it!
Let’s looks at EQX. I’m showing the weekly chart below…
Equinox Gold (EQX) weekly chart shows the stock has lost over half it’s value in the last year, and the MACD looking more likely to turn higher soon than anything else. I’m comfortable adding today, to what was one of the sector’s darlings in the last bull run.
With not many trades to report, all I can say is today was a typical day after a big move up in the days prior. We are still looking to add into oversold technical situations, which is when we picked up the extra EQX today, into a late morning pullback. Basically everything we own is pulling back slightly after the surge higher on Monday. That applies to things outside of the mining sector too, like our KWEB etf (Chinese internet giants), so there wasn’t much to do other than wait and watch for the next opportunity. We are loaded up, but still have a good amount of cash to access if something sets up correctly. If not, we will be content to sit with what we already own.
I didn’t have time to write up a recap yesterday, but it was a stellar day for the precious metals and miners. Big day, big reversal, and more importantly than the gains, was the fact the HUI gold miners index closed above the breakdown level on the charts I posted over the last few days, the 247-248 level. This serves as confirmation that it was a “false breakdown”, which usually serve to washout out the last weakened longs before a sustainable bull move higher.
I also mentioned last week that James Flanagan at Gann Global was looking for this to occur, to confirm his analogs suggesting not only have miners bottomed out, but this could very well be lining up to be one of the largest rallies in the sector over the next couple years. At the moment, he is offering a discount to help people get on board for what he feels might be a historic move, so here is a link to watch his most recent video and more on the offer. I am in no way compensated by him or Gann, no affiliation whatsoever, I just appreciate his work. His video is very interesting to say the least, and if I recall correctly he has only issued 4 buy recommendations in the last 25 years with similar potential, so he isn’t shooting at anything that moves, so to speak. He waits patiently for the most optimal setups then acts fast and aggressive, or does nothing at all for long periods of time. My own research and charts confirm what his work suggests, that miners might be embarking on a huge move of several hundred percent over the next few years. All this is in regard to precious metals miners, and I will post a few charts of those indexes and etfs, but even China’s KWEB got into the action in a major way today, up 11%!! We made up over half out unrealized losses just today. There has been too much to cover in this one post, so I will try to post more frequently this week, maybe a couple posts each day until we cover everything happening. It will be more important to do so as we near our next action points, like the next time to add to positions, but for now they are taking off and we don’t like buying into strength in downtrends, which is the case right now. We will wait patiently for a pullback to make additional buys. We are happy to have been adding heavily late last week, turned out to be a fortunate decision.
Let’s review a few charts, first we can see KWEB with a close to ideal MONTHLY setup, note the stochastics not only oversold but now turned and trying to emerge from the zone. Recall that this was a signal we expected to be in for 6-10 months or so.
No guarantees in life, but this is a bet worth taking any day, in my opinion.KWEB daily chart, I expect this to reach the 50% Fibonacci level at a minimum over the next few months
Now lets go to some miners charts.
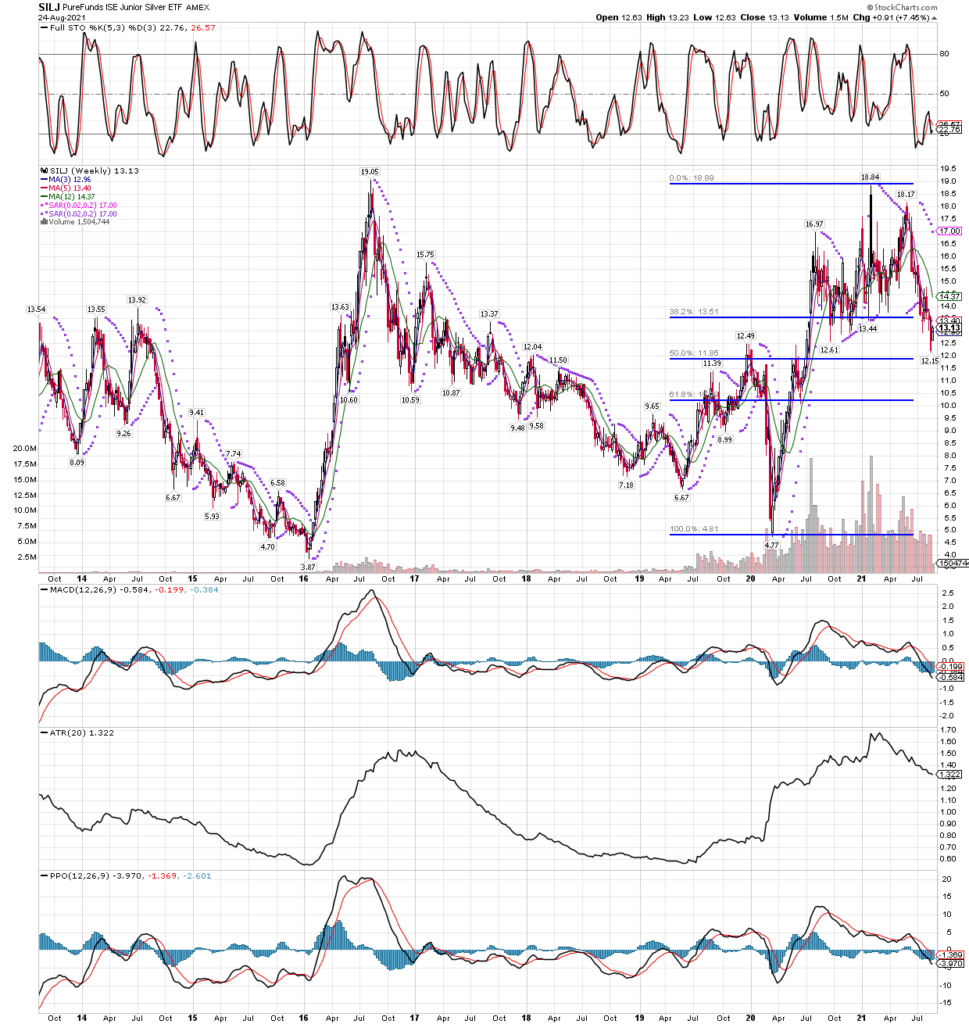
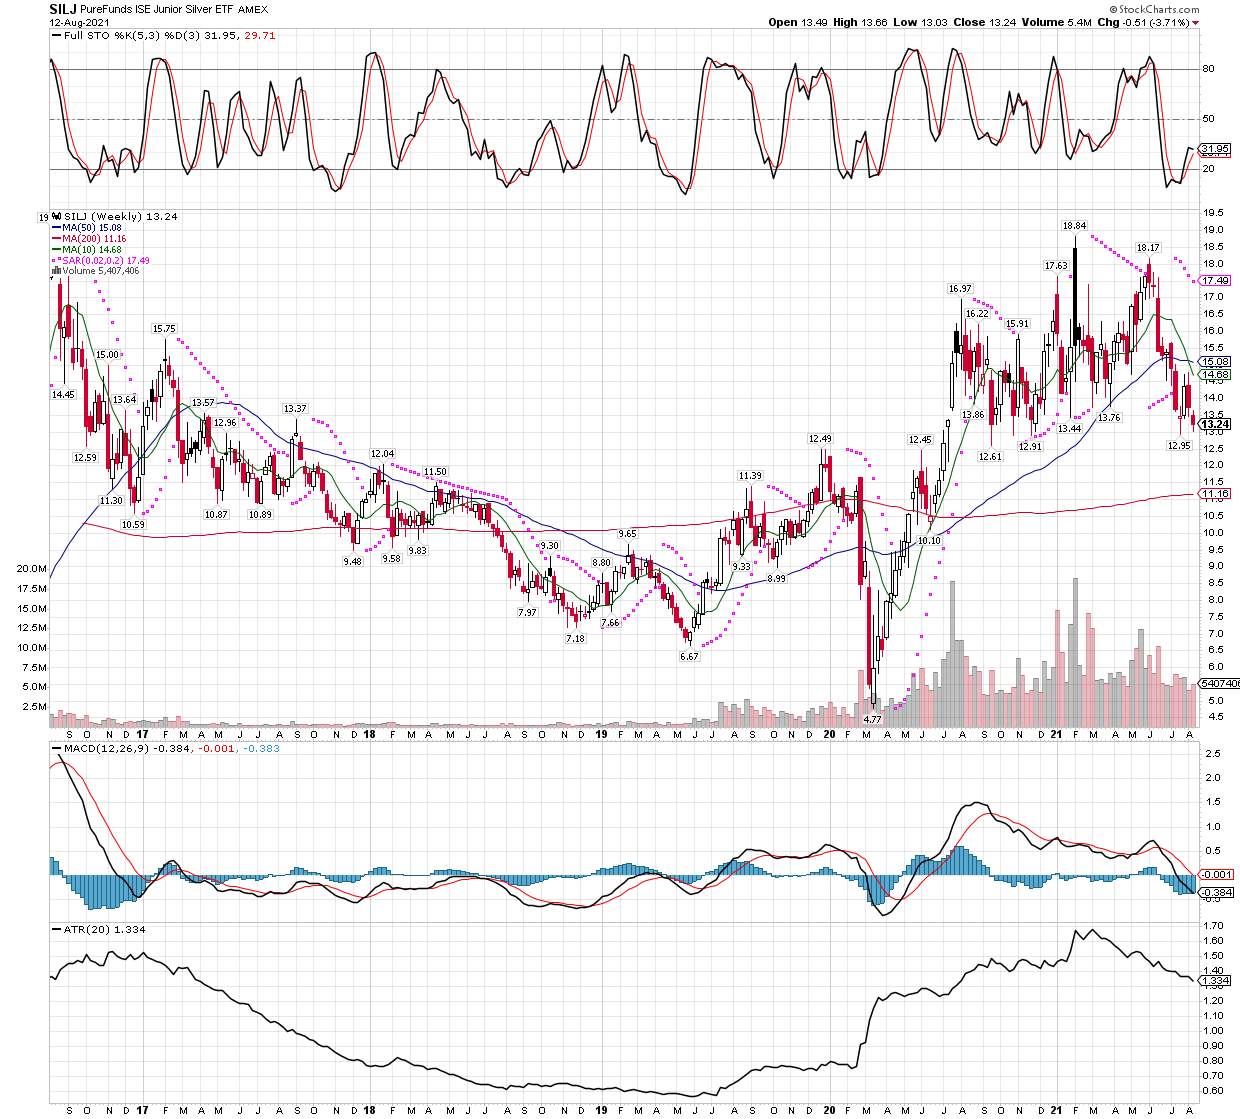
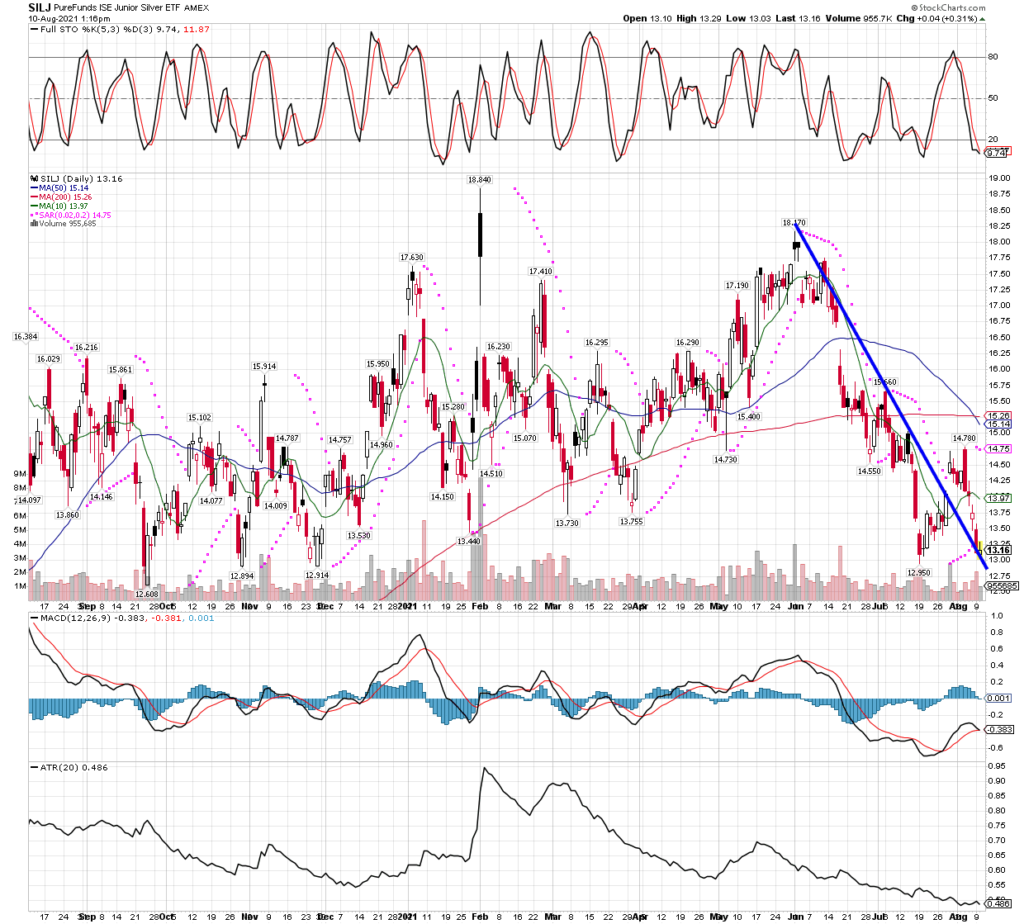
SILJ etf WEEKLY chart with Fibonacci levels.
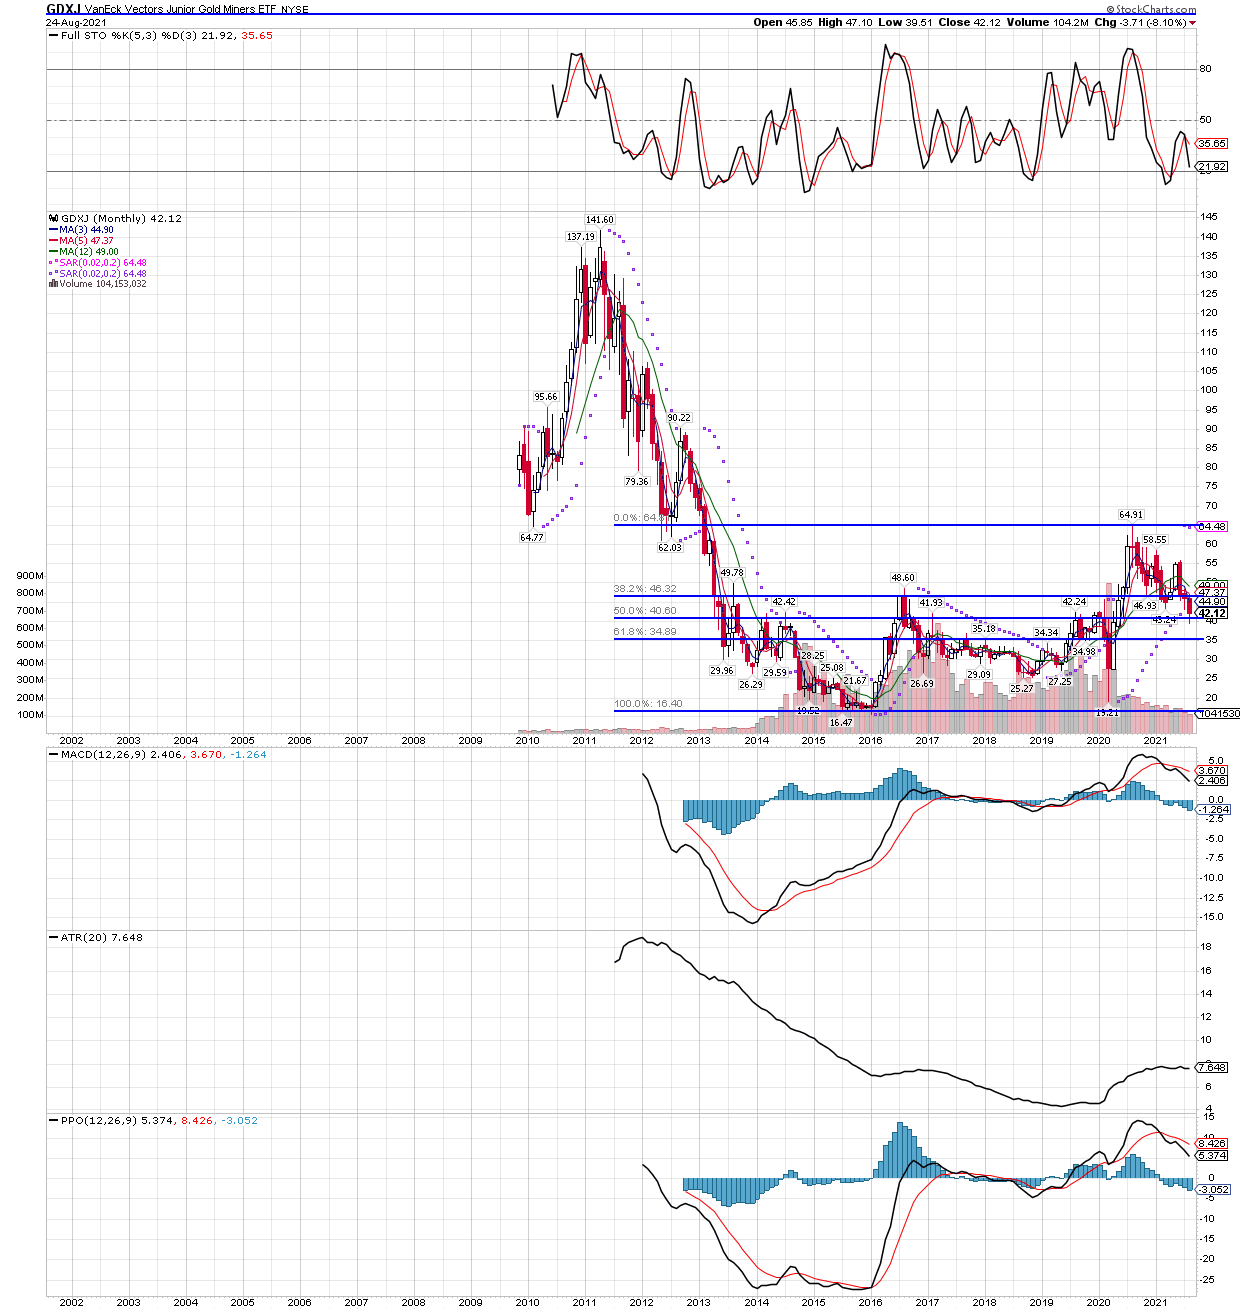
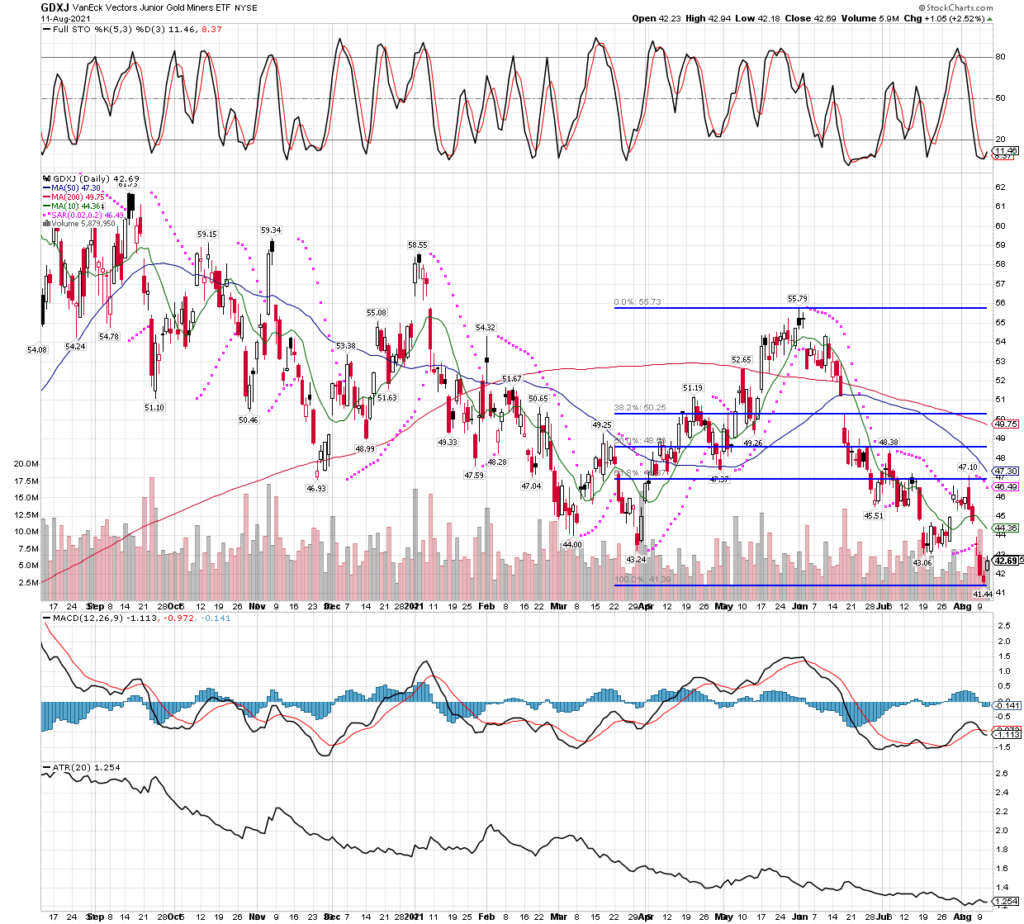
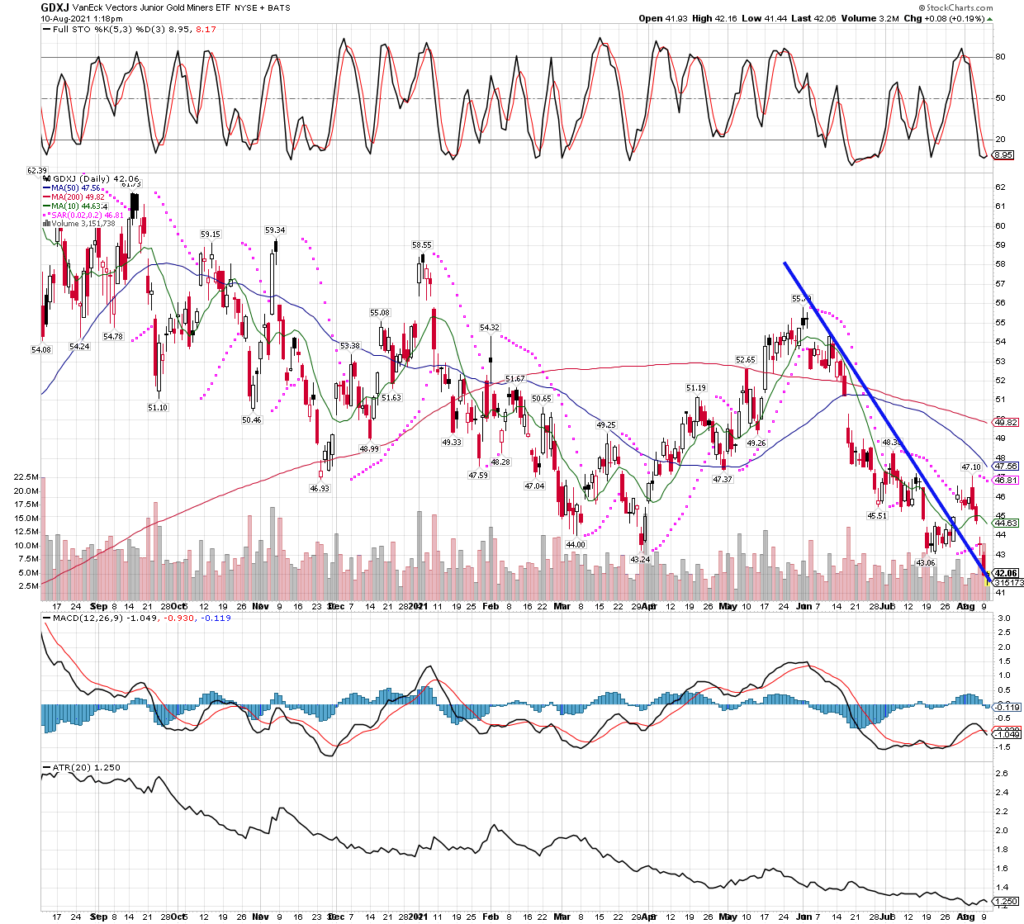
Moving further out, lets take a look at the GDXJ MONTHLY chart where the 50% Fibonacci retracement level has come into play. It’s already been tested and now starting back higher…
GDXJ MONTHLY- the 50% retracement has been tested and held so far
This GDXJ chart and the some other miner etfs that look similar are all suggesting huge potential upside over the long haul. It won’t likely be a straight up rocket ride, there will be pullbacks all along the way, but these charts tell us to be long and strong, we will try to hold on tight as the gains could be spectacular!
I will try to make more posts with charts of individual miners each day, to show readers what we are seeing, but it looks good. Even better, many people are now washed out and thoroughly sick of miners, so have no interest in buying ever again, just as they look to have put in a bottom. We are looking to add on dips, when and if they come, but miners are famous for flying once they get started, and not making it easy to wait for confirmation without missing a big part of the move. It’s the best of all worlds for a trader and investor, and it might turn out that the biggest risk is selling out too early!
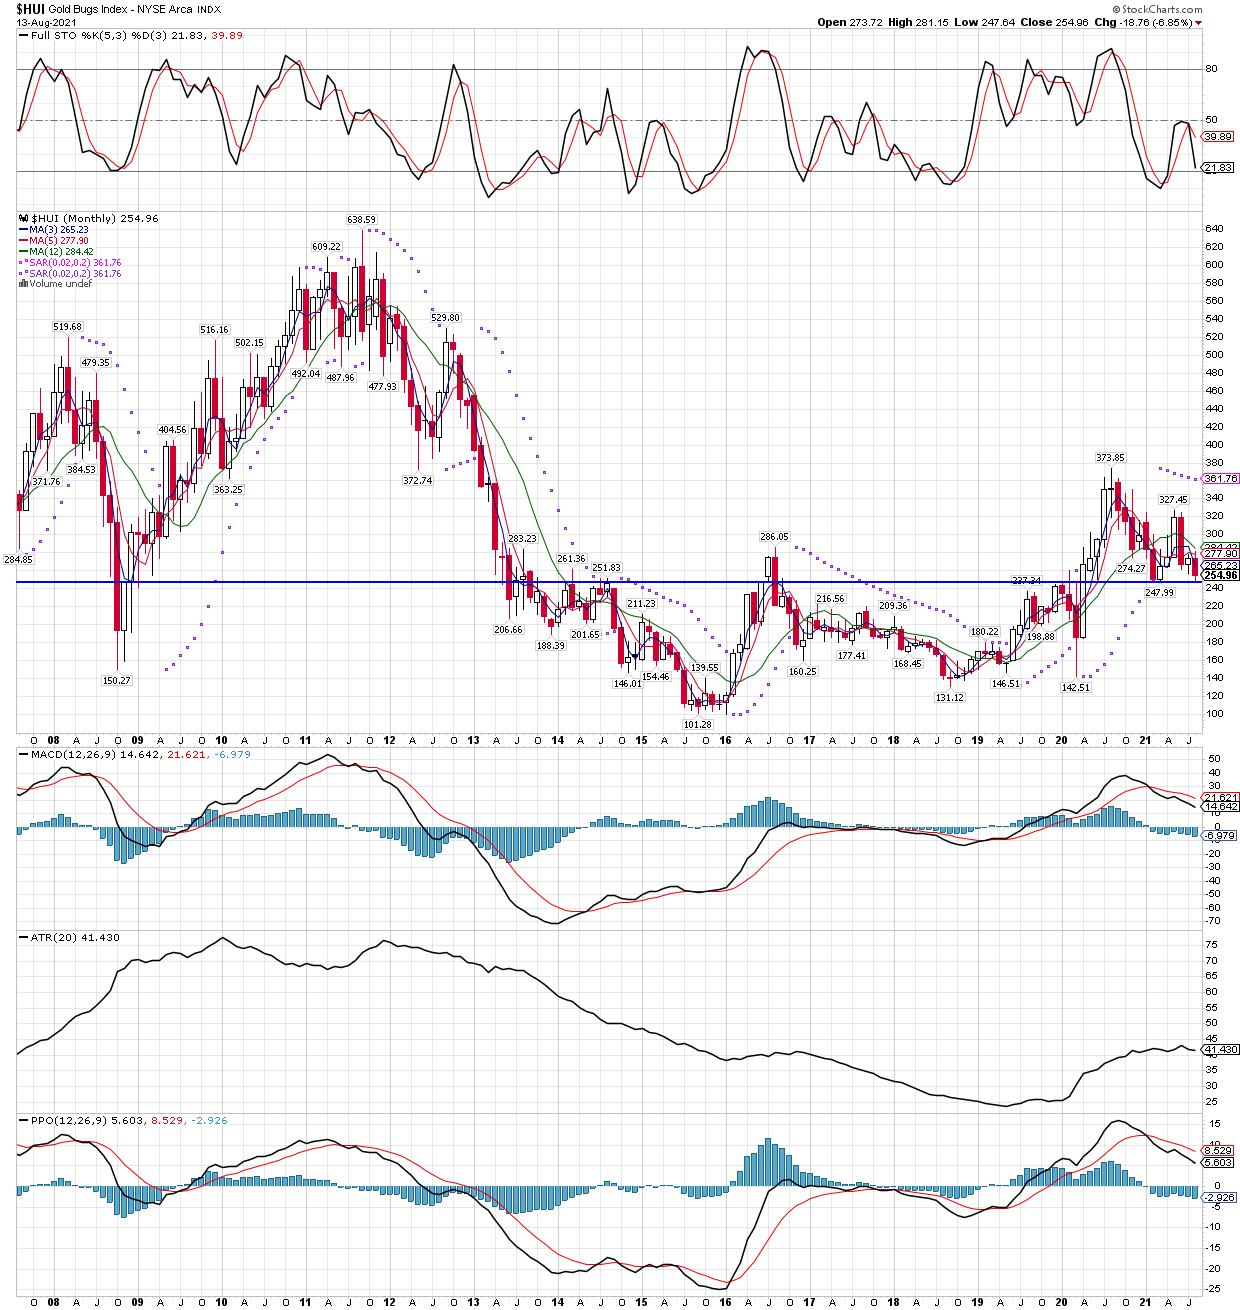
Long term charts have more significance because they not only show more history but have wider ranges and more contact points for items such as trendlines. Here we see the HUI MONTHLY chart with fibonacci retracements connecting the bear market low in beginning of 2016 to the bull market high in August 2020, with the all-important 50% retracement coming in at the 237-238 area, and 238 was tested just today, Friday, August 20, 2021.
And that isn’t all! The horizontal trendline touching the highs supports and resistances over the last 20 years also sits right in that area, about 238 on the HUI. Combine the above with the likelihood that as the month ends we will see the stochastics reach oversold (if we close here or lower), all suggest the is an ideal area for the index to find support, and perhaps mount it’s next long term bull trend higher. Something to think about this weekend! 🙂
HUI MONTHLY with fibonacci retracements, the 50% level touched today, as well as the horizontal support!
If I had to rely on just a single chart to trade the bull market in precious metals miners, this would be it!
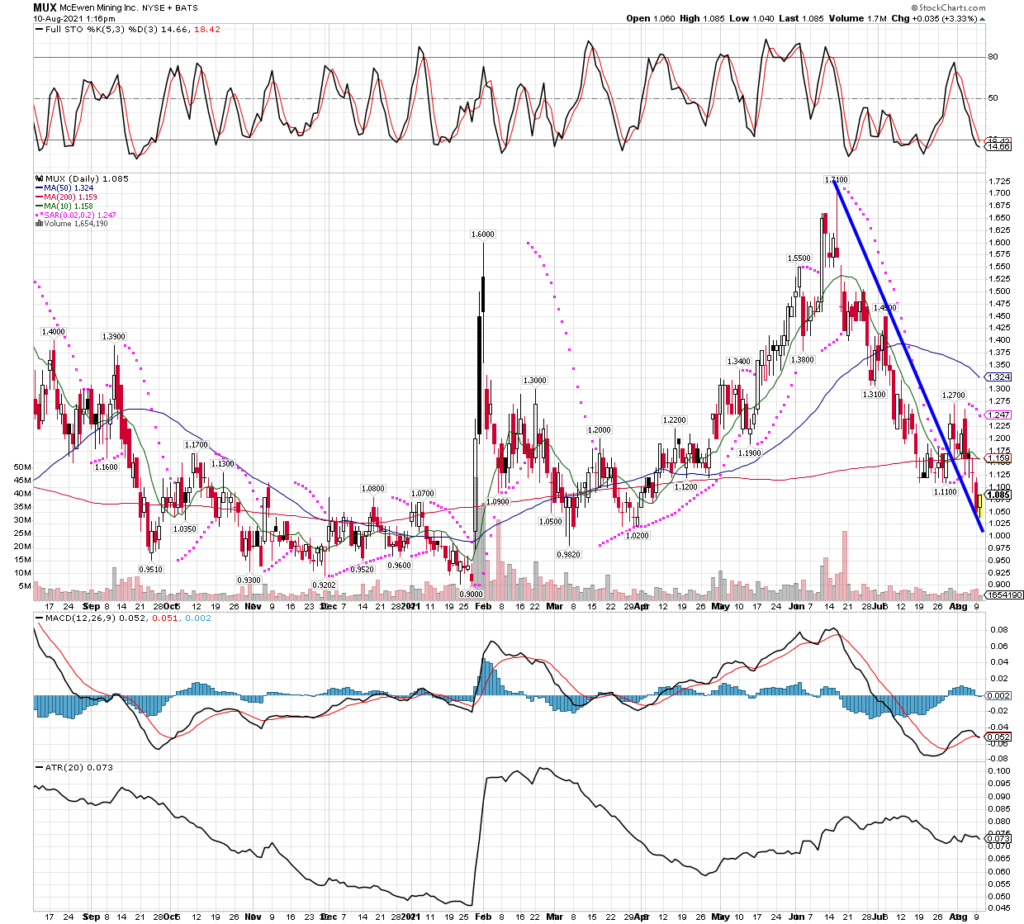
Just a brief update while I am not busy doing any buying today, to report on a very active day yesterday. We were out buying several miners, SILJ etf, MUX (McEwen Mining) and MGMLF (Maple Gold). We out more money to work yesterday than any other day in the last few months, being the miners were getting smacked down again and I am suspecting we have a false breakdown below horizontal support in just about everything miner related except GDX, which got within pennies of a new low. The plan is to add more if we get further weakness, or if the HUI Gold Bugs Index breaks above 248, so for now all there is to do is wait patiently.
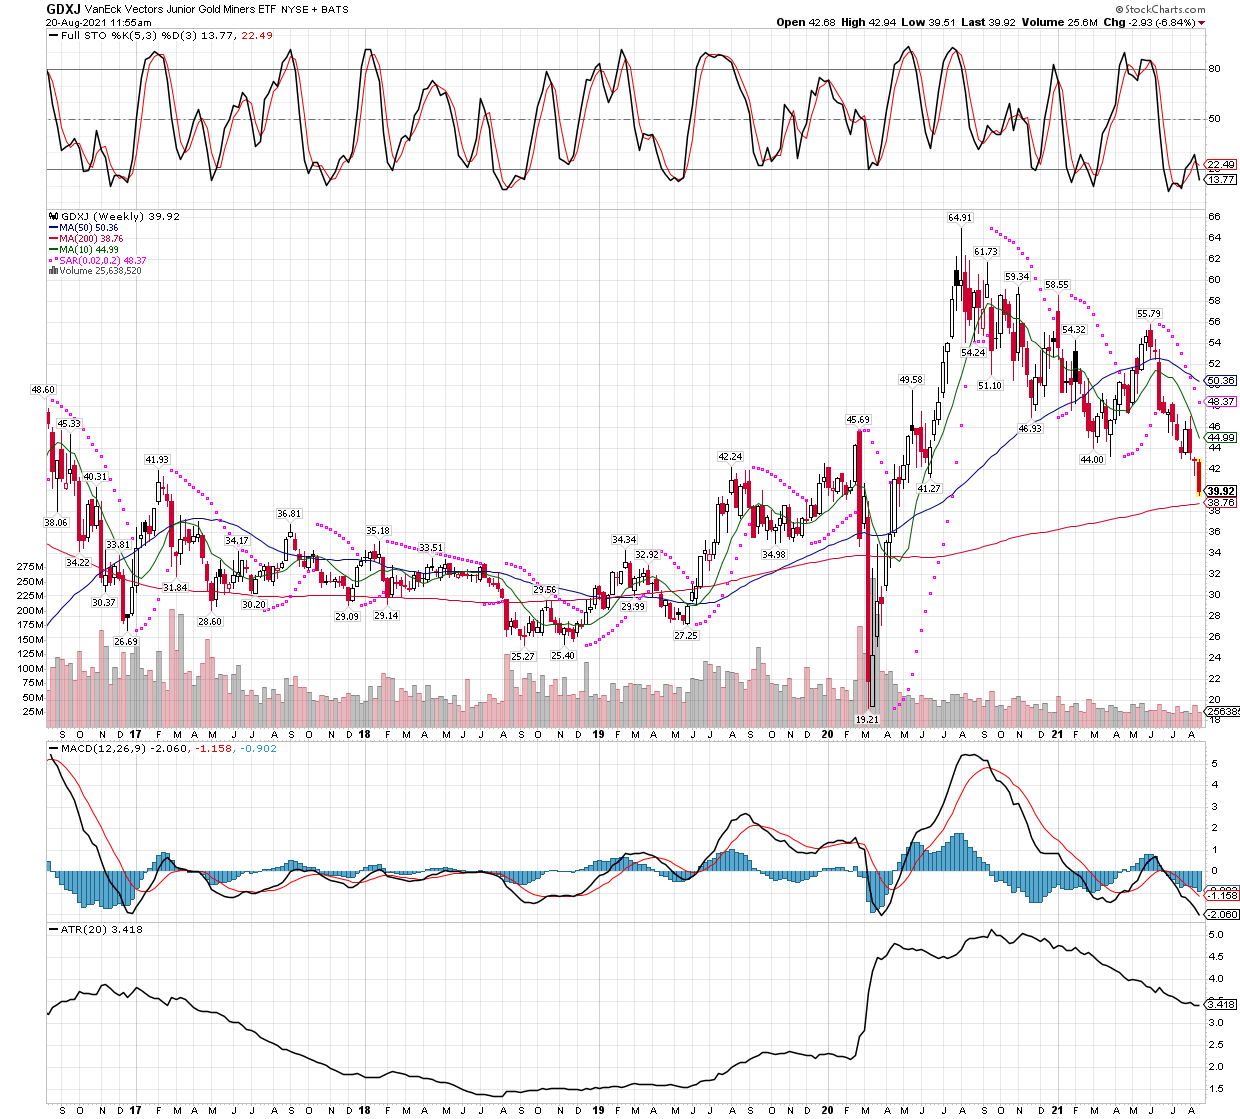
I won’t chase strength while miners are mired in a down trend, either we buy into weakness, or we buy the breakout I mentioned. There isn’t much new to comment on as we wait for miners to find a bottom and turn higher, but I will leave you with a WEEKLY GDXJ chart, showing the 200 WEEK MA is now very close by. I still expect a bounce sooner rather than later, as more and more areas of potential support are coming into focus. Here is the chart…
GDXJ nears its 200 WEEK MA, it’s been a tough ride in the sector, but we are still looking to add while prices are low.
Since didn’t write a recap yesterday after the close, and since I have made a few trades this morning, I wanted to put up a quick post explaining what I’m doing. I added to both SILJ etf and MUX (McEwen Mining) this morning as the beating continues. I waited until stochastics on the half-hour bar chart got oversold intraday before making my buys. I won’t lie, this is a VERY trying time for precious metals miners bulls. All we can do is maintain focus and keep errors to a minimum. It’s not all bad, for example we were fortunate with our sales of NOVRF, which announced a secondary offering and was halted all day yesterday, not opening until this morning and down 15%!
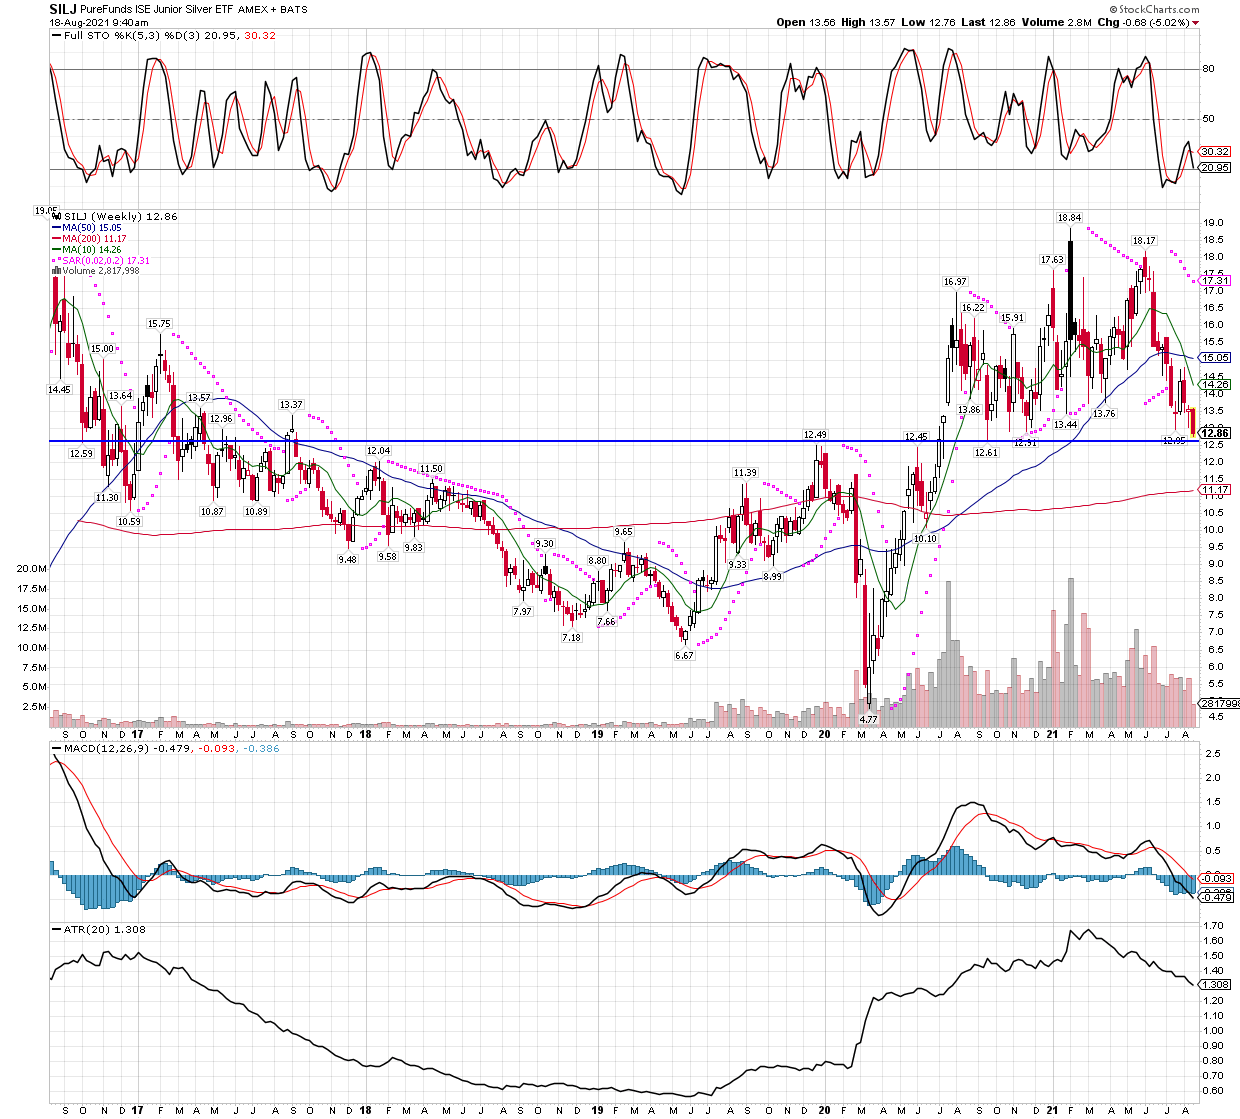
Let’s take a quick look at the longer term SILJ charts, since we have a large position in it, and we added again today. Let’s start with the WEEKLY chart…
SILJ WEEKLY- I drew the trendline as such because it incorporates the breakout point after the March 2020 collapse, taking out the high price point made right before the decline.
Now let’s take a peek at the MONTHLY chart…
SILJ MONTHLY- same idea with where I chose to draw the trendline, just a longer term view.
I haven’t been very active the last few days in light of the breakdown, but today we have now broken below James Flanagan’s trigger level at around 247 on the HUI Gold bugs index. We don’t know where the will stop and reverse, but I want to add in this zone and lower if we go there. As I type the HUI is down below 243 already, so we are getting there. Stay tuned!
Another down day for the miners, as well as most stocks for this Monday. There was big news in the final US withdrawal from Afghanistan, and the Taliban seizing control of the entire country in less than 9 hours. Twenty years, thousands of lives lost, and trillions wasted for the American taxpayer finally comes to an end, and yet gold can only gain $10, not a very good sign for shareholders in miners thus far.
I didn’t do any buying today, instead I did cash out of NOVRF (Nova Royalty) and UROY (Uranium Royalty) to use the funds in other areas where I think there is more potential. Typically I wouldn’t sell early like this, only exiting on signals to leave a trade, so let me explain. The CRB index (Commodities Research Board Index) is extended along with with the stock market on the upside, and is looking more vulnerable to a correction near term, which also meshes well with my thought gold, silver and miners might get one more last flush lower. I want to get as heavily invested into miners as possible, into this potential false breakdown. We got good prices on our sales today, cashing out near the day’s high after waiting for the 30 minute bar chart to get extended intraday on the upside.
I won’t deceive readers, this has been a very difficult time to hold positions. I hope you appreciate the honesty and admissions of losses enough to stay around and see the gains that will be made overall. While it’s hard to hold through corrections, we have rules in place to make it easier to do so. I will revisit the stocks are groups (copper and uranium) that we sold today, but likely after the CRB index has a solid correction. The stock market also got weak today, so the correction might not be far off, especially considering where we stand seasonally, about to head into September which is historically the weakest month of the year for stocks. We might also get stopped out of KWEB, but I have decided to give it just a little more room since everything I stop out of lately bounces big the next few days!
I don’t need to post any charts today, instead I need to manage my psychology and emotions so as to stay balanced and ready to strike as the next opportunity presents. It could take awhile, but I am certain that miners are closer to the bottom than the top, and closer than most investors think. We are still very much in the game, just suffering temporarily. If somebody doesn’t admit to having times like this, they aren’t telling you the truth. Stick with me to see how it all ends up!
One last note, the intraday stochastics finished near the high of the day, meaning tomorrow morning near the open there won’t be a trade setup in the miners. It will be late morning at the soonest, maybe even the afternoon before we get a buy setup. I’m happy to sit on the cash as long as needed, while we wait for the expected final flush.
While the GLD etf closed up 1% on the week, the GDX miners etf closed down 1% again. I continue to think we are close to a turn higher in miners that could usher in a very significant rally, and Friday might prove to be the start as miners managed to close strong. If members caught my last post mentioning James Flanagan’s analysis at Gann Global, they know the next big rally could be a multi-year, several hundred percent gain. He uses the HUI index (Gold Bugs Index) for analysis and believes the support around 247 could prove very important, a flush lower would be a washout, clearing out stops and setting the stage for the next bull. He has been quite accurate in the past, so I don’t take his projections lightly, it would be great to experience this rally, but also he thinks the HUI goes lower first, breaks below the 247 level in a panic style collapse that gets bought up heavily by the professionals. I’m not wild about riding miners lower first, but at this stage there is more risk in missing the upside bc jumping out, only to try jumping back in at the exact correct moment. I will stick with positions and let our stops decide if we stay in the position or not. Even if we are stopped out, we will look to get back involved on a rise BACK ABOVE that 247 level on the HUI index. Here is the MONTHLY HUI chart with the horizontal trendline at 247. To be exact, the HUI did break below the old lows, but only by about 30 cents, and we would be hoping for a more obvious break to really scare longs out of positions.
A hard flush below 247 on the HUI could be exactly what the gold miners need to start the net big bull.
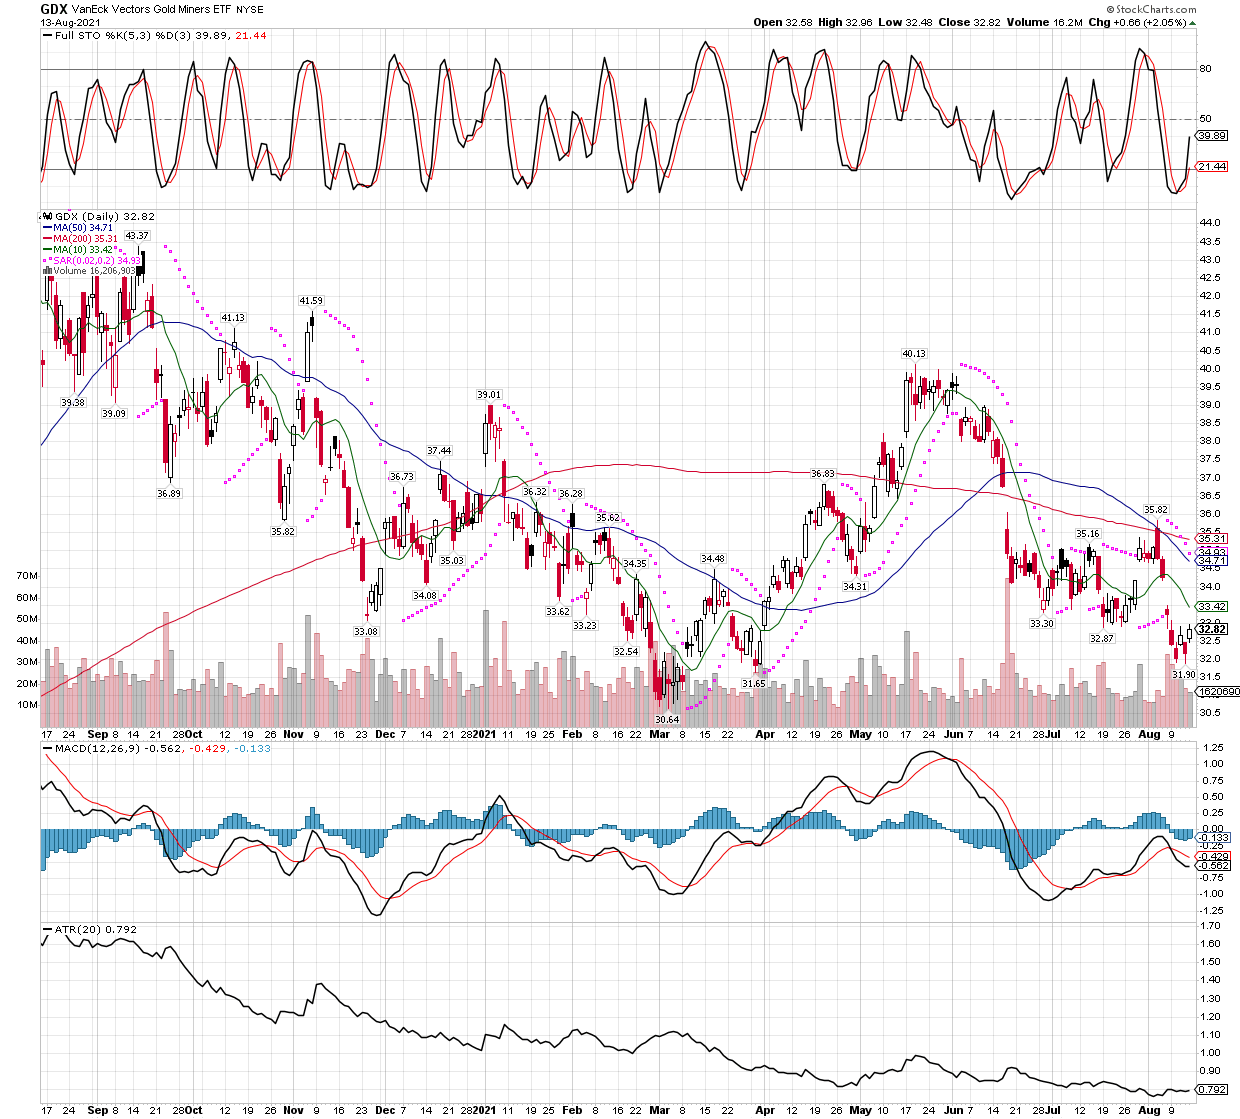
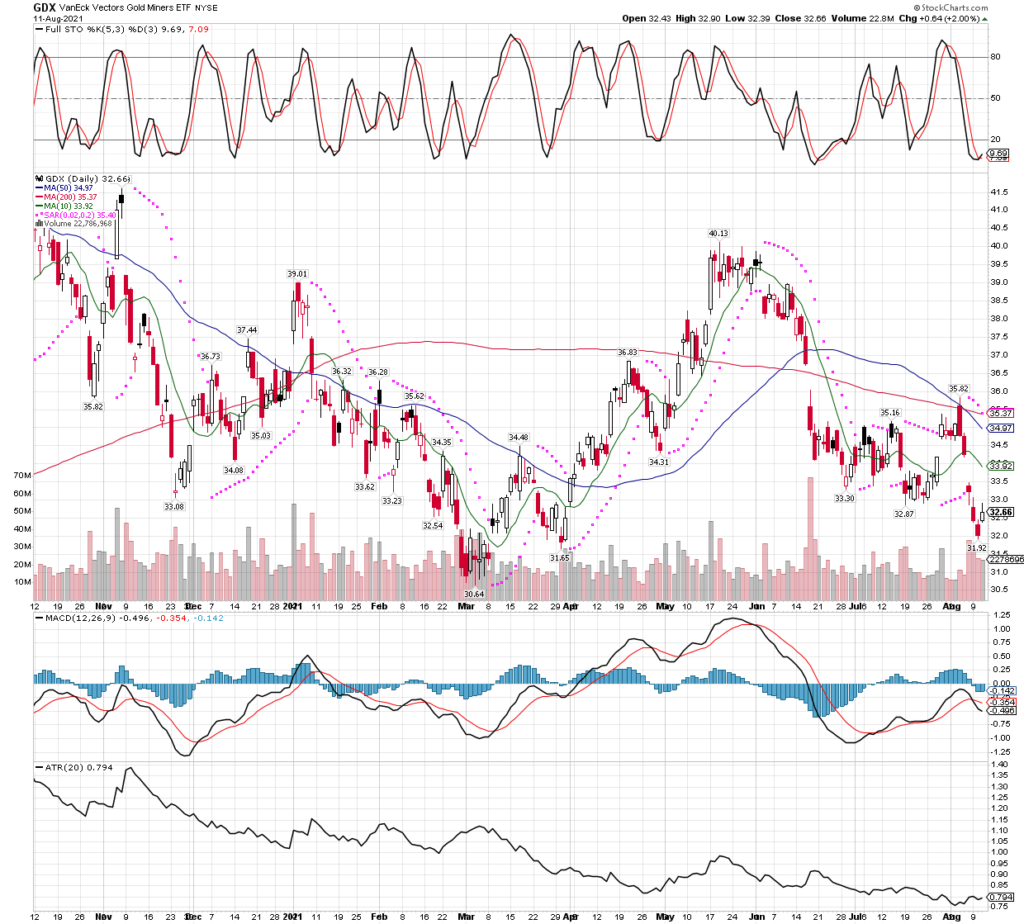
The GDX etf will confirm a cycle low with a close abo e $32.87, and closed only a nickel below that on Friday. My hunch is that it’s quite likely, note the stochastics just beginning to exit the oversold zone with force.
We want GDX to close over $32.87, very close now.
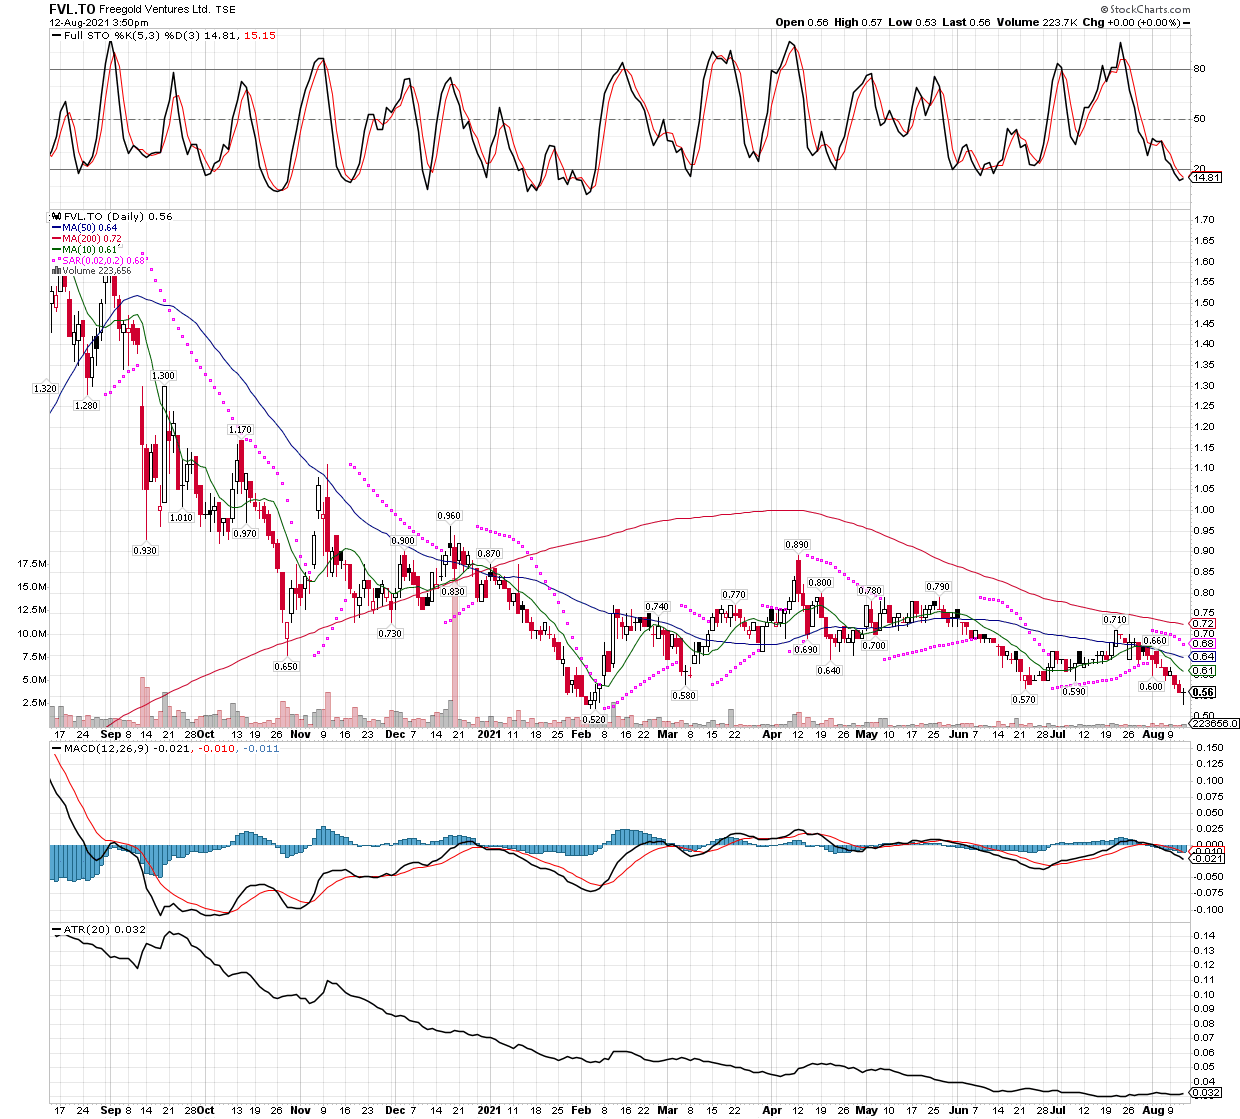
So the situation is starting to improve for our miners, now is NOT the time to sell, in my opinion. However, when we hit stop levels, we will exit as our discipline requires. It can hurt at times, for example our recent stop out of FreeGold Ventures (FVL.TO) occurred, only to see the stock rebound 7% on Friday! We are getting close enough to the bottom that we prefer not to be stopped out of any more shares, we want to own as much as possible for the impending rally. Let’s see what the new week brings.
Until now, I have been wrong about the bounce following through. No sooner did we get a great upside day yesterday, and today it reverses! On top of that, we were stopped out of another position in junior explorer FVL.TO (FreeGold Ventures). We were also able to take advantage of the weakness in early trading, once the technicals got oversold about 10 am or a little after, to start buying the SILJ etf (Silver Junior Miners ETF) again, adding to our long-term holdings. While we didn’t surrender all of yesterday’s gains, we don’t have to tell readers how rough a ride it has been overall. I still maintain we should be heading higher before we go much lower, if we go any lower, but there is no denying the weakness persists, it isn’t fully behind us and until it is we will experience pullbacks like today. That said, I am a bit surprised to see 73% of yesterday’s gains given back after the first strong day, so I was careful not to buy heavy when I got the buy signal today. We might have to right this one out for awhile, the way it’s looking. I appreciate those who have had the patience and fortitude to stick with the program thus far, I know it isn’t easy, but I’ve been through it all before and will do what has always worked over time.
Let’s first look at what stopped us out today, FreeGold Ventures (FVL.TO). While I occasionally override a stop level, I generally try not to do it to often. I will admit I was tempted to do it today, but with the group so weak lately, and some junior miners getting annihilated on down days, I decided to ignore my hunch to stay in because I think a big percentage gain day or two might be close at hand. I say this because it’s happened to me a few times over the last several weeks, I stop out of a trade, and a day or two later the junior explorer is up 25%! It can drive one nuts if you let it. lol I am fine with my decision to clip the stock, since on a few occasions the junior miner has proceeded to lose 20-50% not long after I stopped out, so all in all, best to just follow our discipline and move on to the next idea. Here is what FreeGold Ventures looks like, a chart I hate to sell at the moment, but the rules are the rules and they exist for very good reasons.
FreeGold is now doubt a terrible looking chart, however it could be argued that today is not the best time to sell
I bought a little more of the SILJ etf, I don’t have any worries about this one longer term, but still kept my buy orders small since we already own a lot. Since this is a longer term holding, I will post the weekly chart, which despite all the stress and fear in the mining sector, is still a fine looking chart. Nothing is broken here.
SILJ’s WEEKLY chart looks fine, I am happy to add anytime the technicals get oversold down in this area.
One big positive we have going for us, is the mining sector is posting the best earnings reports in history. Something will have to give, because the miners are raising dividends, and have exploding cash flow and profits, all this while the group´s stock prices are performing terribly. Either the quarterly reports will start to reflect just how terrible the fundamentals are, or the fundamentals are awesome and the stock prices will catch up with to the fact. We are betting on the latter, just be prepared that it might take some time. The best thing about trading miners is they make up lost ground very quickly, in fact not many groups can tack on the gains like miners, and they can keep on running after that as well.
I am not subscriber to Gann Global Financial and James Flanagan, but I enjoy hearing what he has to say when he offers material for potential subscribers. I will post a link to a video he released today, for those that are interested. I am in no way compensated or affiliated with Gann Global, I just find their work very worth the time to listen, and I like that he has a longer term approach than many of today’s newsletter writers, who seem to be interested only in calling the next day! Here is the link if you want to listen.
Finally, we get a respite from the non-stop slide in the mining sector. I will go out on a limb and predict more upside near term for a few reasons. First, the daily stochastics are deeply oversold and even with today’s strength, have not yet risen out of the oversold zone. Second, today was the first day in a awhile we saw just about the entire group rise strongly together, a change from the recent action where any strength the group did experience was concentrated in a few names, while other mining stocks continued to make new lows. I also read the DSI is now down around 8, it hasn’t been that low except twice in the last 3 years, if I’m not mistaken. Lastly, the miners were the strongest group on the board today, which will draw eyeballs of the short-term traders that only seek what is in play to trade. Whether this is THE bottom or not remains to be seen, but I think it’s a safe bet we see more upside before we head lower.
Today was easy as far as my trading, my intraday stochastics never reached fully oversold, so I didn’t get the opportunity of an ideal setup to buy or add to any positions. No trades at all. That’s ok, the way things closed today, the miners are working off today’s run and the technicals are approaching the oversold area. The plan is to be ready to add in the first hour or so, but only if the stochastics or other intraday technicals reach oversold, my guess would be about a half hour after trading opens. That is for a flat to weak open, but if we instead get a big gap up in miners, we might have to sit on our hands again until Friday, when we will again look for the technicals to get extended on the downside. In any case, there is no denying we re heavily loaded, so we will be fine with whatever the markets present tomorrow, a position I like to be in.
Let’s take a quick look at the daily chart of GDX to recall how oversold the stochastics are. Keep in mind I use the more sensitive 5,3,3 setting, so another’s charts won’t always look exactly like mine.
GDX stochastics way oversold, plenty of upside if the miners decide they want to try itGDXJ looks very similar, I drew some fibonacci levels on this one to give an idea of the potential, $48+ should be easy
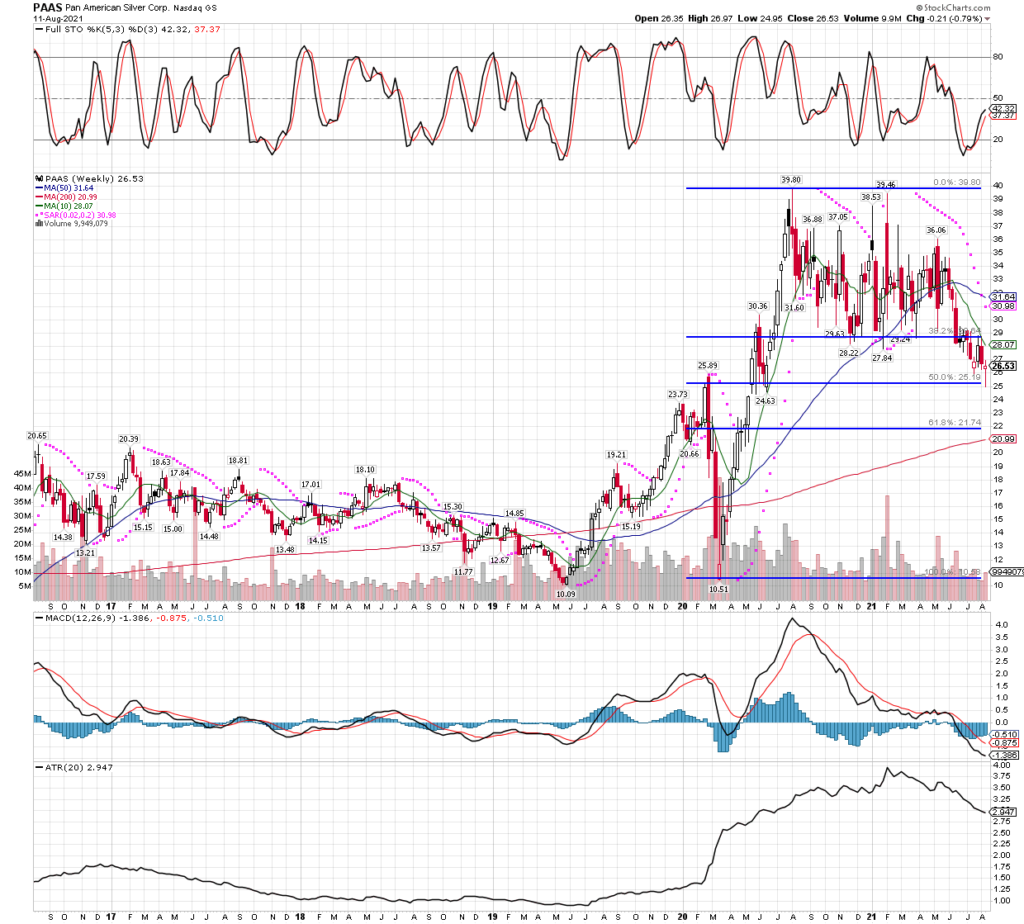
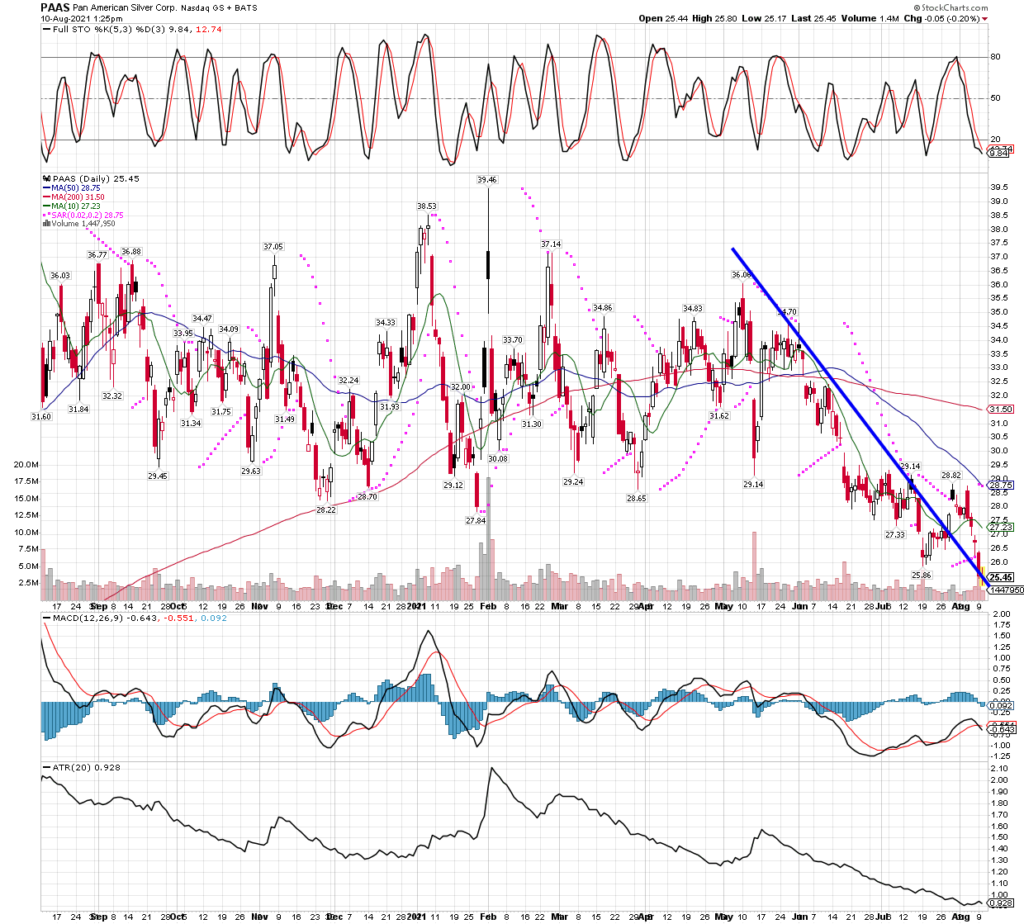
We also saw some bigger names that have been terrible lately start to pick up, in fact some had a standout day. This lends more credence to the idea miners have finally turned the corner. Let’s take PAAS (Pan American Silver) for example, also the second largest holding in the SILJ etf. I will post the WEEKLY PAAS chart first, to show what a fine 50% fibonacci retracement the stock has completed…
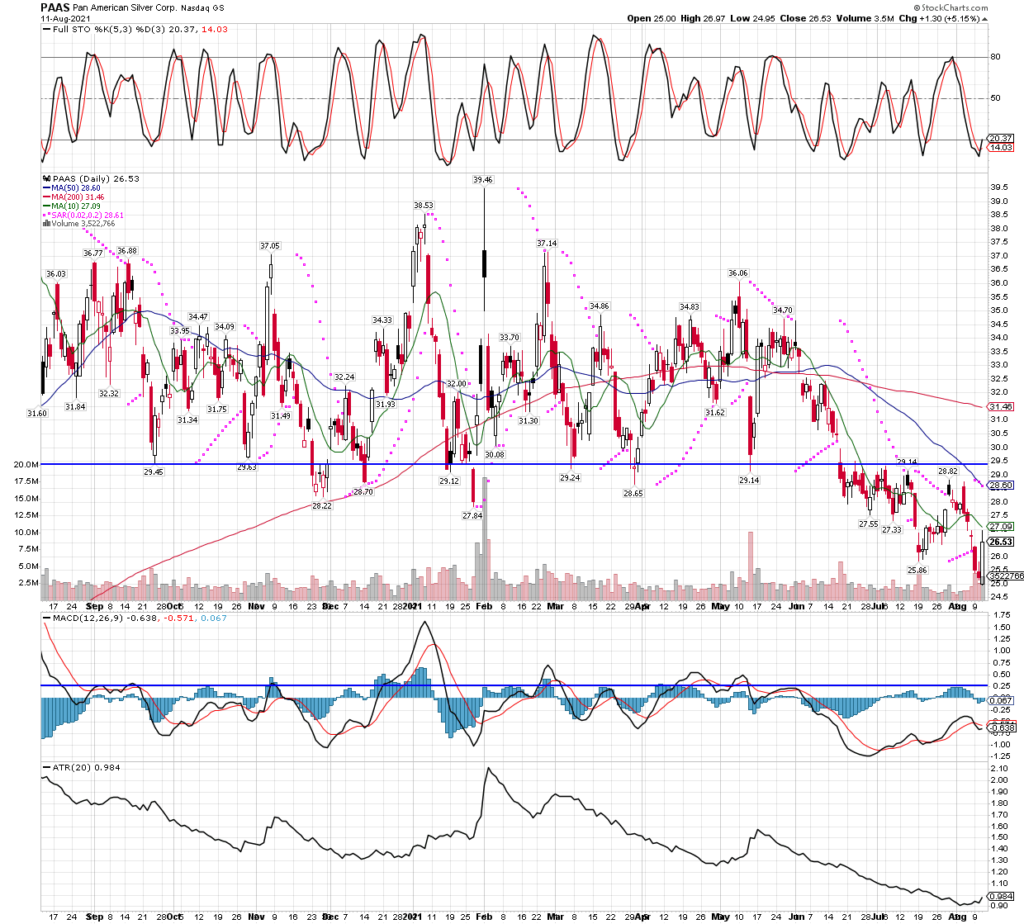
Now we will go to the DAILY PAAS chart, notice it shows the same technicals as the etfs above, but also note what a big move PAAS had today, normally stock that onl moves a couple of percent at most in a trading session, today was up over 5%.
Pan American Silver will not surprise me if it smashes higher through that $29-$29.50 area that it fell through recently
So tomorrow morning we will wait to see if the intraday technicals can dip a little further from where they closed today, if so we have some buying to do. If they gap higher instead, we will sit with what we have until the afternoon, or Friday morning open works lower to oversold.
Another day, and only a small respite from the pain we have had to endure. It’s ok, we can take lots more, if that is what the market has planned. Since I’m still not feeling all skippy and happy due to what feels like a never-ending drop, I will dedicate today’s post to a “chart-fest” as I didn’t post any charts yesterday.
In the following charts, I am mostly trying to show you similarities in how the miners have come down quick and hard, forming their own downtrends, which have now been broken to the upside. It would be much preferred to see them break higher with force, but we will have to accept how they want to change their trend. Patience is required, but just because it might take longer does not mean the move will be any less significant by the time we decide to exit, and yes, I still think our holdings will be profitable overall.
As a side note, members should have received email alerts on buys made today, they include GDXJ and SILJ while others limit orders were not filled. Again, we waited until the intraday 30 minute bar charts worked their way down to oversold by late morning, before we made any buys. This strategy has worked well during this very difficult time, and did again today, and we were able to bring GDXJ holdings up to a full-risk position, it could turn out to be a very good buy at these levels.
Let’s get to the charts, note they all have a downtrend line that has recently broken to the upside. This does not mean they are going to scream higher, though it typically suggests the downward momentum has no broken. We should find a bottom in here somewhere, in other words. Here we go…
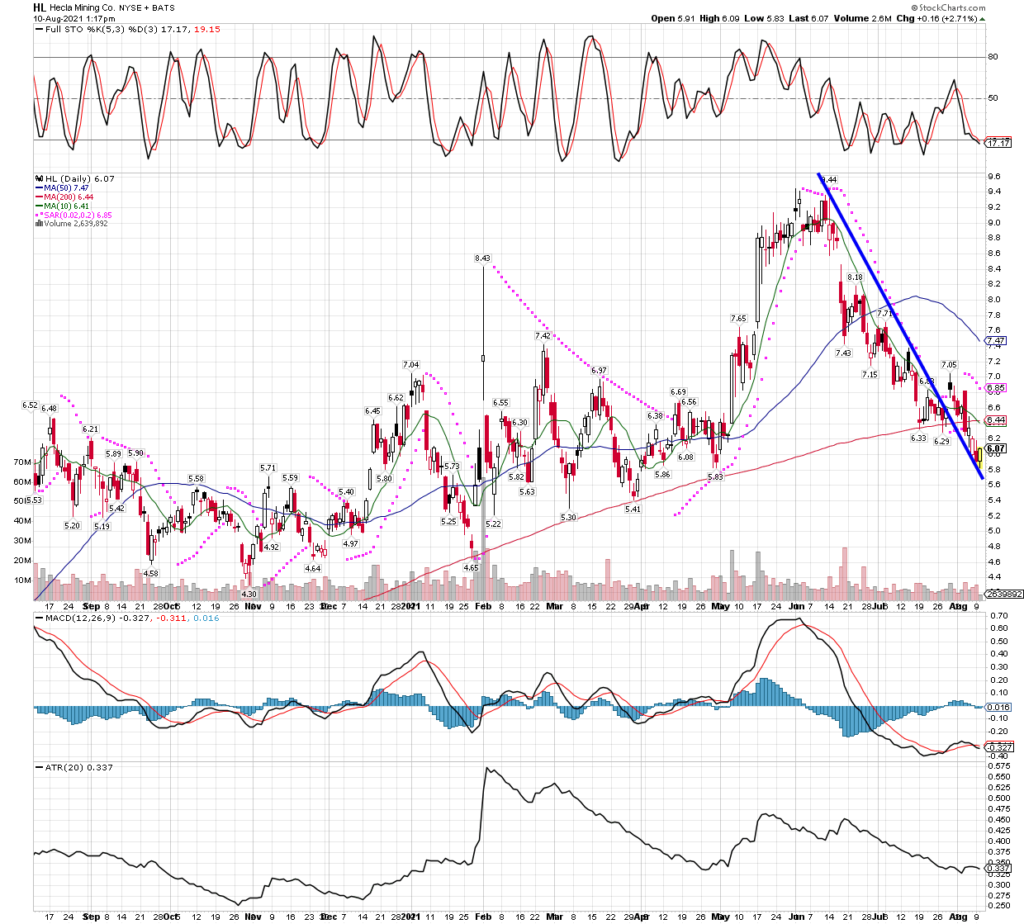
Hecla Mining backtesting it’s broken downtrend lineGDXJ etf, the junior miner etf is also backtesting it’s broken downtrend lineMcEwen Mining is also testing it’s trend line breakSILJ- the junior silver miners etf looks a lot like the others, backtesting it’s break of the downtrendPan American Silver looks similar, coming back to test the breakout of it’s downtrend shackles.
You get the point, I could go on for a long while being there are so many charts that appear almost identical. I like when so many charts in a sector look so similar, it makes it easier to play the group, and give us a chance to hop on some “laggards” at times, once we see a few names in the group start higher. That can be a good sign to do some buying ourselves. Hang tight and stay focused, this will pass and offer up great gains again, just like always.