As miners continue to go sideways the last few days up near recent highs, which I like, a new buy signal on the marijuana etf MJ is here. I have not bought any yet, as my major focus continues to be on the precious metals miners, but I will look to acquire some MJ etf (the Alternative Harvest etf) into the next oversold intraday technicals on the 30 minute bar chart. I was tempted to start buying some before the close fo trading today, but the marijuana stocks were closing at the high of the day, after a long, tedious downtrend day after day since the beginning of 2021. Waiting for that longer term downtrend to re-exert itself in the next day or two seems like a better bet to start buying, rather than chase a short-term overbought move, since they always seem to fizzle, at least in 2021 so far. It’s the same way I have been buying my miners, there is no good reason to chase moves up in the context of an overall downtrend, except for the day they make the turn higher permanently. If you can tell me when that is, I will change my buy strategy!
I will keep this post short, and just show you the daily, weekly, and long term monthly charts on the MJ etf, so you can see how oversold the technicals are. Of course, they can stay oversold for awhile, so we don’t want to go in too heavy at the first positive sign like we had today, there have been many other days like this in the last year, and MJ always manages to head lower again rather than turn the trend up. Trading is just a game of probabilities and risk management, not much more to it. Lets take a look at those charts….
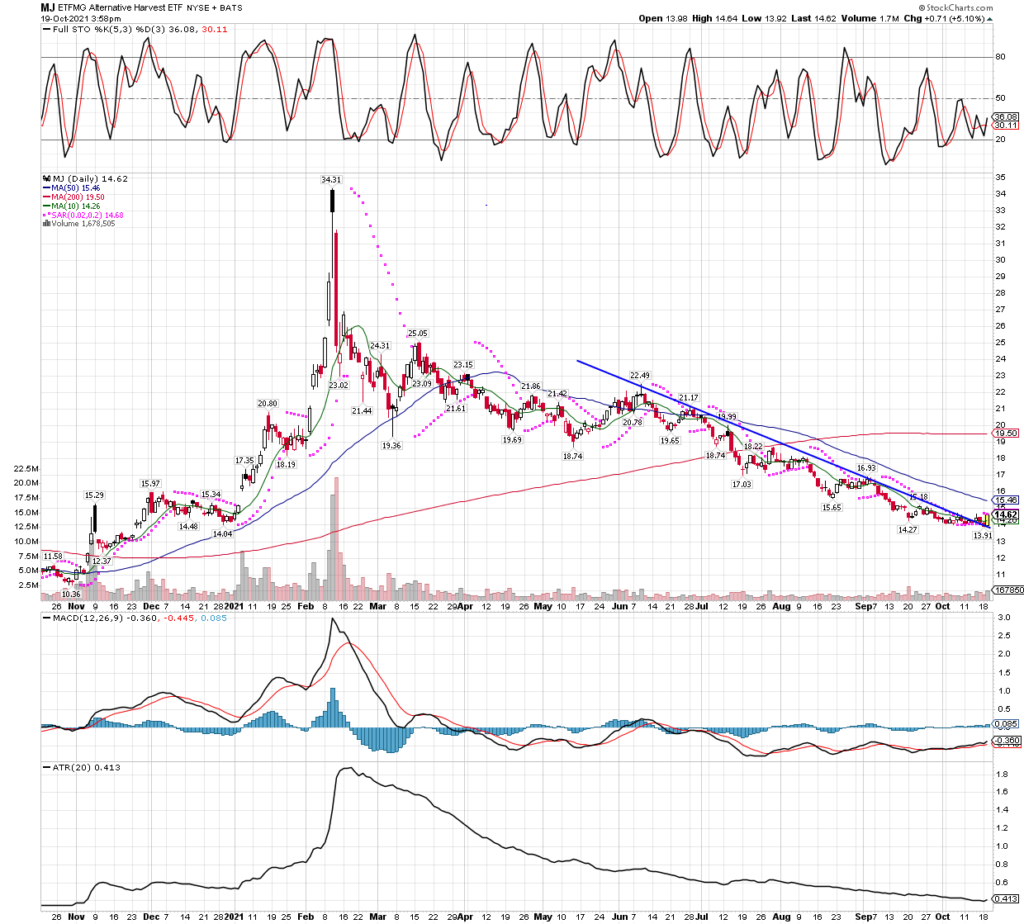
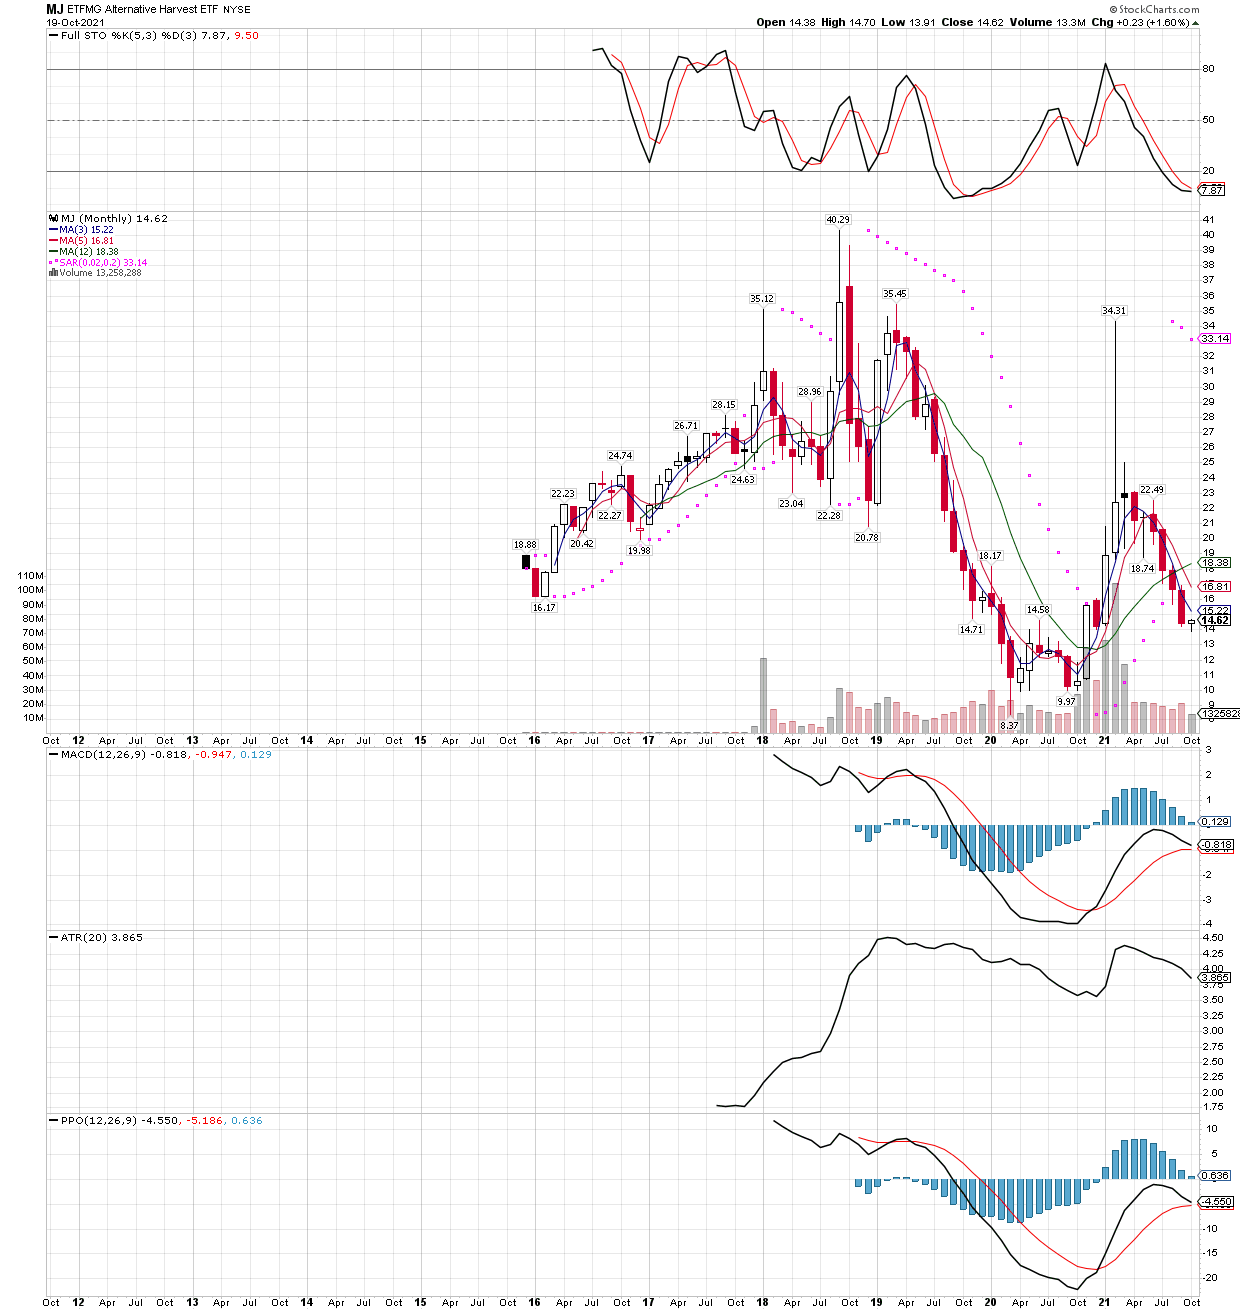
MJ’s daily chart shows a downtrend in place since June is no being broken, while oversold stochastics are just turning higher. I am willing to bet the MJ etf gets to the 200 day moving average at some point over the next few months, if not much higher. The WEEKLY chart for MJ also shows drastically oversold technicals across the board, and the etf is in a triangle that is converging rapidly, suggesting a break out one direction or the other. After an overall downtrend since 2018, my bet will be that once MJ finds some significant buyers, this etf will easily take out that $20-$21.50 area at a minimum.Long-term MJ MONTHLY chart with very oversold stochastics that are about to cross higher. We need to decide what time frame signal we are going to trade, being all three charts are showing oversold technicals, we can choose whichever we like. I usually buy into the longest term signal available, in this case the monthly setup, in cases where I will be going against a well-entrenched downtrend. This allows me to expect and ride out the bumps until the etf not only turns higher, but goes through several intermediate cycles, which should get us to the next “runaway” phase of the new bull market.
Heading into the last half hour of trading today, I’m pleased to see the miners still up close to the highs today, and after a stellar day. This is the first day in a long time the miners made gains all throughout the day, and managed to hang onto them, so its a very encouraging sign. I wonder if the market is going to start treating the stagflationary possibility more seriously, and if so, precious metals and their miners should be a great place to be invested.
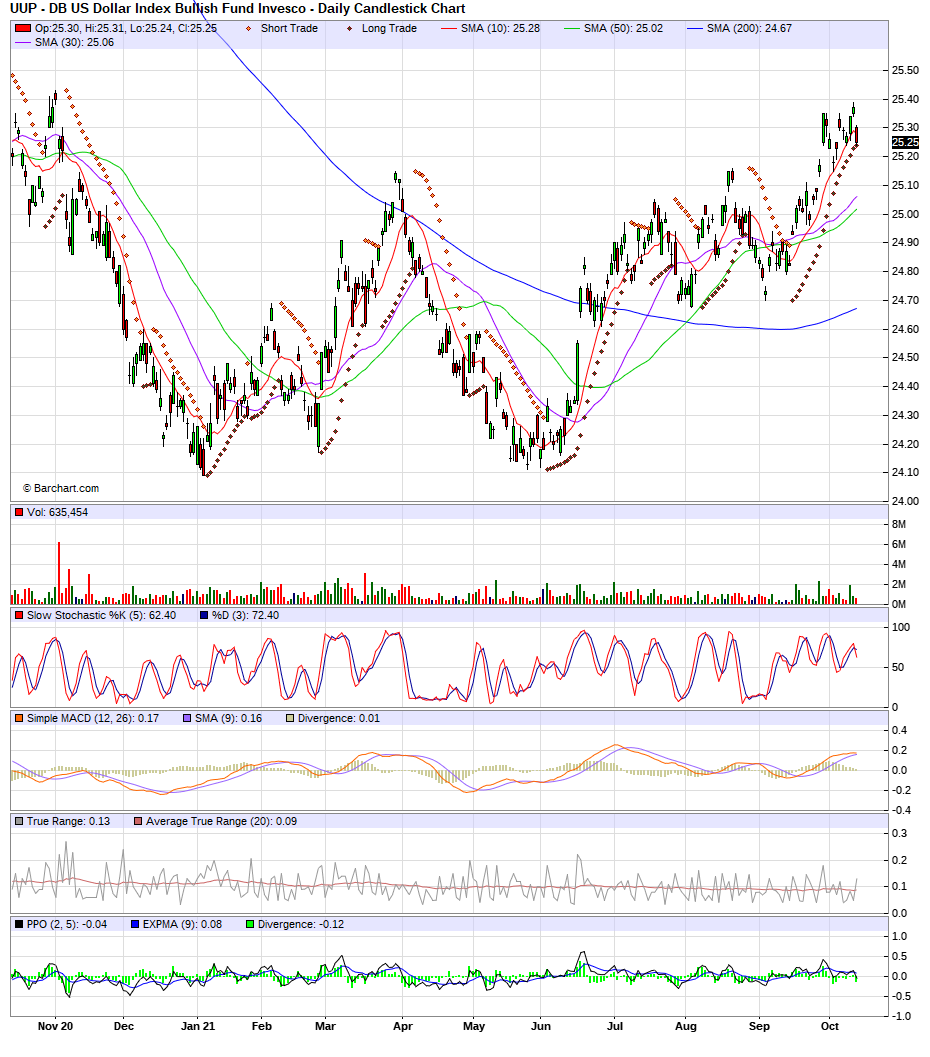
On top of that, its looks like the USD index might be topping out, or at least due for a break. I don’t put too much weight on the USD index when trading gold and silver, as it’s just a measure of one fiat trash paper vs the others, in my opinion meant to confuse investors and get them to take their eyes off the ball. Below is the daily dollar chart via the UUP etf, I won’t argue whether or not it has seen its 3 years cycle low already, or not, but its clear the dollar could have some downside near term, which should lend support to precious metals.
Daily chart of the UUP (US dollar etf)
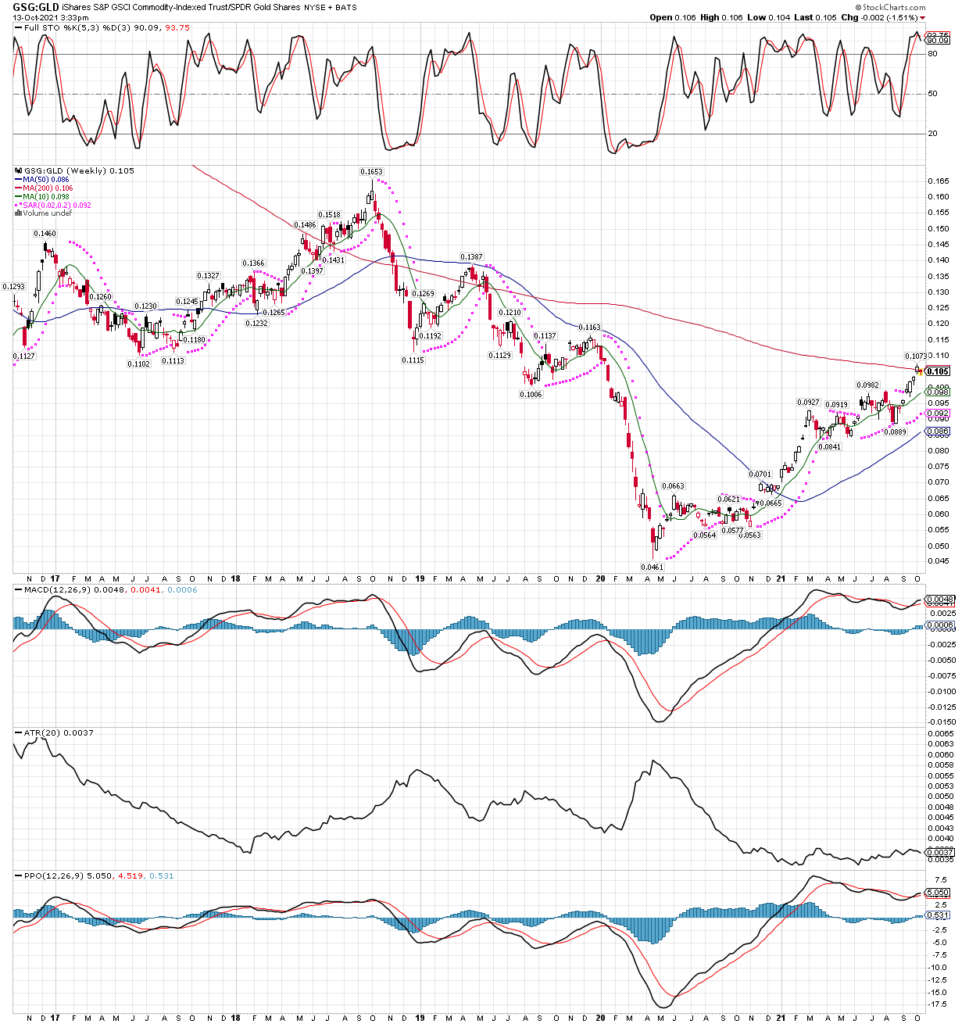
Another influence I am considering is that the commodities vs. gold relationship looks to be reversing today, after 15 months or so of gold under-performing the other commodities, that looks like it might be changing, more so because we see resistance and overbought technicals on the WEEKLY chart of the GSG:GLD ratio (the Goldman commodity etf with 50%+ oil in it, and only 6 or 8% gold vs. the GLD gold etf (100% gold). While I don’t expect any commodities to get too weak in this economic environment, it is time for gold to take the torch once again as world economies start to weaken for various reasons. If you ask me, the economies never fully recovered from the fiasco that was rearing its head BEFORE the covid event occurred, but now even with all the money printing, we are heading back to the realization of broken supply chains, most small businesses still closed down, not many people traveling, while many are losing their jobs for the now wise decision to NOT get injected with an experimental drug that looks like it makes one MORE vulnerable to the virus than if they did nothing, among other things. All this occurring in the face of central banks starting to tighten monetary policy, which is almost laughable but happening nonetheless. After all, they have to appear as if they are responsible! So while I would not short commodities in a zero interest rate world that is very likely to stay that way for some time, I still would bet on what I see will be the strongest commodities for the next year or so, gold and silver. Everything else has rocketed, while silver is still less than half its 1980 high price! Below is the WEEKLY GSG:GLD ratio chart, if this turns in earnest, we might be on the cusp of the final and strongest run in the gold bull yet. If the stock market starts lower, that will only add fuel to the fire. Get your miners, or get your metals, or some of both.
GSG:GLD shows commodities overbought vs. gold on the technicals while sitting right at the 200 week resistance.
As I type I see that the intraday technicals have now pulled lower into oversold territory, so I will look to add to positions before the close, or tomorrow morning not long after markets open. I won’t be making large buys as we’re already loaded up for the ride, but I still like to remind myself what one should be looking to do, so they don’t make the mistake of taking profits way too soon or some other error. It’s time to BUY or HOLD, but nowhere near time to sell, despite most miner etfs being up 8 or so days out of the last 10.
Today we saw some follow through on the miners to the upside. This post will be short because nothing has changed, other than we added to our GDXJ etf position. We will look to do some more buying tomorrow if we can get the intraday technicals into oversold territory, which seems likely being they are already close to oversold intraday, and they are getting overbought on the daily chart. When markets put in bottoms, and especially after such extreme moves lower like we have witnessed in this sector the last 15 months or so, it gets difficult to buy the exact bottom. For example, today I noticed many amateur traders on various blogs stepping into miners with the hopes they have caught the bottom. Well, they might have bought the low, but it doesn’t matter the least, if they sell out after small gains, or on the first sign of weakness. They will just tell themselves they are being prudent, or managing risk, which sounds great except they are also guaranteeing they never make a big score, its that latter part that never gets mentioned or addressed!
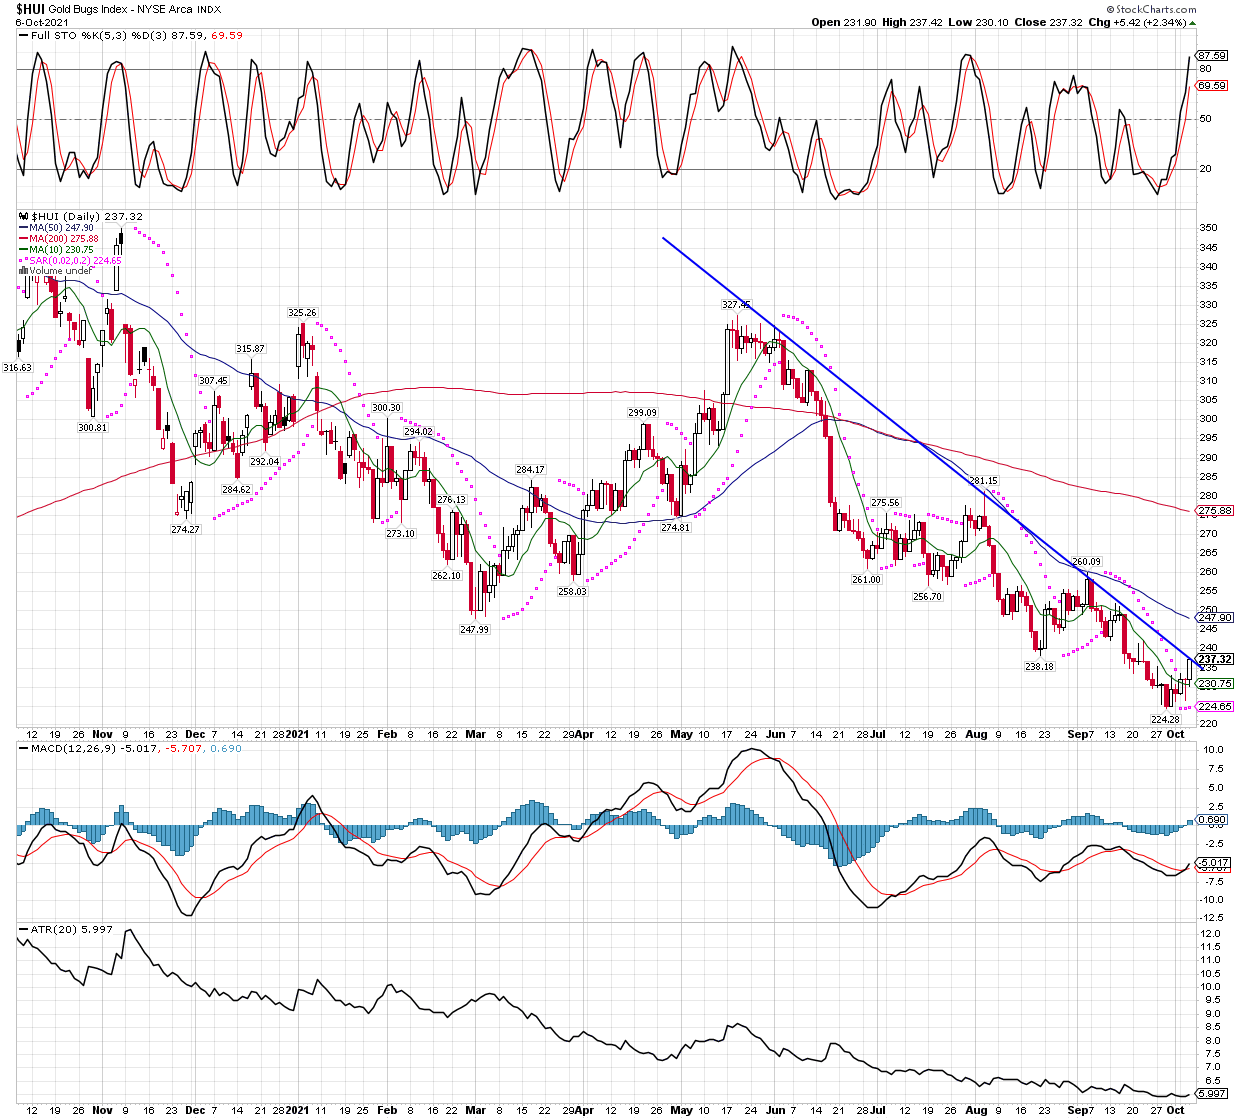
So today we saw the HUI index finally break through the daily downtrend, which implies we have more upside soon, though does not guarantee it continues tomorrow. If the amateurs can get shaken out in the morning, enough to push the technicals to oversold on the 30 min bar charts intraday, we should be happy to but their stocks from them. Let them try again after miners rise another 5%, only to get scared out and give us their shares cheap once again….rinse and repeat. Its been a tough ride, but its just part of the game. If one has made it this far, now is definitely not the time to get out, its time to buy or add, or sit on our hands, but don’t give your shares away to a guy that has bigger nuts than you, it never pays! Here is the HUI gold bugs index, nice and simple….
The HUI gold bugs index actually closed up at 239, above what it shows on this chart, but its a clear break of the downtrend now.
Well let’s hope I have more to talk about soon, and today is a good example of some changes that are finally starting to occur. It has been one tough ride, I won’t deny it! Today we see a few things happening that always precede a trend change, for example the short term charts start to flip to positive before the long term charts show the strength.
While I didn’t make any changes today, thus have no trades to report, I want to show you what i noticed today. On top of the early weakness which was again reversed during the day to close positive, let me show you some charts. GDX, GDXJ, and SLV among others, all turned higher on the half-hour bar charts, in fact some are already showing a “golden cross” higher, basically confirming an uptrend on this very short term basis. We want to see more strength, and start turning the daily, weekly, then monthly charts higher again, but its a start!
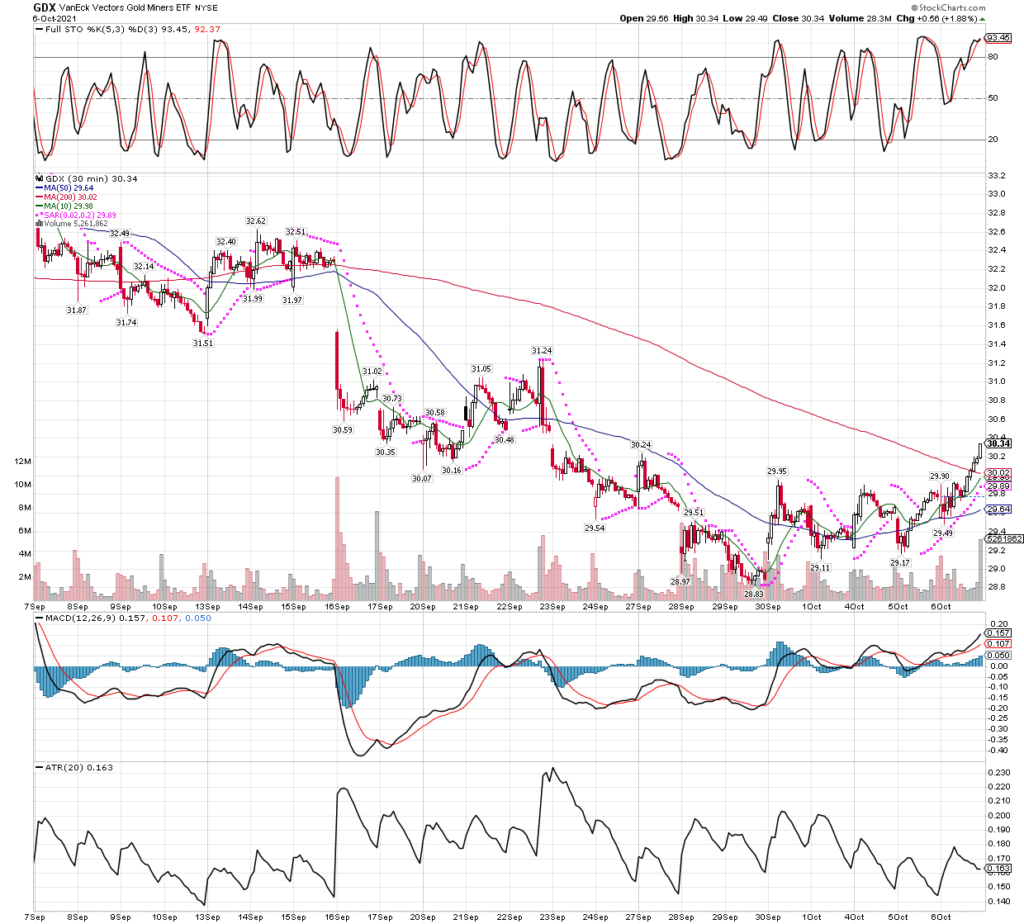
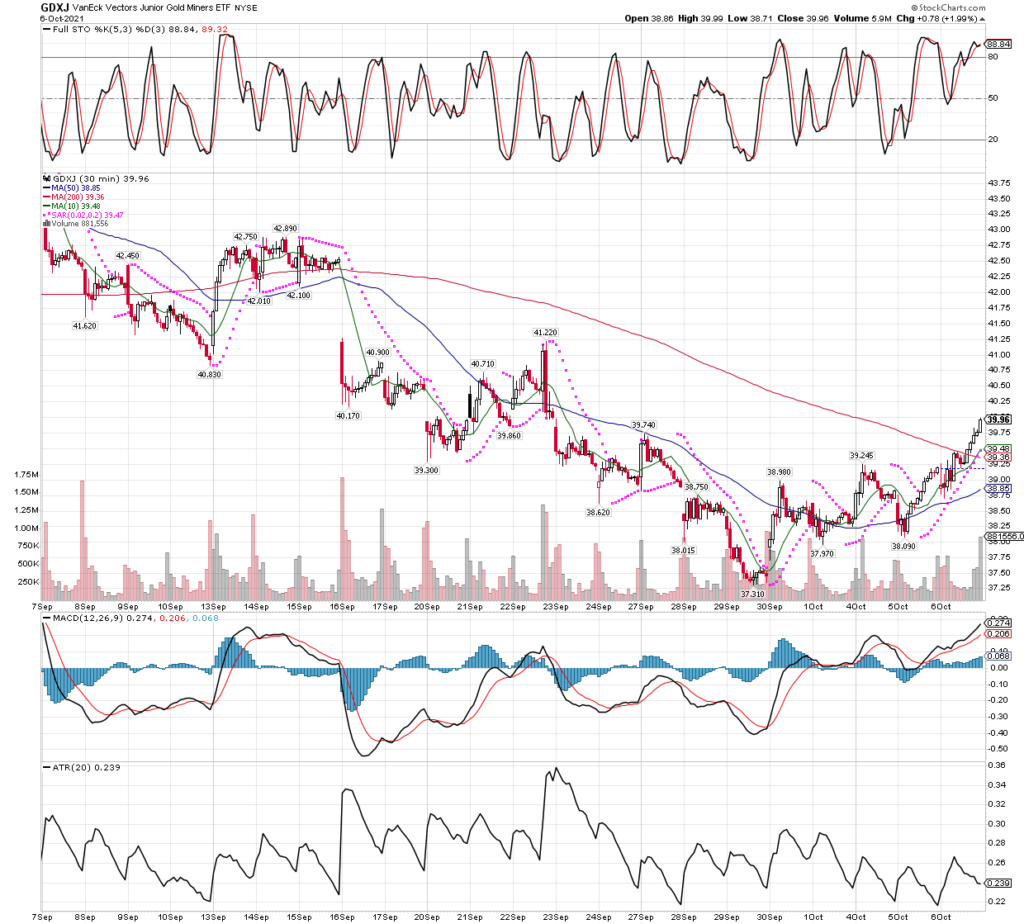
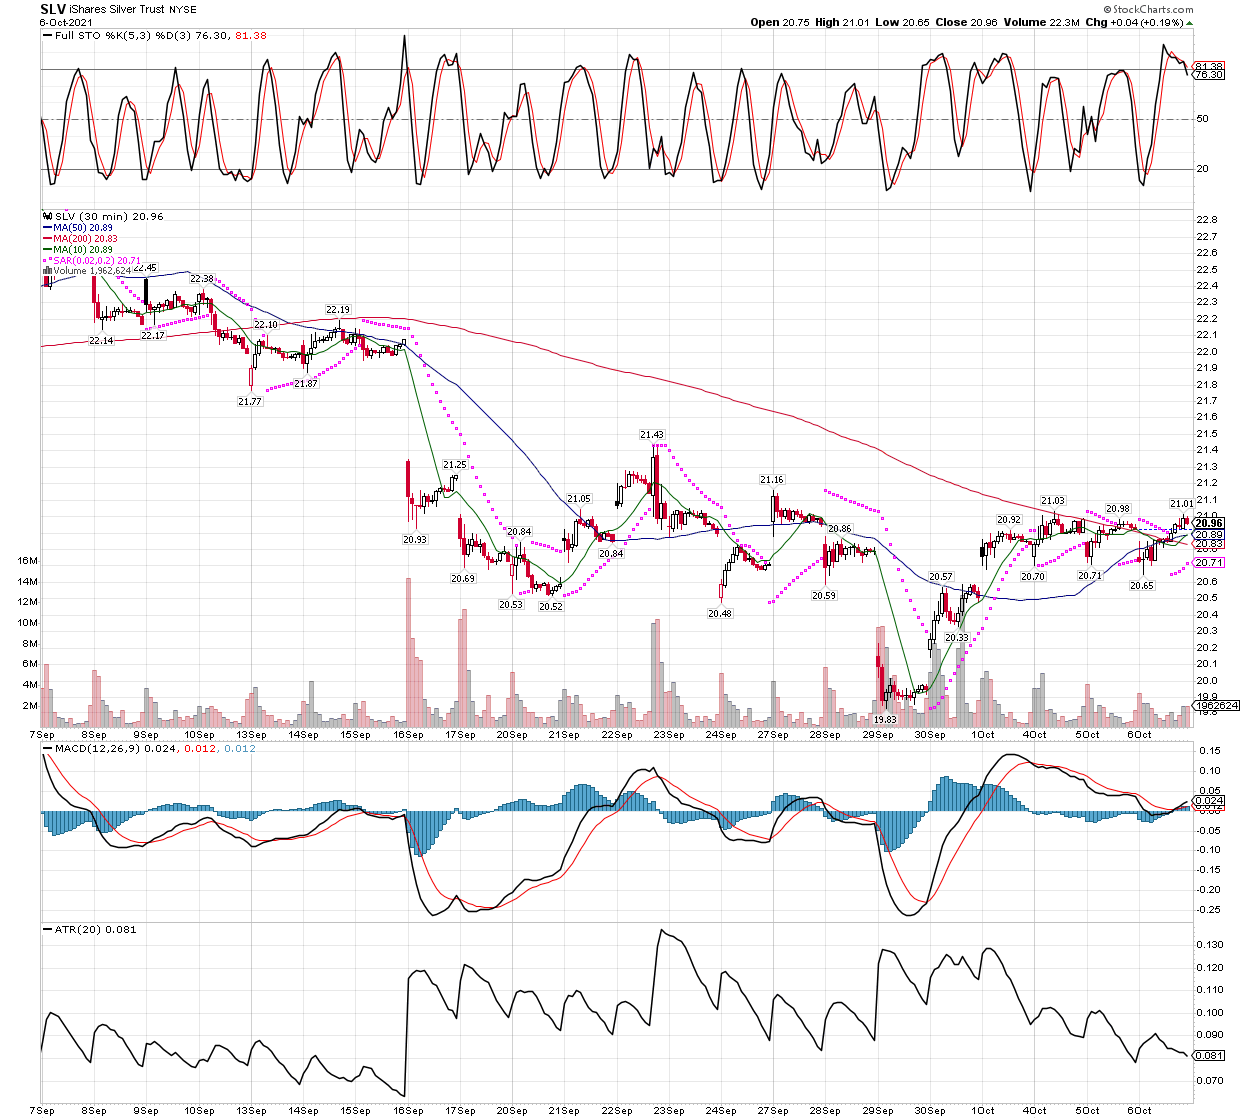
GDX intraday chart with half-hour bars breaking decisively above the 200 period moving average, a golden cross is soon to occur if the strength can hold, and will confirm a short term uptrend, the first key to turning around a long term trend. The other intraday charts will show similar action, also good to see because it’s a group effort!The junior miners and explorers via GDXJ are showing the same action.Silver is even better, in that it already has a golden cross in place, SLV should go higher in the near term.
Lastly, let’s back out and look at the daily GDX chart, which shows a PSAR buy signal triggered today. It’s the sole pink diamond on the far right side of the chart, and GDXJ again is similar with it’s own PSAR buy triggered today. I will also not that Bob Moriarty from 321gold.com wrote today in his article that he thinks the bottom is here. I respect his opinions and while nobody is right all the time, he gets darn close and should not be ignored. Keep in mind the miners have started weak in the mornings the last couple days, only to finish much stronger. Lots of bulls are out of positions right now, sitting on the sidelines and waiting for miners to turn higher. If this is the turn, they can gain upside momentum very quickly, so if I did not own miners yet, I would be making big buys tomorrow!
I won’t just run out and buy first thing tomorrow, but I will be ready to add to positions in strong names like Equinox Gold (EQX) once the stochastics reach oversold on the intraday charts. That could happen tomorrow later in the morning (at the soonest) or if not by the close tomorrow, then I should get a chance on Friday at some point, but I will wait until miners get oversold no matter what.
While it could still change in the future, sure enough my post yesterday suggesting the best bet is to always assume support and resistance will hold, was right on track. I will re-post the chart today, not to toot my own horn because lately there has been nothing to celebrate, but to show in real time how that rule comes into play. Today we are now back above the “breakdown”, proving its best to consider support and resistance as areas, rather than definitive lines in the sand.
Before I post the WEEKLY SLV chart again, I have a couple items of interest. First, over at KingWorldNews we have a short article directly addressing the silver miners and their recent beatings that you should consider. Can it get much worse, and if not, then what is the proper bet? I say higher, especially when we are seeing “historic” selling. We should ask ourselves WHO is doing all this selling, considering most investors have been running scared and selling for over a year now? Could they be pushing SILJ as low as possible to cover the shorts they use to steer prices lower, just before they do heavy buying to cover the shorts and go long the etf at the same time? My guess is YES, that is probably what is happening and we will know soon enough if I am correct. I did buy some more SILJ this morning with these thoughts in mind.
Another interesting occurrence is that the WallStreetSilver thread over at Reddit has caught fire with the number of new members joining each day now. We are seeing 2-3K new subs each day this week, after months of only 50 new members per day, if that. I will let you draw your own conclusion, but I can’t see how this is bad for silver!
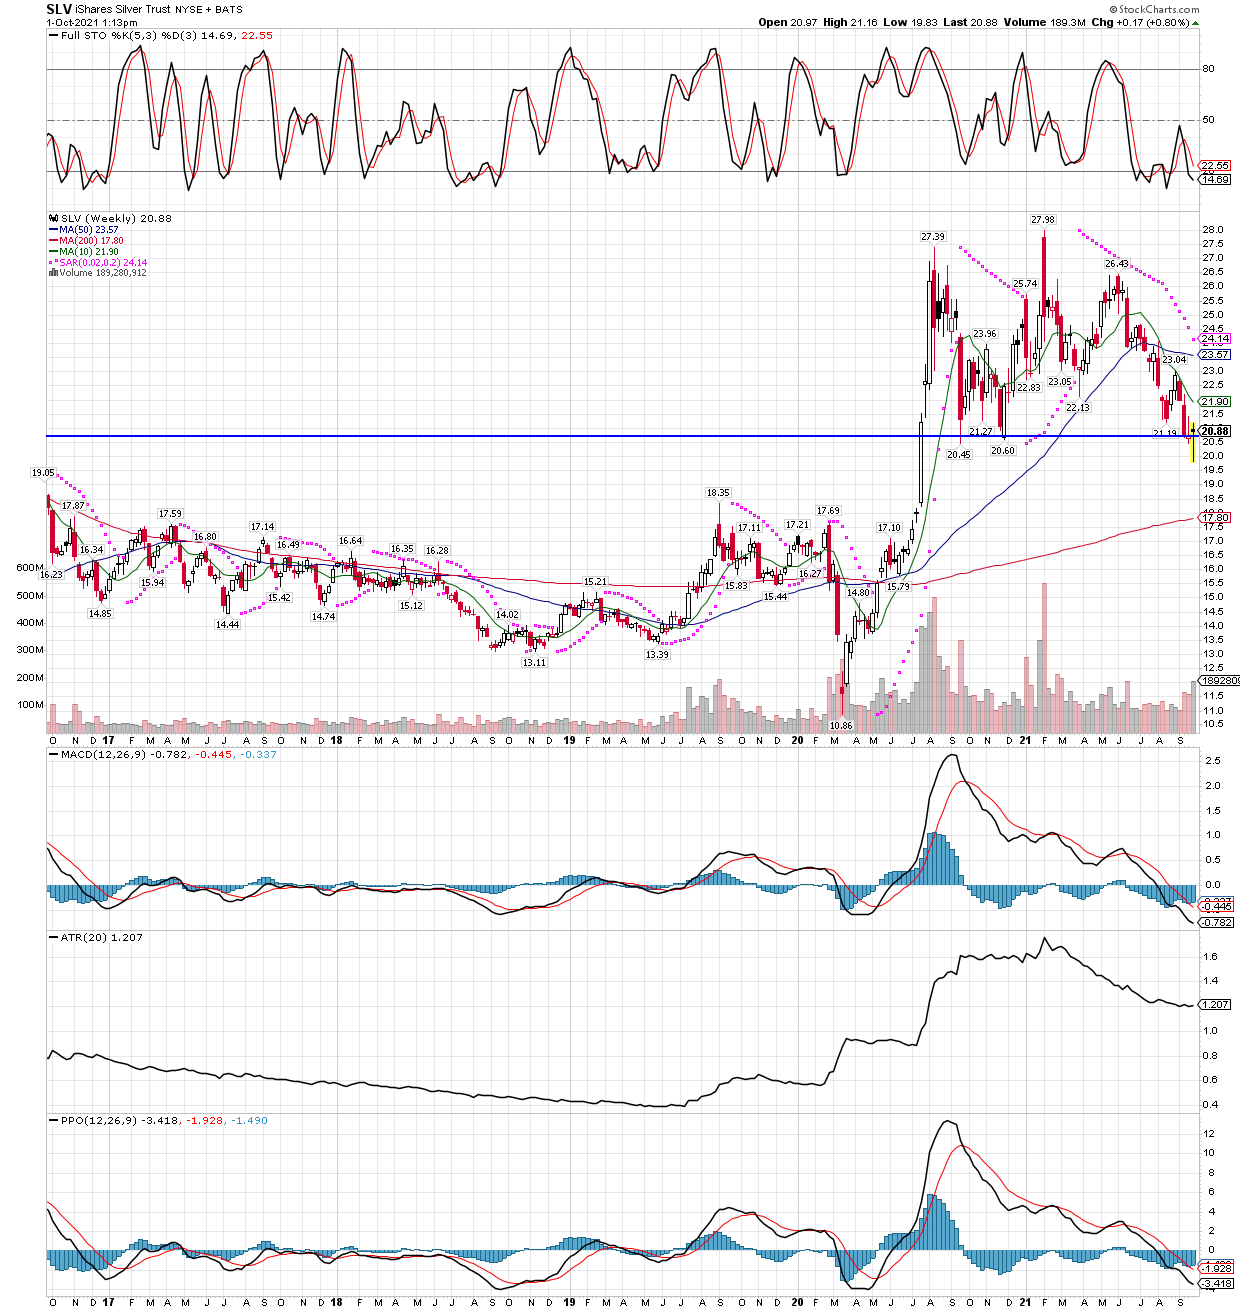
Now, let’s go check on that SLV chart, we are looking at the hammer that formed on the last bar, which is this week…
Turns out the breakdown so far has turned into a reversal back higher, because the best bet is support and resistance will hold.
For those unfamiliar with the WallStreetSIlver thread on Reddit, I posted this same article over there today. It’s a group of investors focused on silver for many reasons, with lots of great analysis and interesting opinions, I would suggest everybody check it out and bookmark it, as its one of the fastest growing groups on Reddit. Here is the link.
When I started out as a trader about 25 years ago, one of my “mentors” (ie. trainers) in my firm taught me to always assume support and resistance will hold, vs be broken in a continuation pattern. Of course, support does not alway hold, but he taught me that even when a trendline breaks, its not usually followed through with lower prices, more often than not the trendline is more of an area than a definitive line in the sand. Some have said we should draw trendlines with a fat crayon, rather than a pen, because we can blow through support and get many investors shaken out just before prices turn higher and run. I mention this with the WEEKLY chart of SLV I post below. I have seen many around the internet pointing to this chart suggesting its nothing but downside for SLV now, but I recall what me mentor taught me, and I am sure he would be a BUYER at the new lows rather than a seller if he were to take a trade. This is not at all a commentary on the fundamentals of silver, which most here would agree are very bright, this is just about how we interpret lines when they are crossed, so lets see what happens as I am typing this we are still well below the $20.50 “line”, if I am correct we are more likely to see SLV rocket back over that level and higher over the next few days or a week. Even if SLV goes lower over the next day or two, which I tend to think is unlikely, it should be back above that breakdown level 70-80% of the time. Let’s watch!
Here is the simple chart, like Patrick Karim of badcharts.com, I have found charts are most useful when kept simple…
Combined with the oversold stochastics, and MACD, this “breakdown” on the weekly chart I’m willing to bet is more likely to reverse higher over the next days or weeks, than following through lower. We should assume technical support and resistance levels will hold up more often than a break following through! The break can often be the best prices to buy and longs have capitulated and sold out in disgust, and fools decide to step up and short, right before getting crammed!
I haven’t posted much the last few days because there just hasn’t been much to share, on top of the fact I am in mode to manage my psychology as we continue to get hurt in our positions. Sometimes it takes all one has to stay focused on the mission, and now is one of those times as miners made new lows at the close of last week’s trading. Still, if we were to sell or trim anything it would be into strength, not weakness.
There are also a few glimmers of hope setting up. Despite all the tough-talk from the Federal Reserve, we realize we only have to get through this period and the rhetoric surrounding it, to get our next big move higher. To that end, the charts of the major mining etfs are now showing oversold technicals on both the daily and weekly charts. The end of the month is later this week, and with that we will get new data points on our long term charts, likely to show the miners with oversold stochastics on the monthly charts as well. I will show a few charts below, but let me say that if we were not already heavily long the miners, we would certainly be buying hand over fist right now, ahead of the earnings reports coming out in late October and early November. There is also interesting action occurring in the sector, such as Kirkland Lake trading higher most days and today up over 5% on rumors it is going to be taken over. we don’t own KL stock, but another big merger/takeover in the sector would certainly bring some interest in the group. In short, yes it hurts to be getting “schooled” at the moment, and no, we aren’t the least bit concerned that our trades eventually work out. We are aggressive, and have been in this situation many times, knowing that we must be invested IN ADVANCE of the move higher, and especially in a group like miners where the runs are super fast and steep. Recall our 2016 positioning, it seemed as if we waited forever and everybody had given up, then our stocks went on to gain 400-500% in just 6 months, making up all losses and piling on some huge gains. It’s a tough game, but we understand how it works, and now is definitely NOT the time to sell your metals and miners. It’s only a question of how much can you tolerate holding through the difficult periods that always accompany major bottoms?
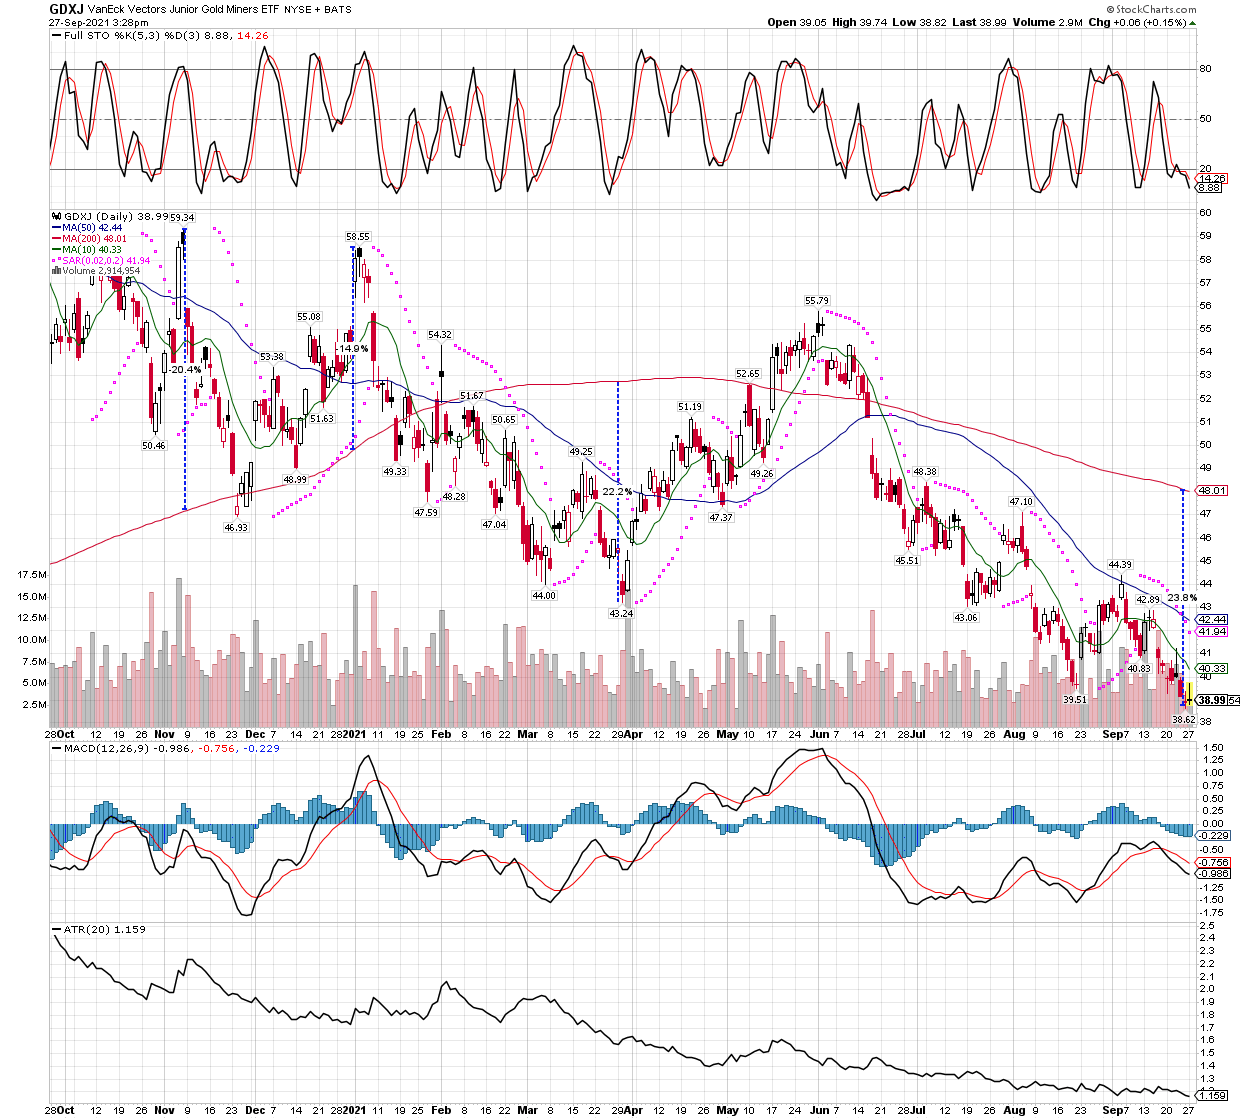
GDXJ with various PPO measures to the 200 MA on the daily chart, it looks like around 23% below the 200 day MA is getting stretched, and likely due for a “snapback” rally. Combined with the oversold stochastics, on both this daily chart and the weekly´s as well, it seems like an ideal time for traders to step in for a big rally.
James Flanagan over at Gann Global ( I am now a happy subscriber) showed a chart this weekend of the ratio between commodities versus gold which I found interesting, especially as he focused on the now famous pullback between 1974 and 1976, in the middle of an overall huge bull market for gold. The takeaway, if we are in a similar environment after a 14 month correction from all time highs in gold, is that while the other commodities have rocketed vs gold in this period now just like back in the 1970’s correction, the ratio also looks due to turn again in gold’s favor. If so, we might be on the verge of the biggest and best part of the bull, the near vertical run to top it all off. With the fact miners are trading at multi-decade lows versus the metals prices, you can see why we get excited at the prospects over the next 3-4 years. If something similar plays out, we should start heading higher soon, and gold should keep building momentum over the next year or so before it ignites into an all out frenzy and dash for real assets. Since most real assets are no longer a bargain, that leaves gold and especially silver. I wanted to show you the monthly chart going back twenty years, and how overbought the ratio is, but for some reason I am getting “network error” signals. I will get that fixed and be sure to post the chart, it might be an important indicator that warrants our attention, but know for now it is very, very overbought on the monthly, and even overbought on the weekly as well!
The team at Crescat Capital explains the last few months pullback in precious metals miners, and what they think they are really worth at today’s metals prices. I could not agree more, and they explain it better than me, so try the link below and see why many miners are worth 11x today’s prices!
I have a few comments and observations on yesterday’s action, and what I am looking for this morning. Since miners technicals closed in the mid-range, neither overbought or oversold, there shouldn’t be any trade signals for at least the first hour of trading. However, some interesting developments are starting to fall into place so lets get into it.
First, the mining sector was strong today for the first time in awhile, and was able to build on gains throughout the day, only pulling back a little about a half-hour before the close. Better, the miners were gaining ground mid-day when the stock market started to sell off. This is important because many are afraid to touch miners before a stock market decline they see as inevitable. It doesn’t necessarily have to play out that way, and action like today’s suggest miners might be the direct and immediate beneficiary of money leaving stocks. Another positive is that the mining sector was up while the metals themselves were flat or lower on the day. Lastly, I saw trades occurring that are not typical lately, like somebody taking 300 SILJ LEAP call options, the buy cost roughly $75K and all were at the offering price meaning the buyer was not willing to wait for a better price. Of note, this was not a day trade, as the volume only reached 320 or so contracts by the end of the day, the buyer held overnight.
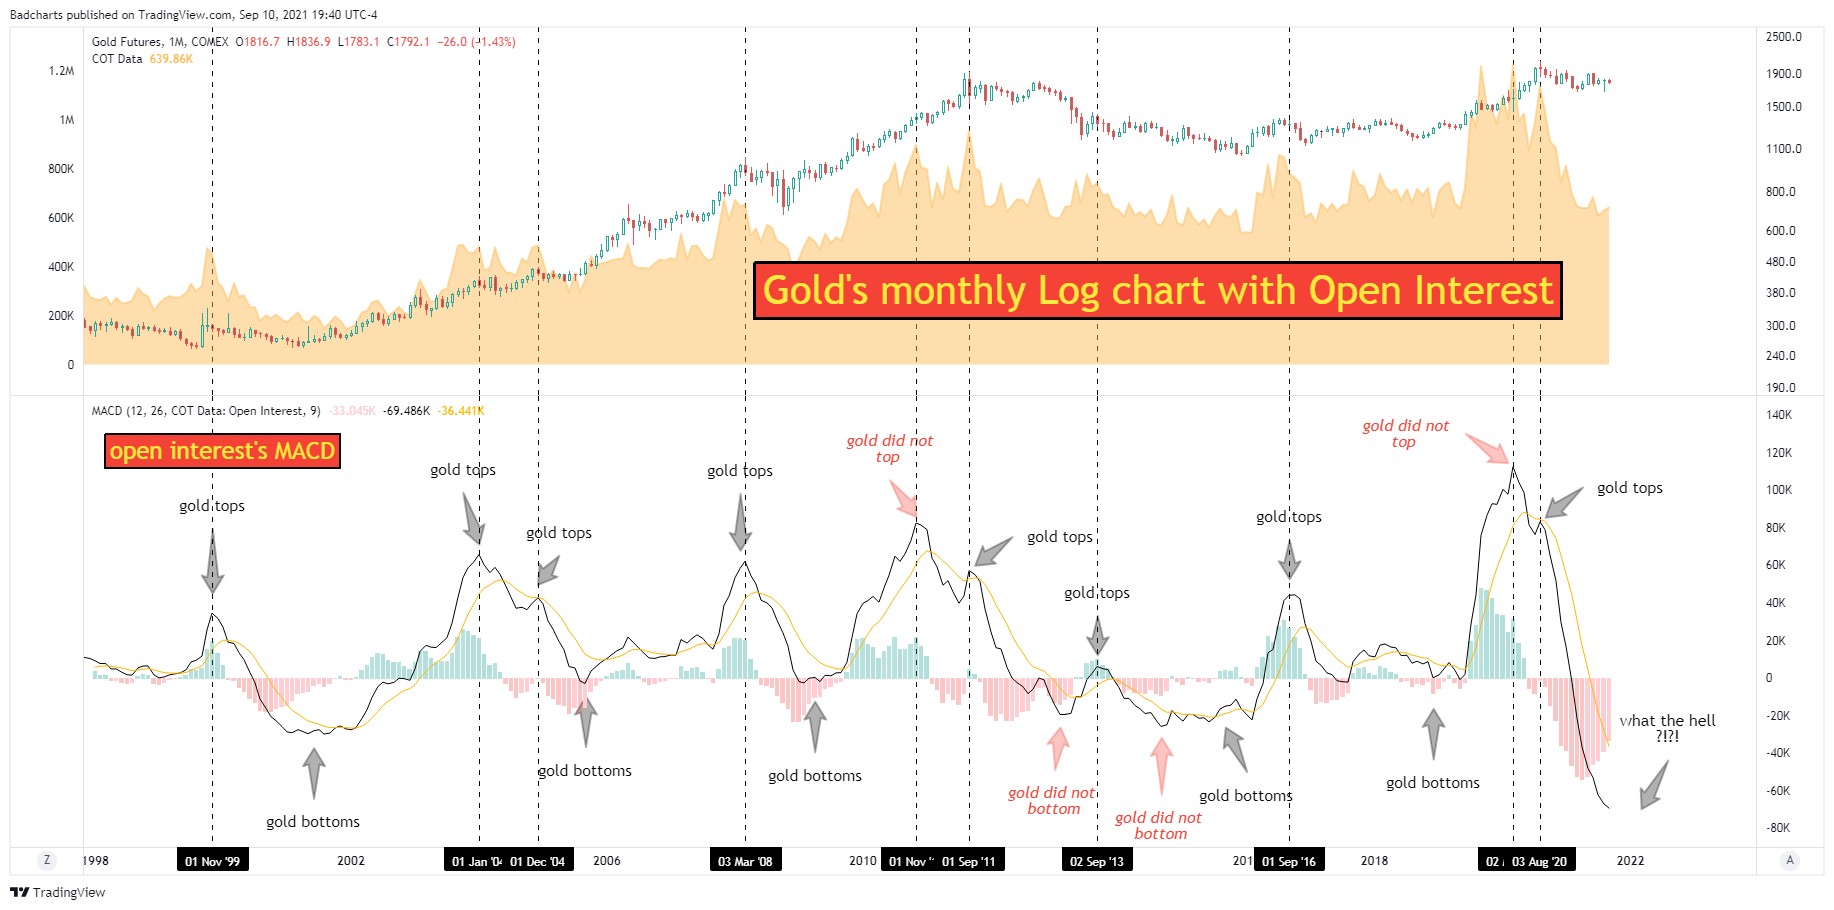
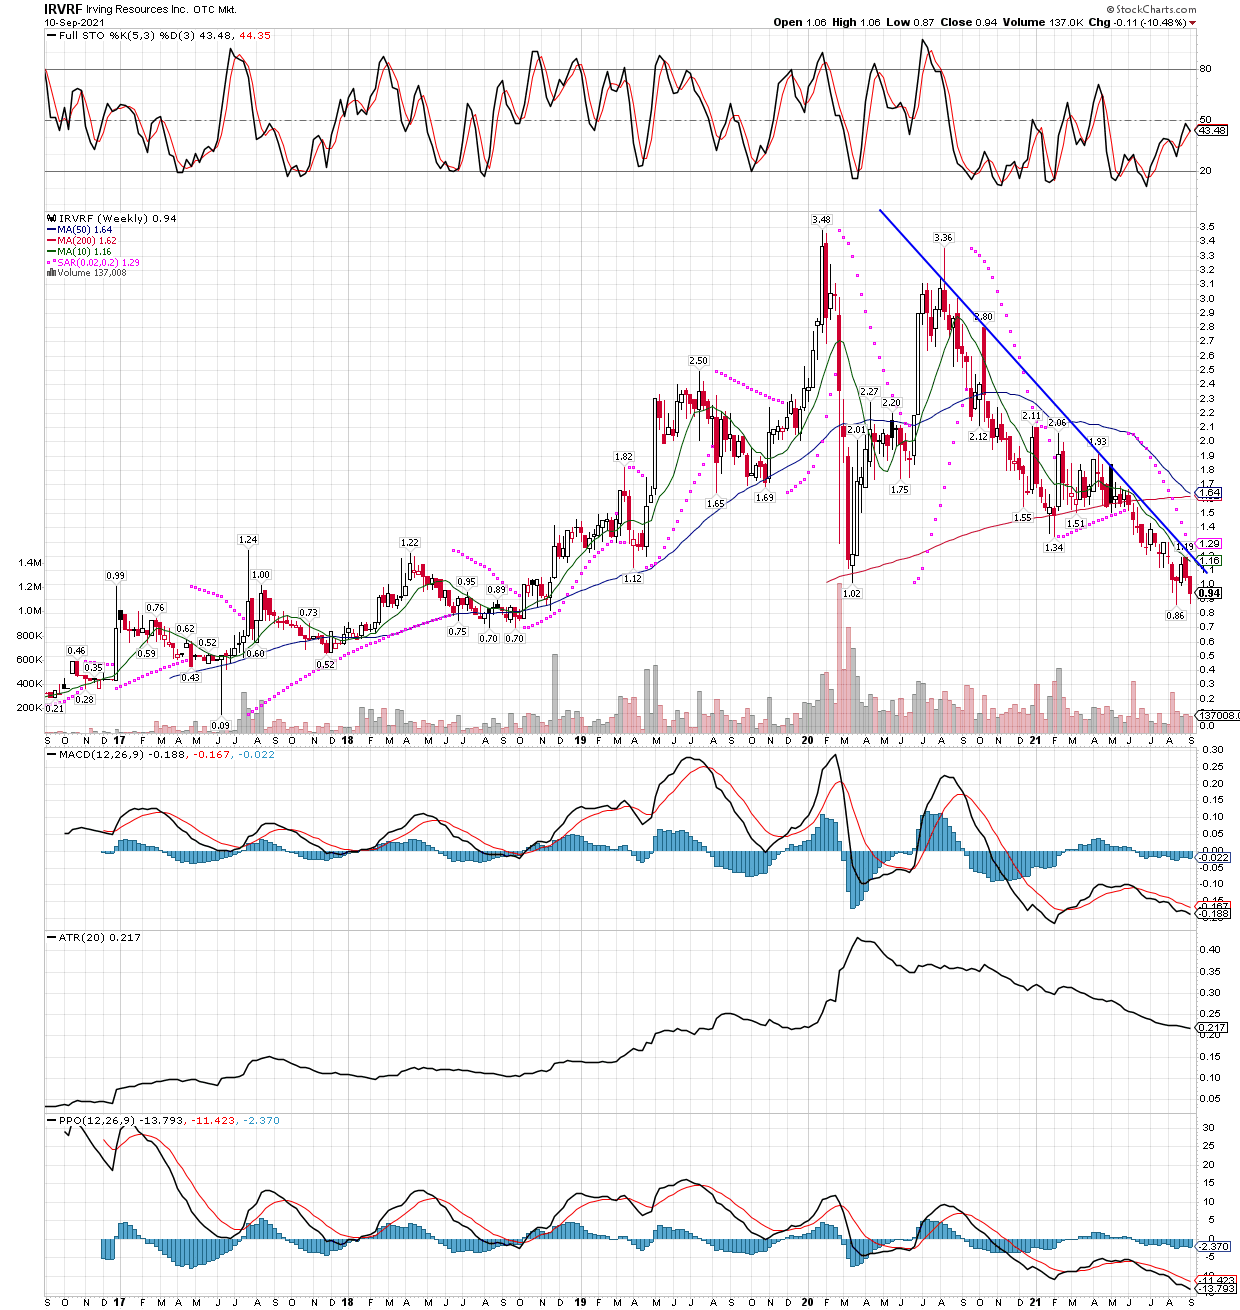
We weren’t super active as we are already loaded up and ready, but still saw a few opportunities to add to SILJ, IRVRF, and GDXJ and took advantage. GDXJ had a very good day, up over 4%, and the type of move we look for when making a turn that will stick. It was good to see all the miner etf and indexes we follow close above their 200 MA’s on their half-hour bar charts, a necessary prerequisite to initiate a new uptrend. Lets look at a few charts, one of mine, and also a couple from Patrick Karim, a silver and gold analyst with some interesting charts he posted on his Twitter channel that does some great work with the long term outlook in the sector.
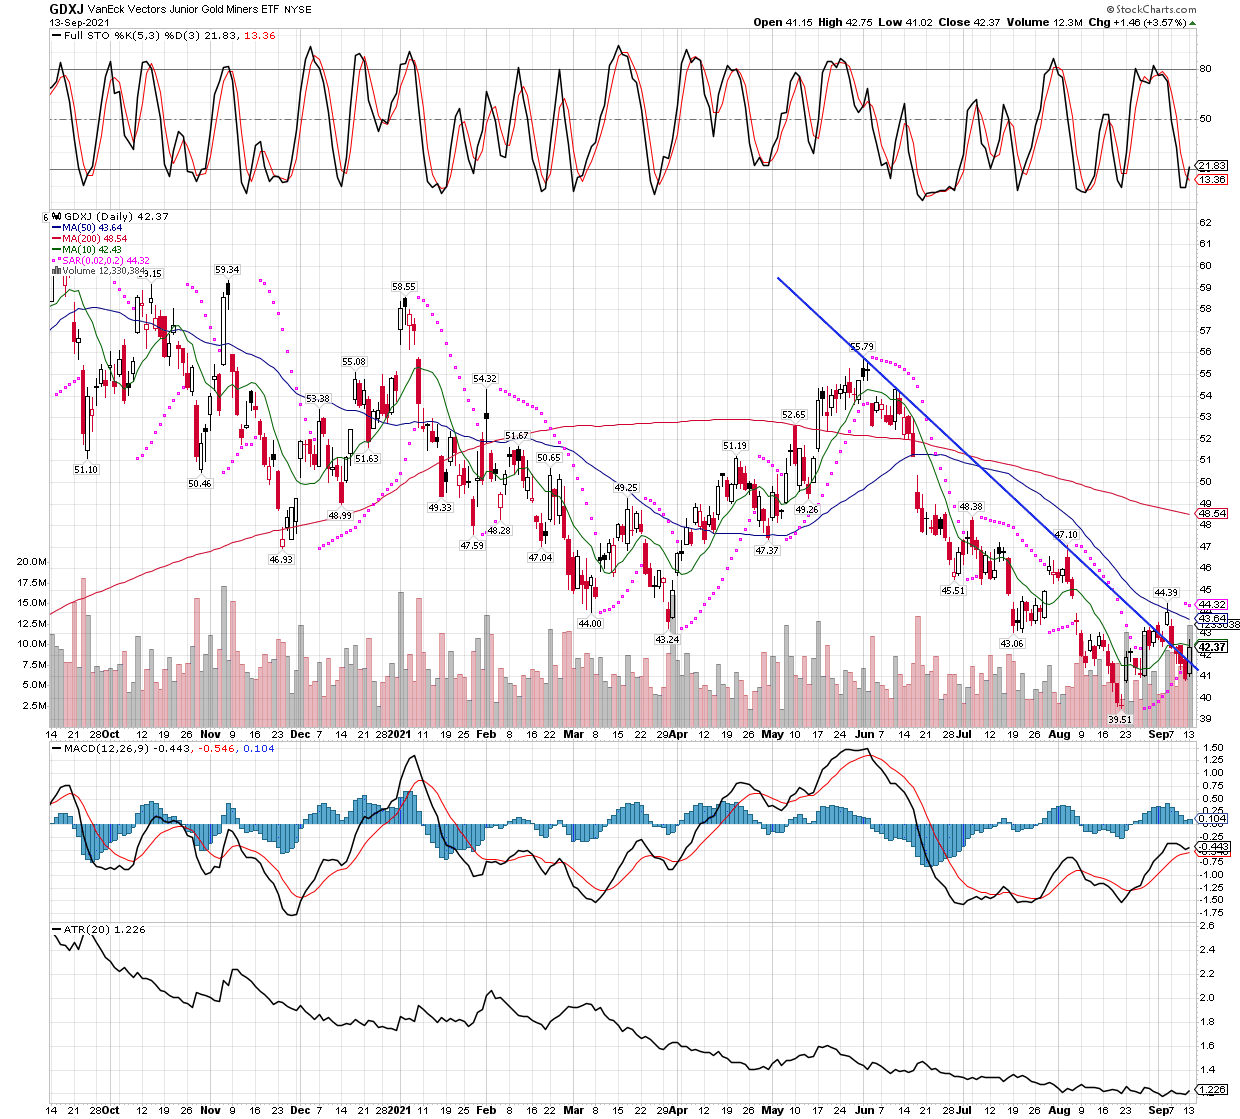
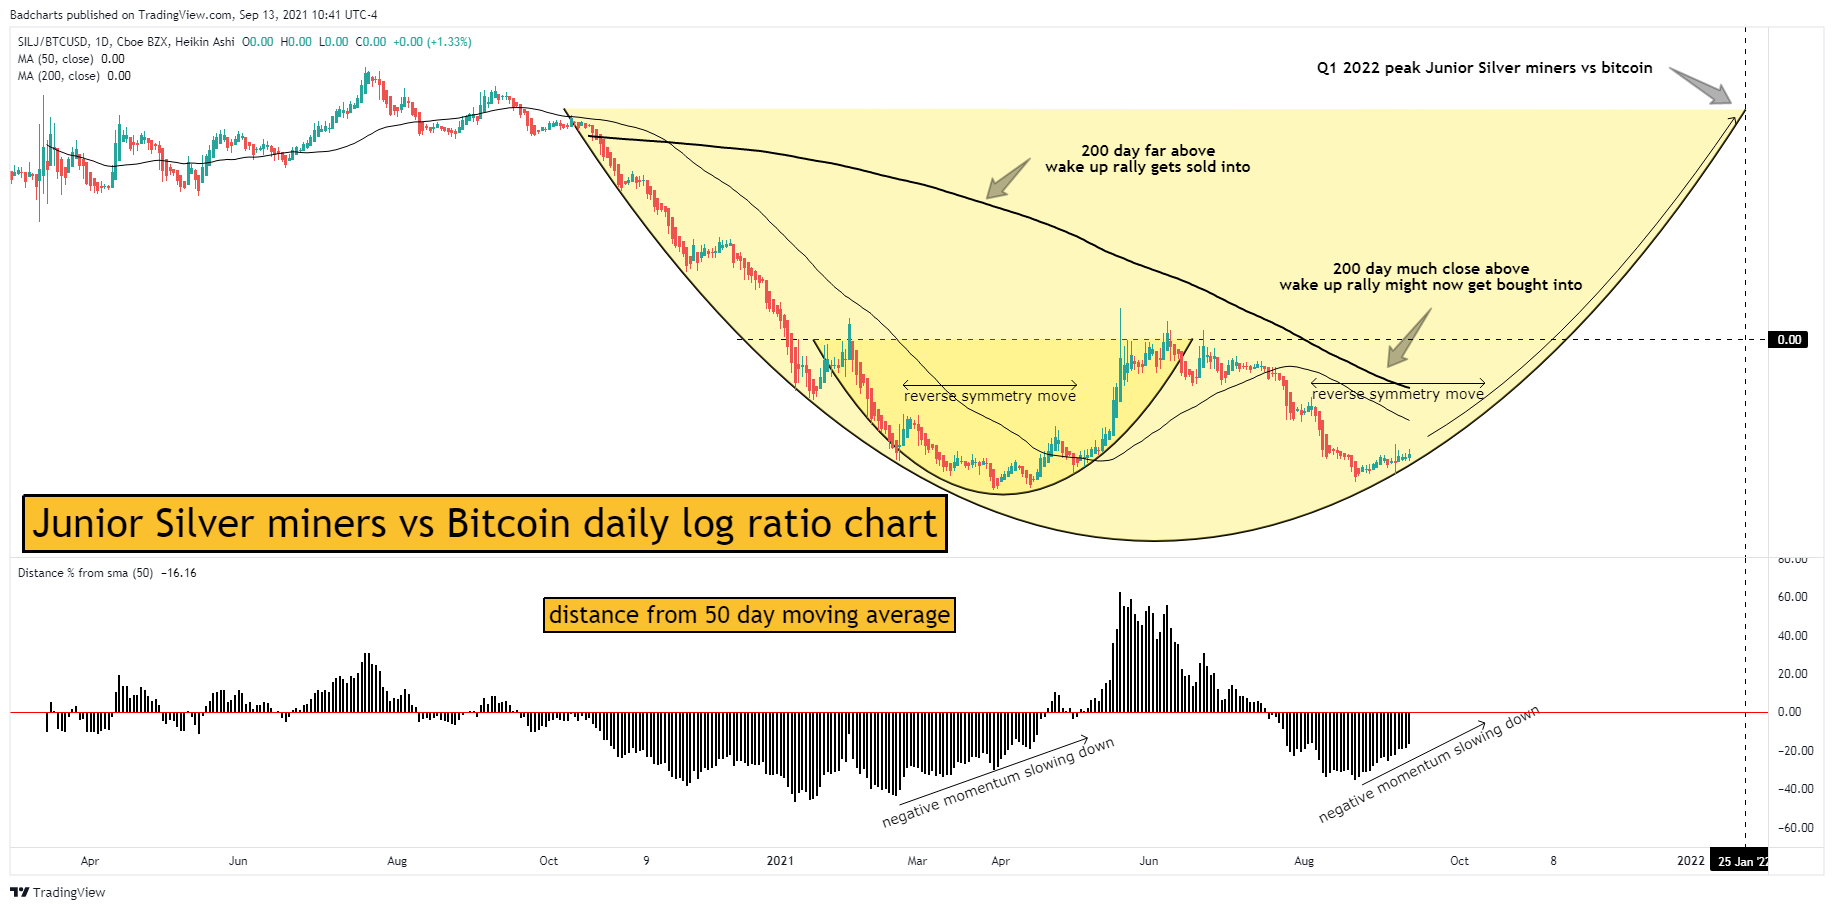
GDXJ daily chart, the downtrend line has been convincingly broken and with good volume justifying the move.Patrick Karim’s Junior Silver Miners vs. Bitcoin daily log ratio chart implies this run might follow through and get back over the 200 MA. Karim’s LONG TERM monthly log chart with open interest. Note how deep the MACD has dropped, this could be a huge move once it gets started, so I would not wait to get involved, the best prices are likely now, or just passed!
So things look good for tomorrow. We also should have time to watch things unfold in the morning before getting any buy signals in the mining sector. As far as other setups in things like the KWEB etf, we will examine them and mention if there is anything we might buy or add to in the morning, but for now our major focus remains on the precious metals sector and their miners in particular. Especially the etfs at this point as they are the safest play (SILJ, GDXJ, GDX, etc) until the group really gets moving higher.
Last week was another tough one, as miners resumed their downtrend. I didn’t write a post Friday because there wasn’t much to say, and I wasn’t too active in the markets as I wait for the run higher. However, I did get the chance to add to Irving Resources (IRVRF), and also GDXJ LEAP call options expiring in Jan. 2023. As I type, gold and silver futures have opened Sunday evening electronic trade essentially unchanged.
About the only positives I see right now are that miner etfs are almost oversold on the weekly charts again, and are fully oversold on the daily charts. Sentiment is also rock.bottom, nobody and I mean nobody wants anything to do withy precious metals miners, which is strange being many are currently valued withy PE’s (price to earnings ratios) in the 9 to 11 range, while sporting earnings growth rates of 20%. Adam Hamilton, who posts on Bob Moriarty’s site 321gold.com http://www.321gold.com/editorials/hamilton/hamilton091021.html remains one of the very few bulls and even he is only a recent one!
On the negative side, we are getting due for a Daily Cycle Low (DCL) in gold, and that could imply another week of sideways to lower prices. I am still looking to add into this decline to stocks like IRVRF, MUX, and maybe the miner etfs as well like GDXJ and SILJ, but this trade is testing my fortitude, no doubt. I wll keep it short and leave you with a couple charts, lets see what the new week brings.
GDXJ the junior miner etf is well oversold on the daily chart, a 6-10 day bounce should start soonIRVRF- Irving Resources is a recent addition again, and big winner in the past when we sold in 2020. Some downtrend!