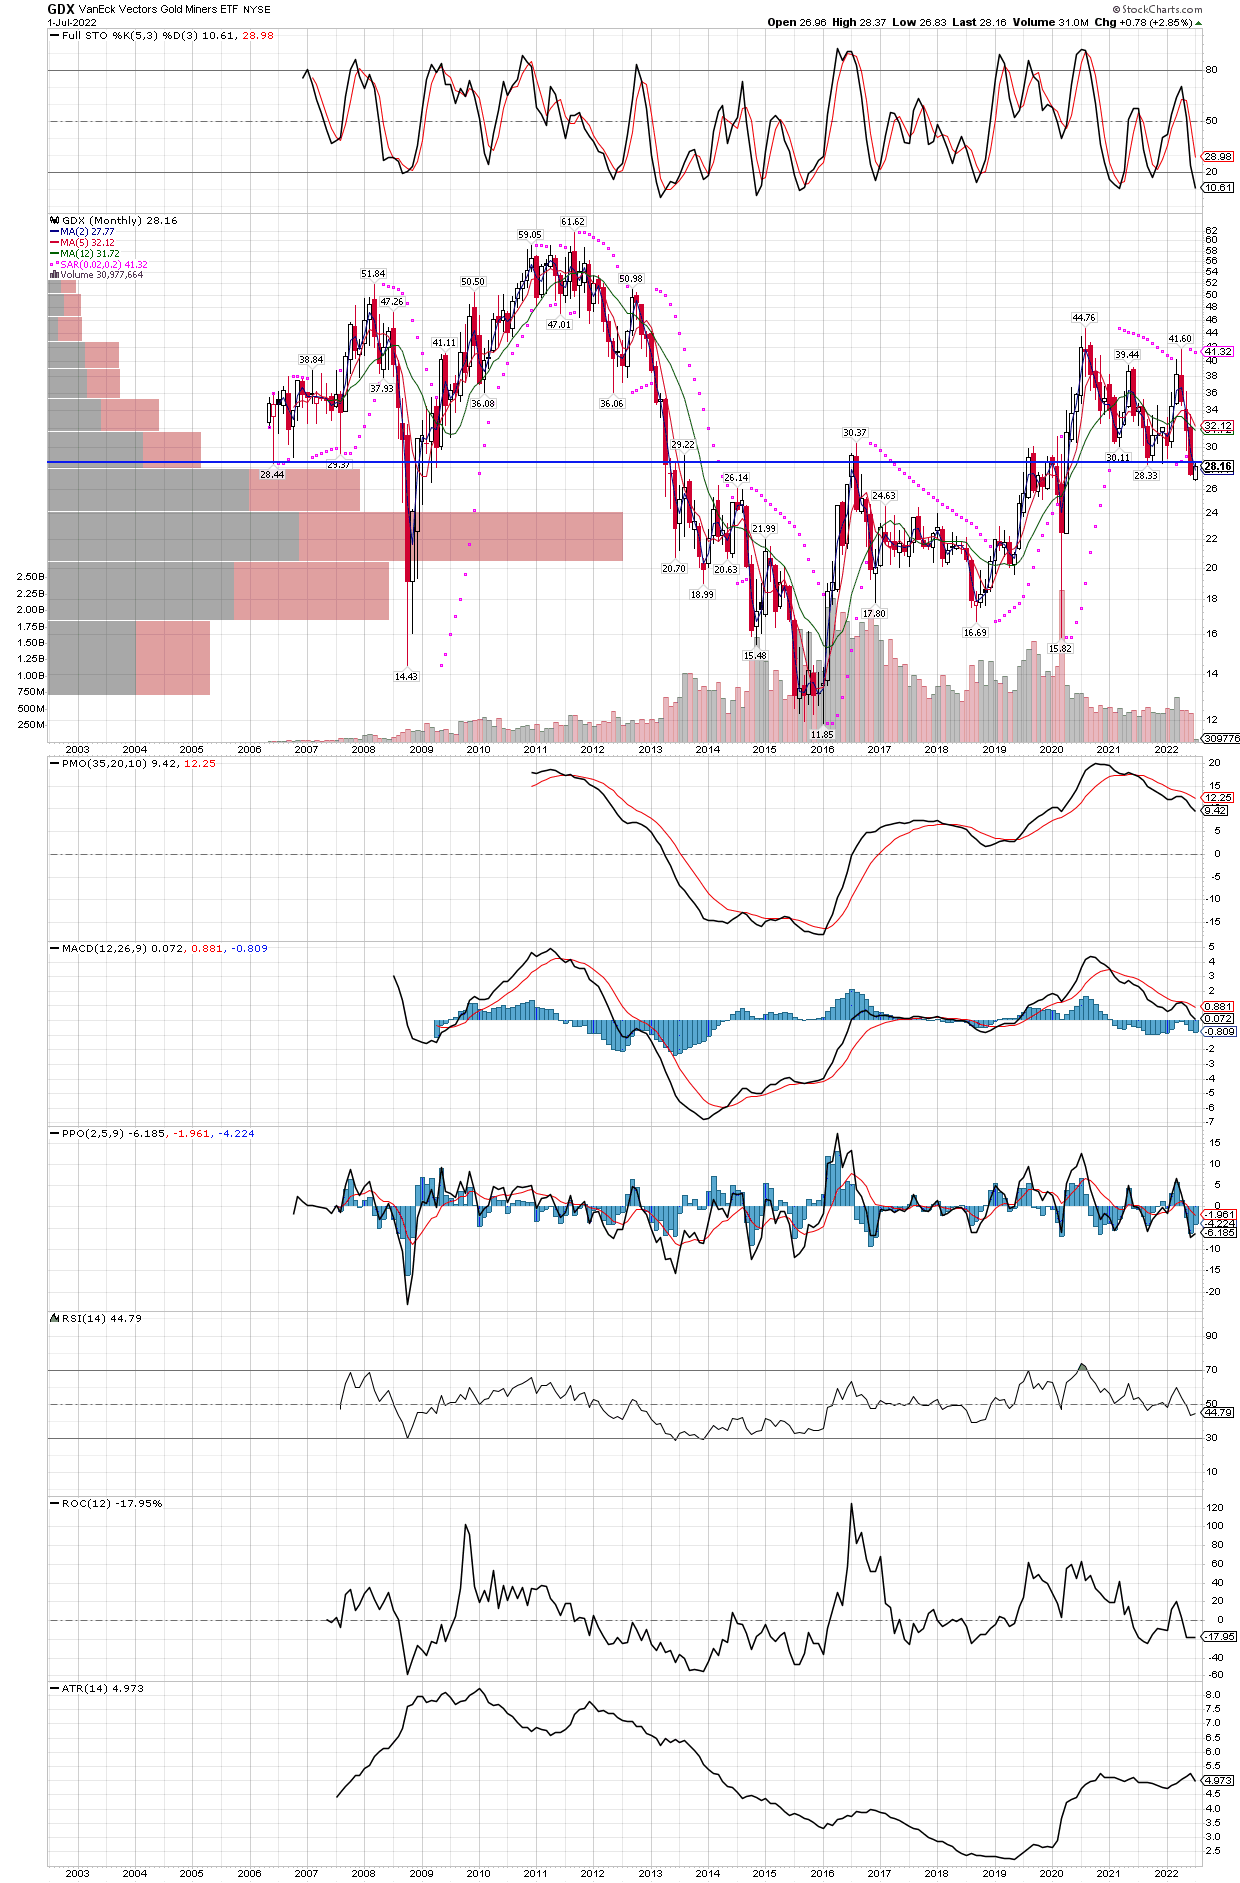
I drew a horizontal trend line where GDX could find support, and if it does soon, the recent decline below the trend line would become a classic “false breakdown”. Professionals know that more often than not, support and resistance will hold, so they use these apparent breakdowns and their accompanying higher liquidity to acquire large positions into the panic. The stochastics could go a little lower to be an ideal buy signal, but does not have to being the last rally out of oversold has not yet reached an overbought level, which last occurred in August 2020. The last oversold reading was in early 2021, so the GDX is due for a voyage north, and our bet is that one needs to be in them now, before the move occurs since miners can jump 10% plus in day when they start higher. Waiting just two or three days in that type of turn will really dampen returns if one understands compounding and its effects on a portfolio.
GDX monthly chart, once the PPO prints a positive bar, GDX should be off to the races. Also note this entire correction since the GDX topped out in August 2020, the MACD’s similar correction took place entirely in positive territory, often confirmation of positive underlying fundamentals in the face of a pullback. It could take up to a couple more months to re-ignite the bull, but I would not bet on it, instead we want to be invested ahed of the move.
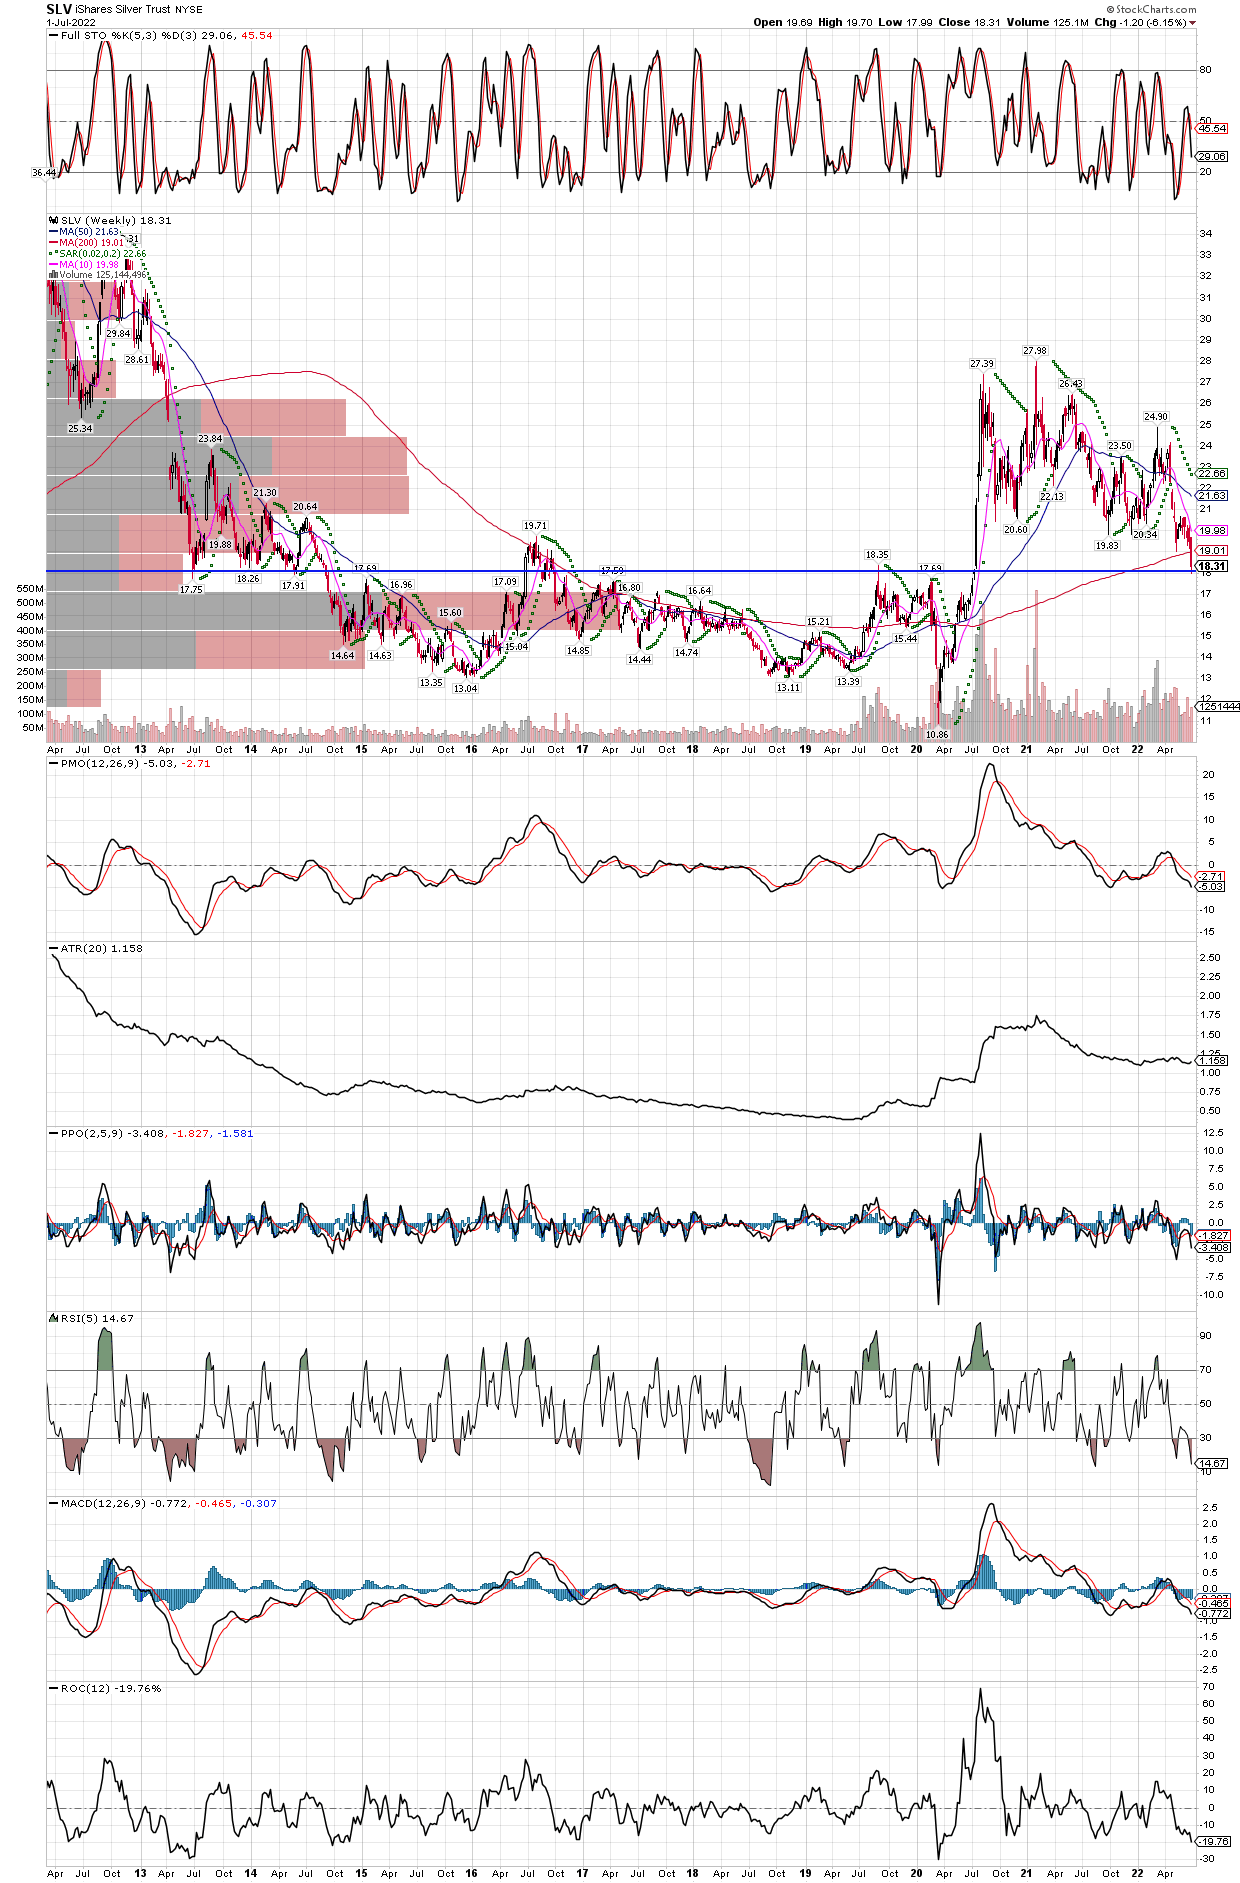
SLV is not only in an area which should be solid support going way back to 2013, with this decline it has managed to close a small gap created just before the big run in 2020, that started with that breakout in July 2020. It also sports oversold stochastics on the monthly chart, with the PPO indicator starting to contract again. Once the PPO shows a positive bar, silver could be off to the races, considering where it is starting from.
Just think how much has changed since 2013, new uses for silver exploding demand such as solar panels and other green energy project, a sharp increase in the money supply, rapidly rising inflation with a collapse in the bond markets, huge asset bubbles everywhere including all commodities, except silver. That’s right, every commonly traded commodity futures have rocketed higher, taking out their 1980’s inflation-riddled highs, except silver which is still 61% below its all time highs achieved in 1980 and 2011! On that note, we added to our positions late last week, including SILX (2x leveraged etf), FSM, and a few others. Already it is difficult to buy physical silver without paying extraordinary premiums, for example American Silver Eagles are selling at a 50% premium to the spot price of the metal. Once it gets started higher, silver is almost impossible to buy as the move happens quickly. We want to be where the puck is going, not chase where it has already been!
SLV weekly chart going back 10 years, with horizontal trend line. Our bet is the break of the 200 week MA will turn out to be a false breakdown, maybe ushering in a rocket-ride higher.SLV monthly chart with oversold stochastics, suggesting a turn higher should not be far off.
Added to HL today, while prices remain low. Regarding miners, the low of the year historically is June 13, on average, and I have found that buying a week or so before the July 4th holiday is a good time to take a position. On top of that, James Flanigan has a new promotional video out on his site at Gann Global which is very interesting, as it suggests the miners are either completing a 60 year or 90 year cycle, and ready to make huge gains over the next 4-6 years, on the order of 600% or 700%. I have to give him credit for his last try a couple of years ago, where his charts suggested the miners might be starting this move up, but when it failed he exited quickly and has remained on the sidelines of the metals markets, until now. He mentioned back then that the next time this move might start would be June of 2022, or August of 2023, and has now fine-tuned the call to say between now and the end of the year. The video is well worth watching, and I have subscribed to his service, while I am not affiliated or compensated in any way for mentioning him or the service. I recommend watching it, it will give the investor an idea of what to expect from a multi-year move in this volatile group, the gains can be spectacular! Here is the link, you might have to leave an email address to access it. http://www.gannglobal.com/webinar/2021/08/22-06-23-Webinar-Invitation-MF-321-Promote-2.php
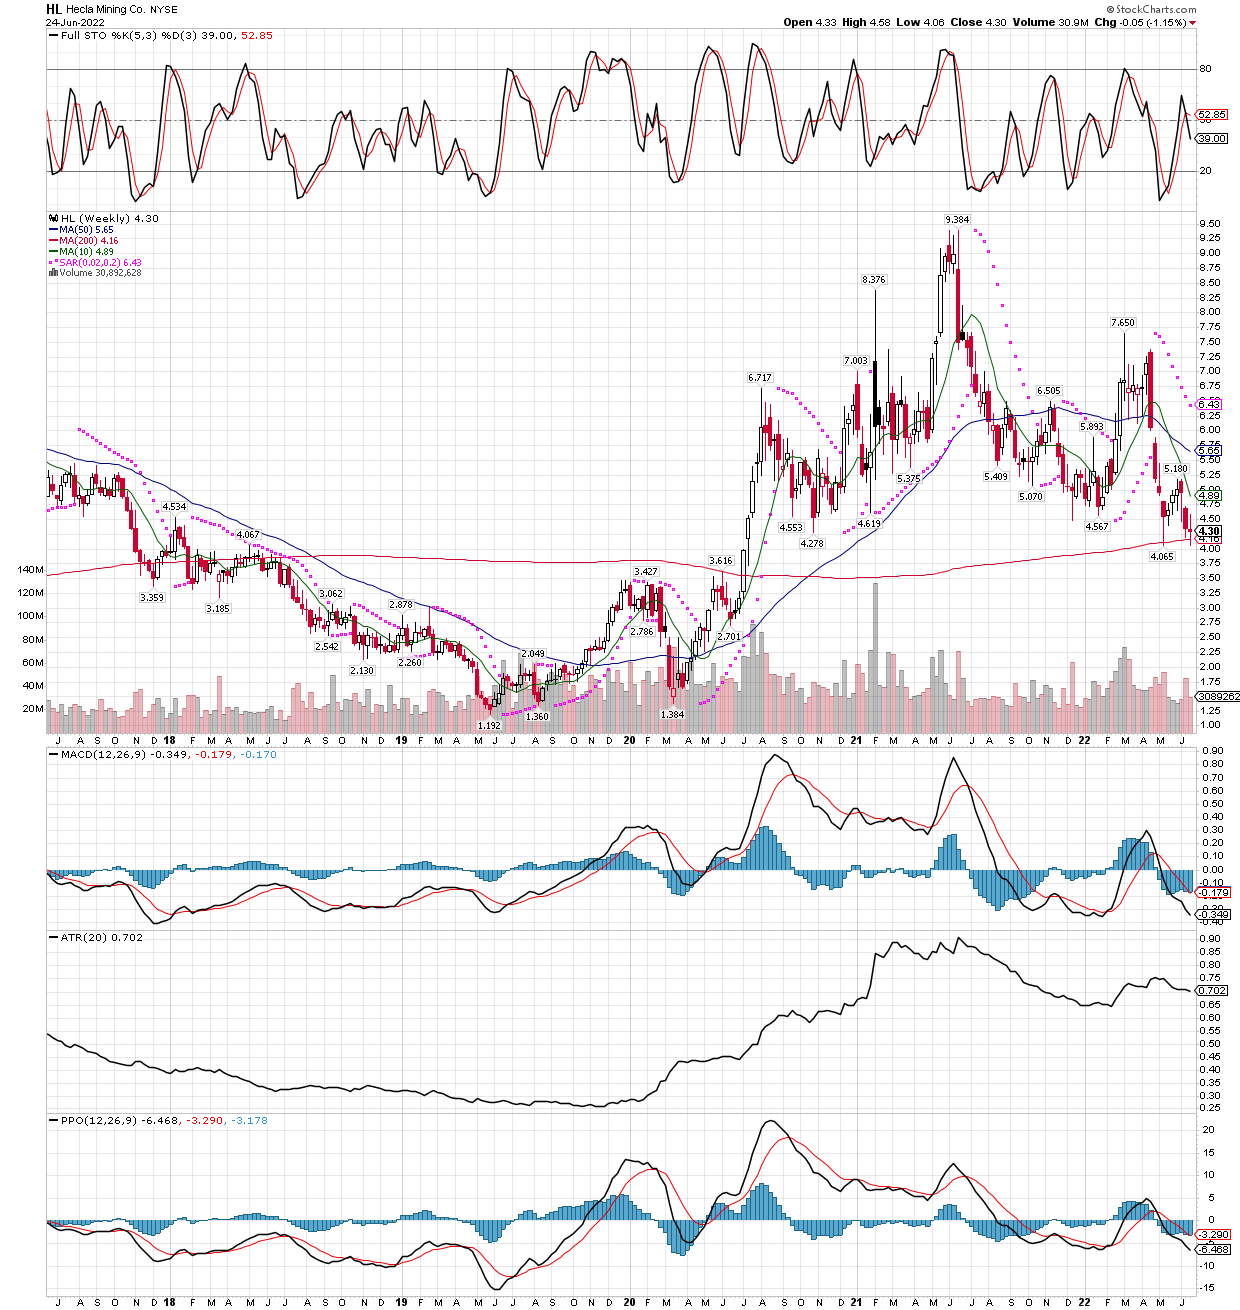
Hecla Mining, this chart only goes back 5 years, but the stock is at the same level it was in 2013, so we added!
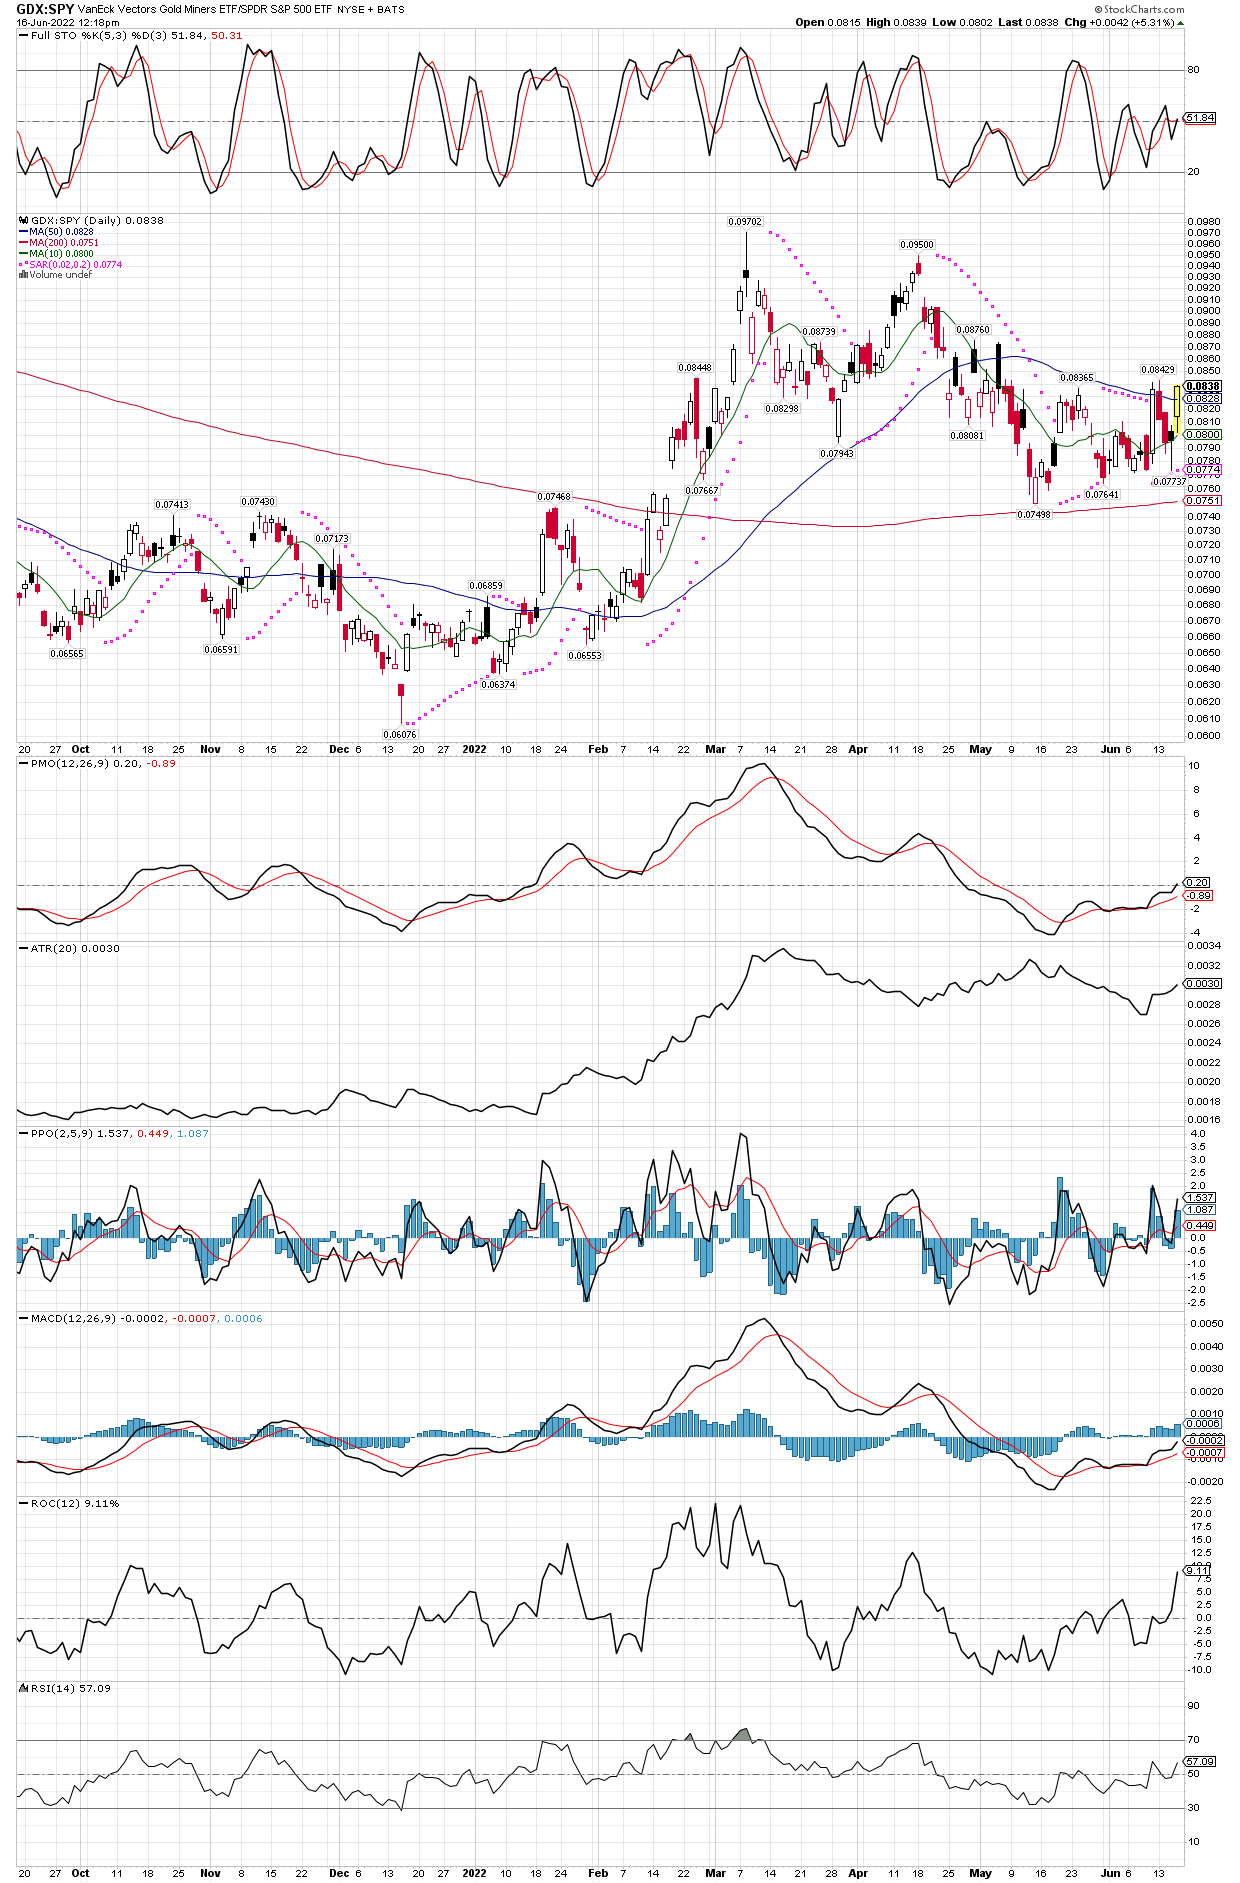
Finally we are seeing the precious metals and their miners decoupling from the stock markets. As I type (11:20 am on Thursday, June 16, 2022), the GDX is up 2% while the QQQ and SPY etfs are down 4% and 3.4% respectively. Even better, the miners were lower on the day along with the stock market, on low volume, but then large buy orders drove the GDX into positive territory. What we want now is to see this behavior continue, so that market participants can easily see the best and only group, while they continue to lose in everything else, including momentum stocks like technology, bonds, even other commodity stocks such as oil and copper are getting hammered.
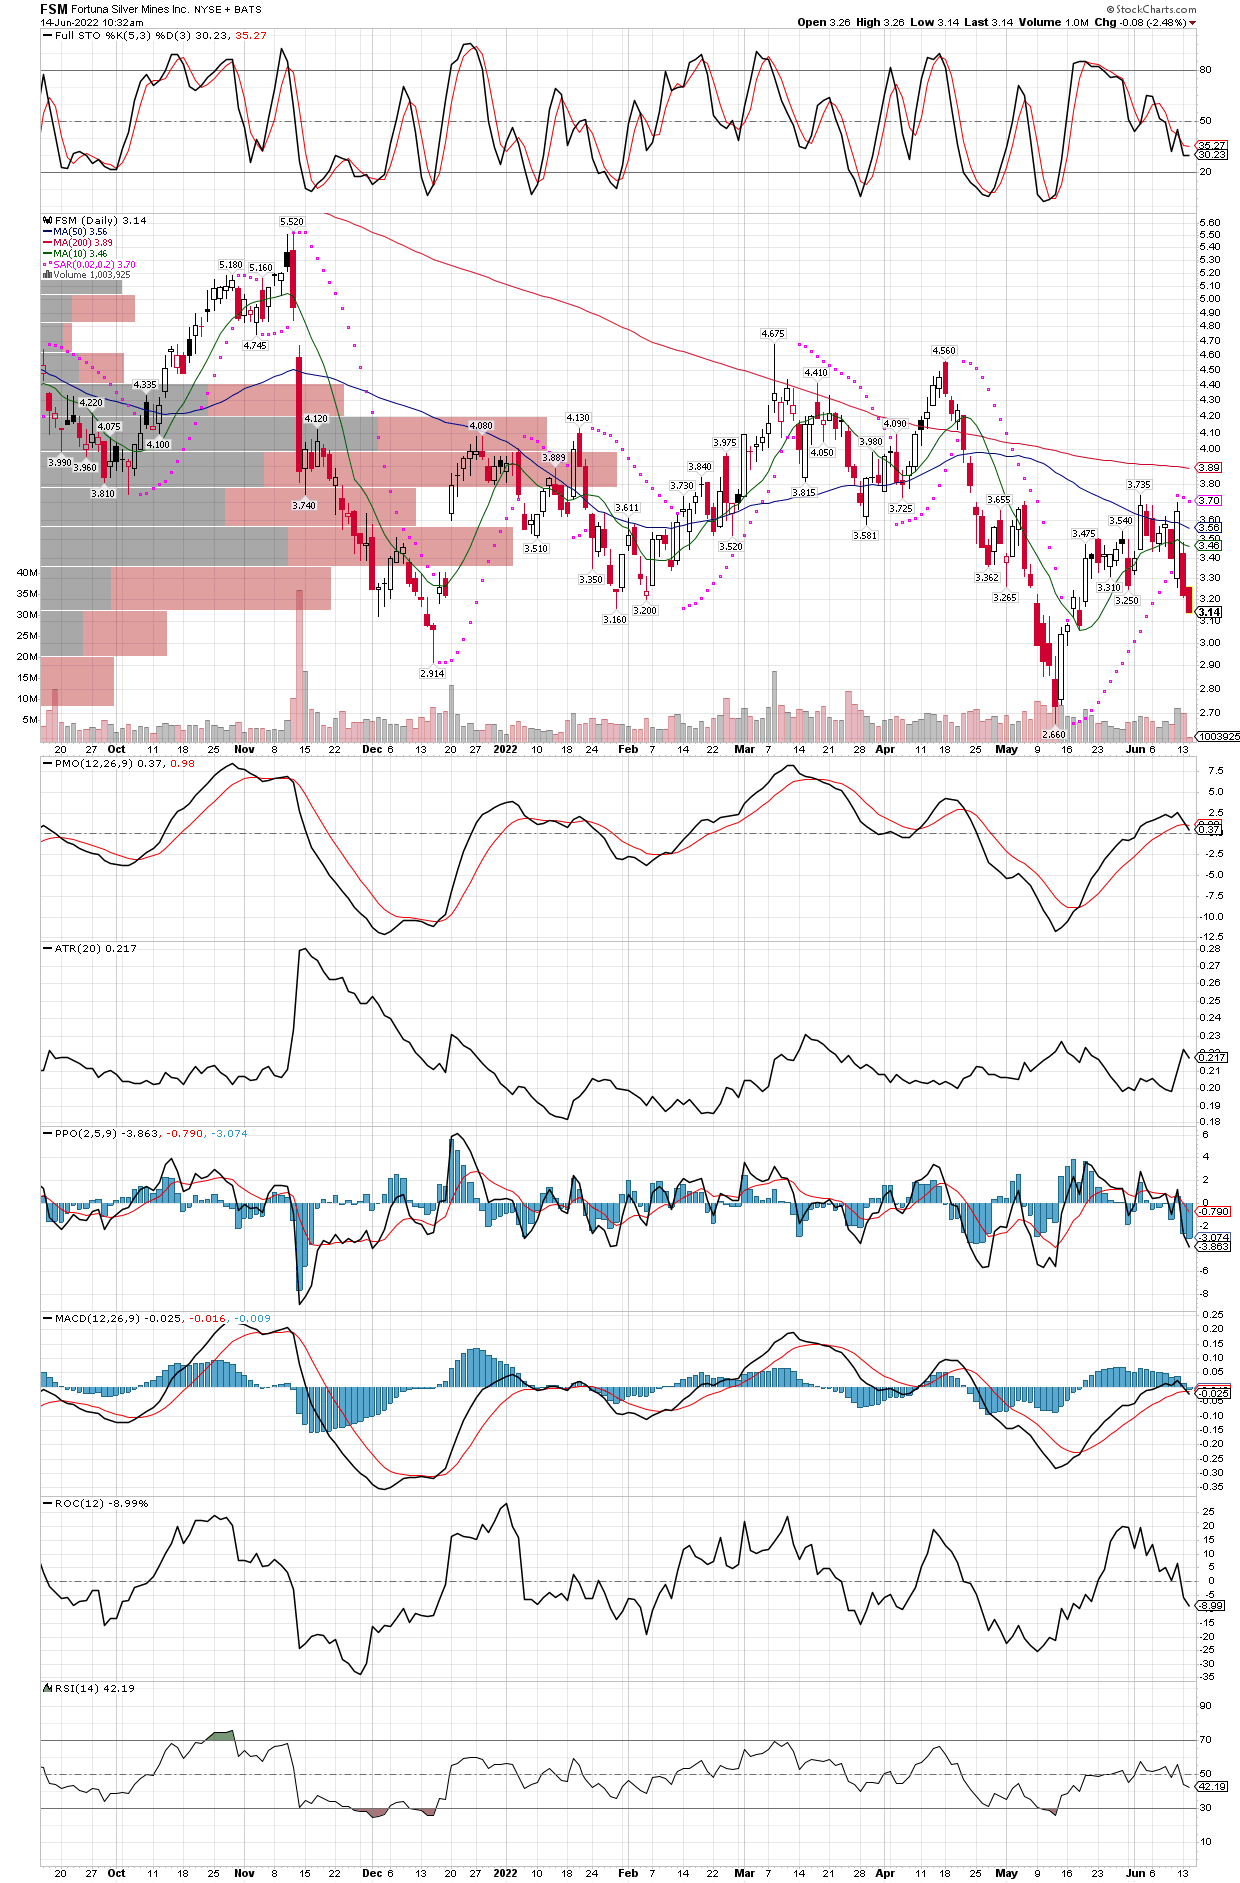
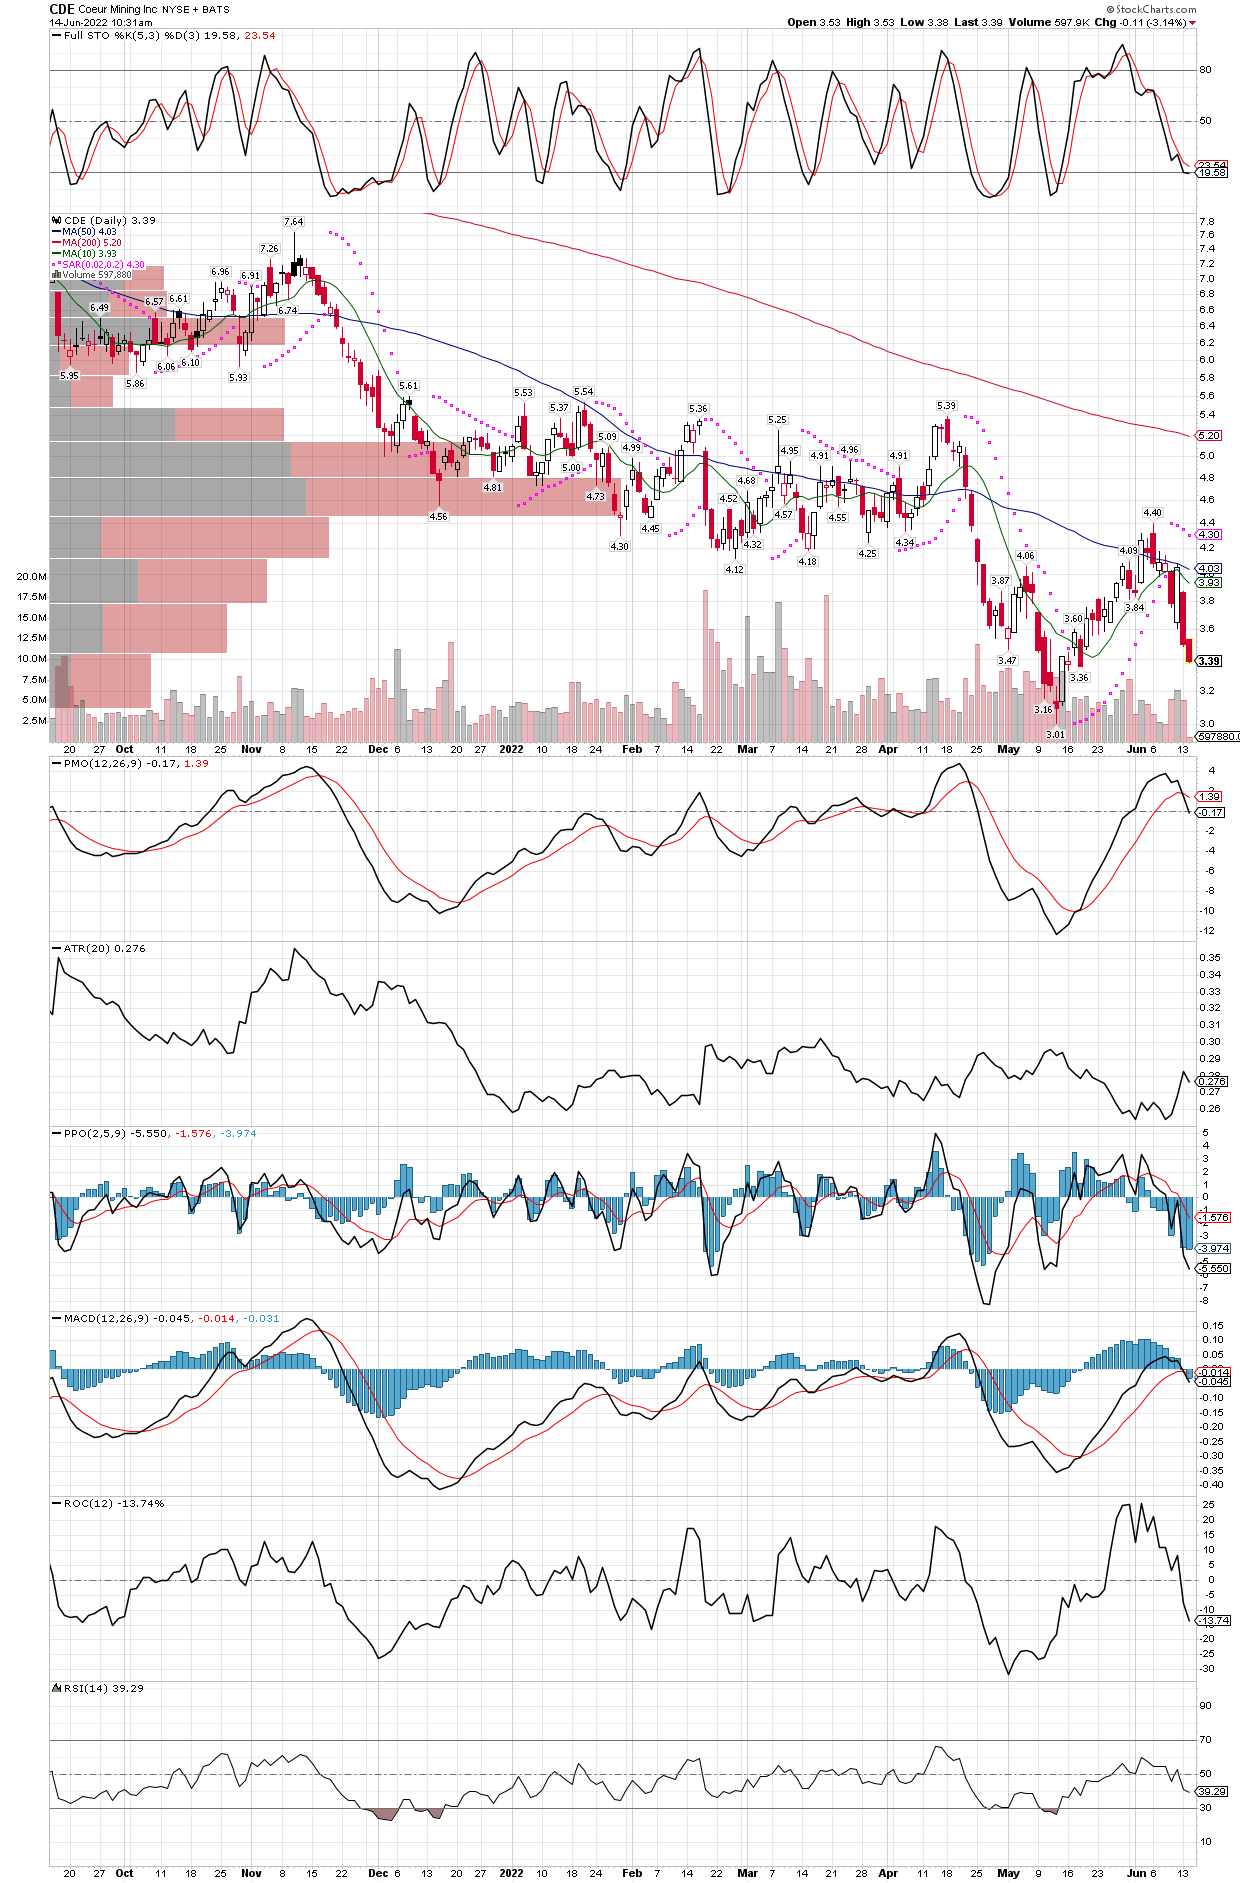
I added more to FSM and CDE this morning while they were red on the day, and am looking to invest more of the proceeds from the sale of junior explorers the other day. Below is the daily chart for GDX vs. SPY, not only having a nice jump, but also working back up over its 50 day moving average, which is also about to turn higher. With all moving averages sloping higher, this could start a new trend in the ratio, and investors would expect the miners to outperform the stock market for awhile in that case.
The GDX vs. SPY ratio jumped back over its 50 day moving average this morning.
This afternoon, the FOMC raised rates by .75%, the largest hike in 28 years. Just a week ago, market participants were factoring in a half-point hike, which might explain the bashing miners metals and miners have experienced recently. Now that we are exactly three months into this hiking cycle, we should start to hear calls for a pause, or even a reversal to lower rates, both of which should start the metals bull running again. We are already getting headlines of weakness in the economy, in fact I think without the higher prices from inflation, the business conditions wouldn’t look nearly as good as they do now. It’s hard to tell if the decoupling of the stock market from the miners will stick, but we have recently been seeing this occur more often. Once the market catches on that there is no other place to hide, even bonds have tuned lower after a 40 year bull market, we will see the metals and miners ignite to the upside. Until then, we have to be patient.
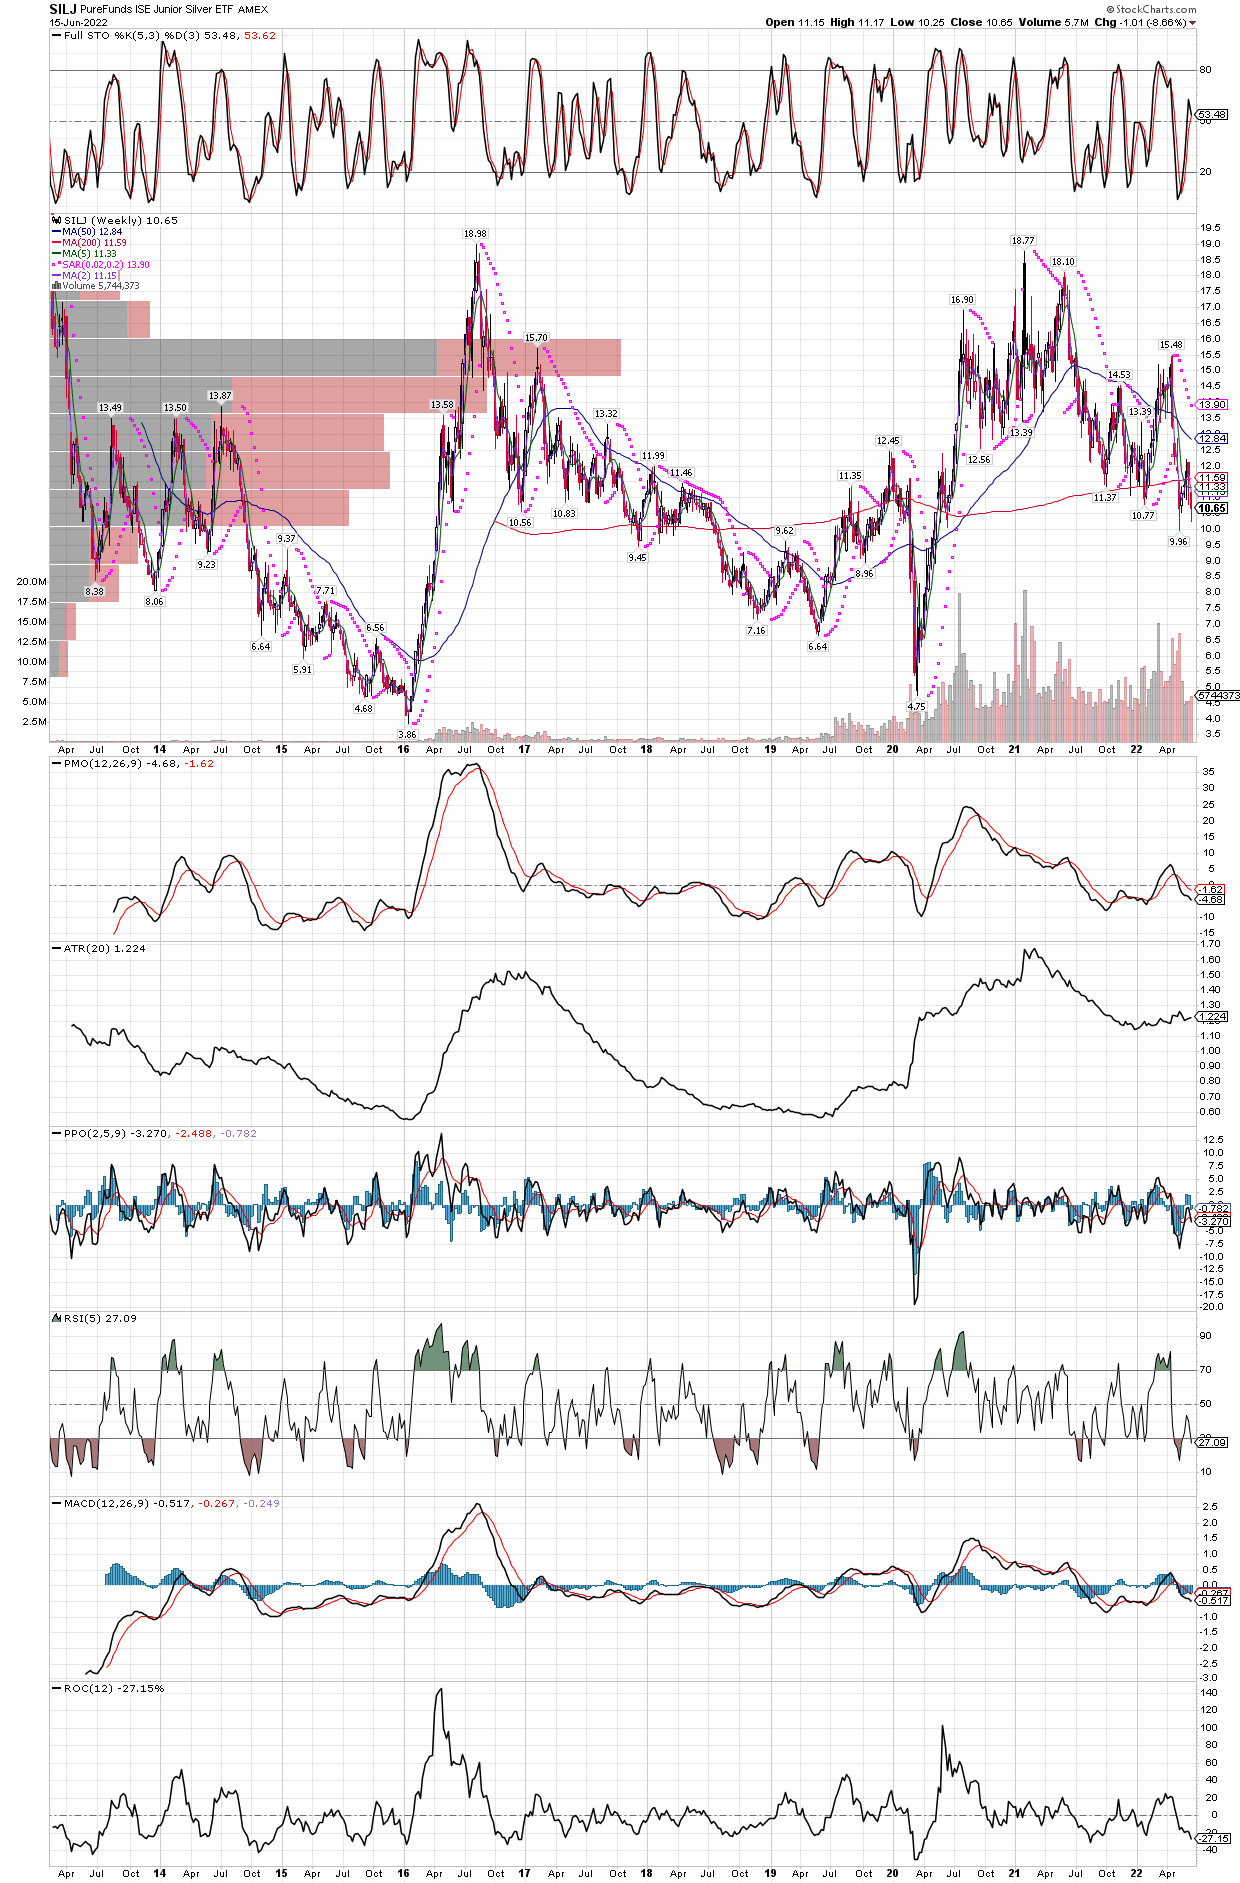
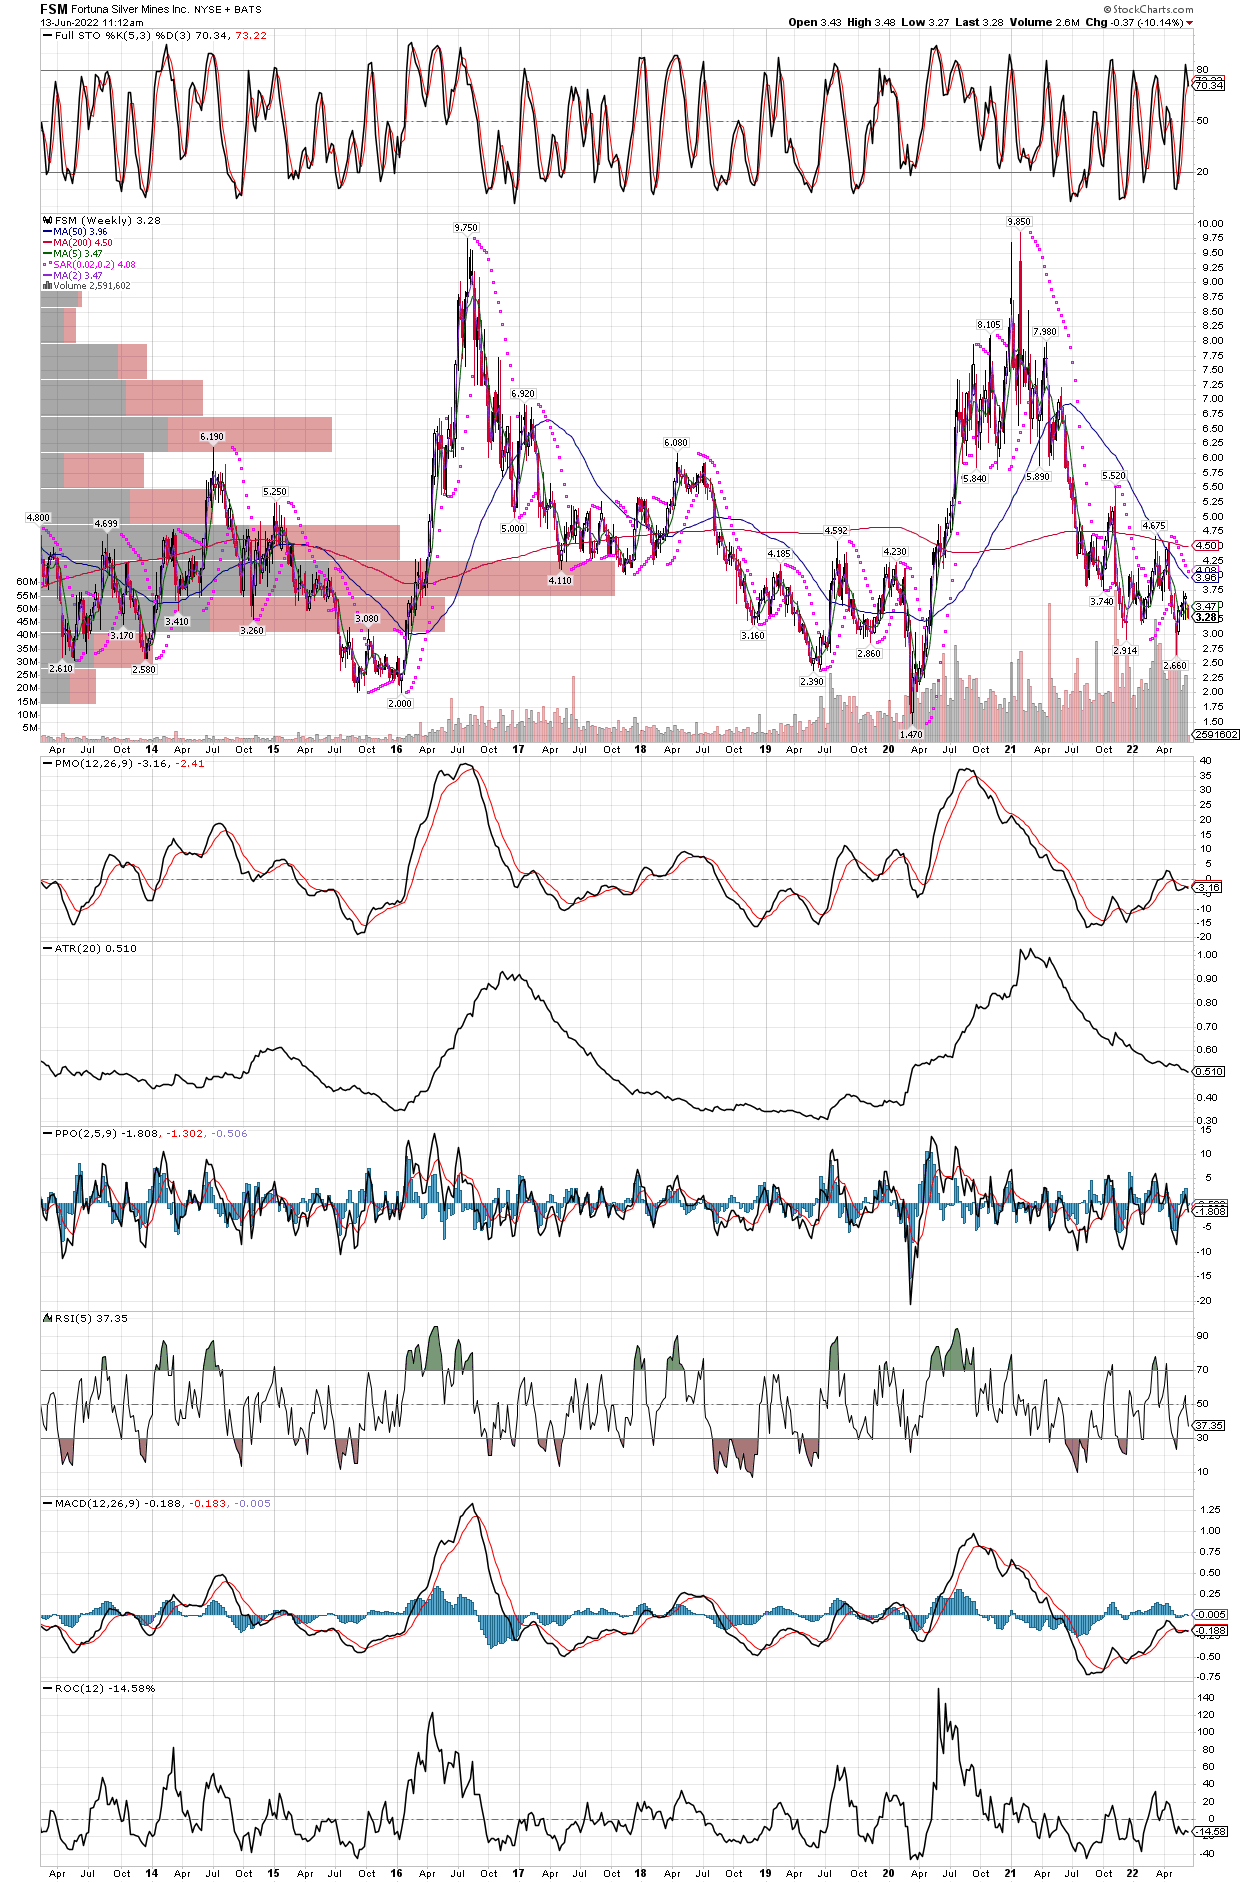
I took advantage of an afternoon pullback to add to FSM, while continuing to sell out of some more junior explorers for the time being. I will try to gauge when their time to fly comes around again, but with liquidity shrinking and things getting clobbered across many asset groups, I prefer to use the proceeds to acquire more mid-cap producers. With that in mind, I sold some more MGMLF and STKXF, fully cashing out of the latter. I have order in to add to the names mentioned over the last few days, and for those that aren’t comfortable with the risk involved holding individual miners, the etfs GDXJ and SILJ are always great options. I will continue adding to both.
Weekly chart of GDXJ, the 200 week moving average continues to climbSILJ shows a similar situation with the 200 week MA, heading higher with the etf price not far away, it could see support somewhere in this area.
We have near full positions in CDE now, and continue to add to FSM into this decline. Will continue add here and there. We also sold some of our more risky positions as we appear to be stuck in a liquidity-driven decline, since metals and miners are getting pulled lower along with stocks, cryptos, bonds, just about everything. We are moving more to the mid-cap producers for future positions.
We sold all or partial positions in MGMLF, OCGSF, MXROF, IRVRF, STKXF, and BKRRF. Nothing changed in these explorers individual fundamentals, but we want to be holding miners already operating and producing metal. If the liquidity continues to dry up in the markets, these explorers will have to issue stock (diluting existing shareholders), which could cap the upside at this point in the cycle. We still have shares in most of the explorers, and will consider buying them back once the group starts higher again, and after we see many juniors get secondary offerings out of the way. As Rick Rule continually says, just owning the best names in a group will capture most of the upside potential if one is correct and miners are in bull mode, with much less risk, as they are already cash flow positive, something the explorers can’t use to fund their projects.
One other important consideration regarding the junior explorers, we have seen buyouts and takeovers in the group lately that have not been at substantial, or even acceptable premiums. One example, yesterday GSV, Gold Standard Ventures was taken over by Orla Mining (one of our holdings), at only a 35% premium, no doubt disappointing for GSV shareholders. So, we see potentially more risk in the junior explorers, along with limited upside if an investor is lucky enough to receive a buyout offer, and this is why we made the decision to weight more heavily in the mid-cap producers.
Fortuna Silver Mines, started our position the other day, will continue to look to add.Coeur Mining, we are now holding a full position in this stock.
Markets across the board are getting hammered today, including the general stock market, miners, and even cryptos, so we took advantage about started to nibble on FSM (Fortuna Silver Mines) at $3.34 per share. Just a reminder that the FOMC has their Wednesday announced coming up on interest rates, so I won’t likely get heavy into this miner until after the news.
On today’s decline I took the opportunity to add to CDE, EQX, and ORLA, as. the group is down 4 of the last 5 days, after that huge one-day run last week. Here is a daily chart of the GDXJ to give you an idea of what the group is doing.
GDXJ has retraced 50% of the rally off the lows, so in here is a good area to start higher again.
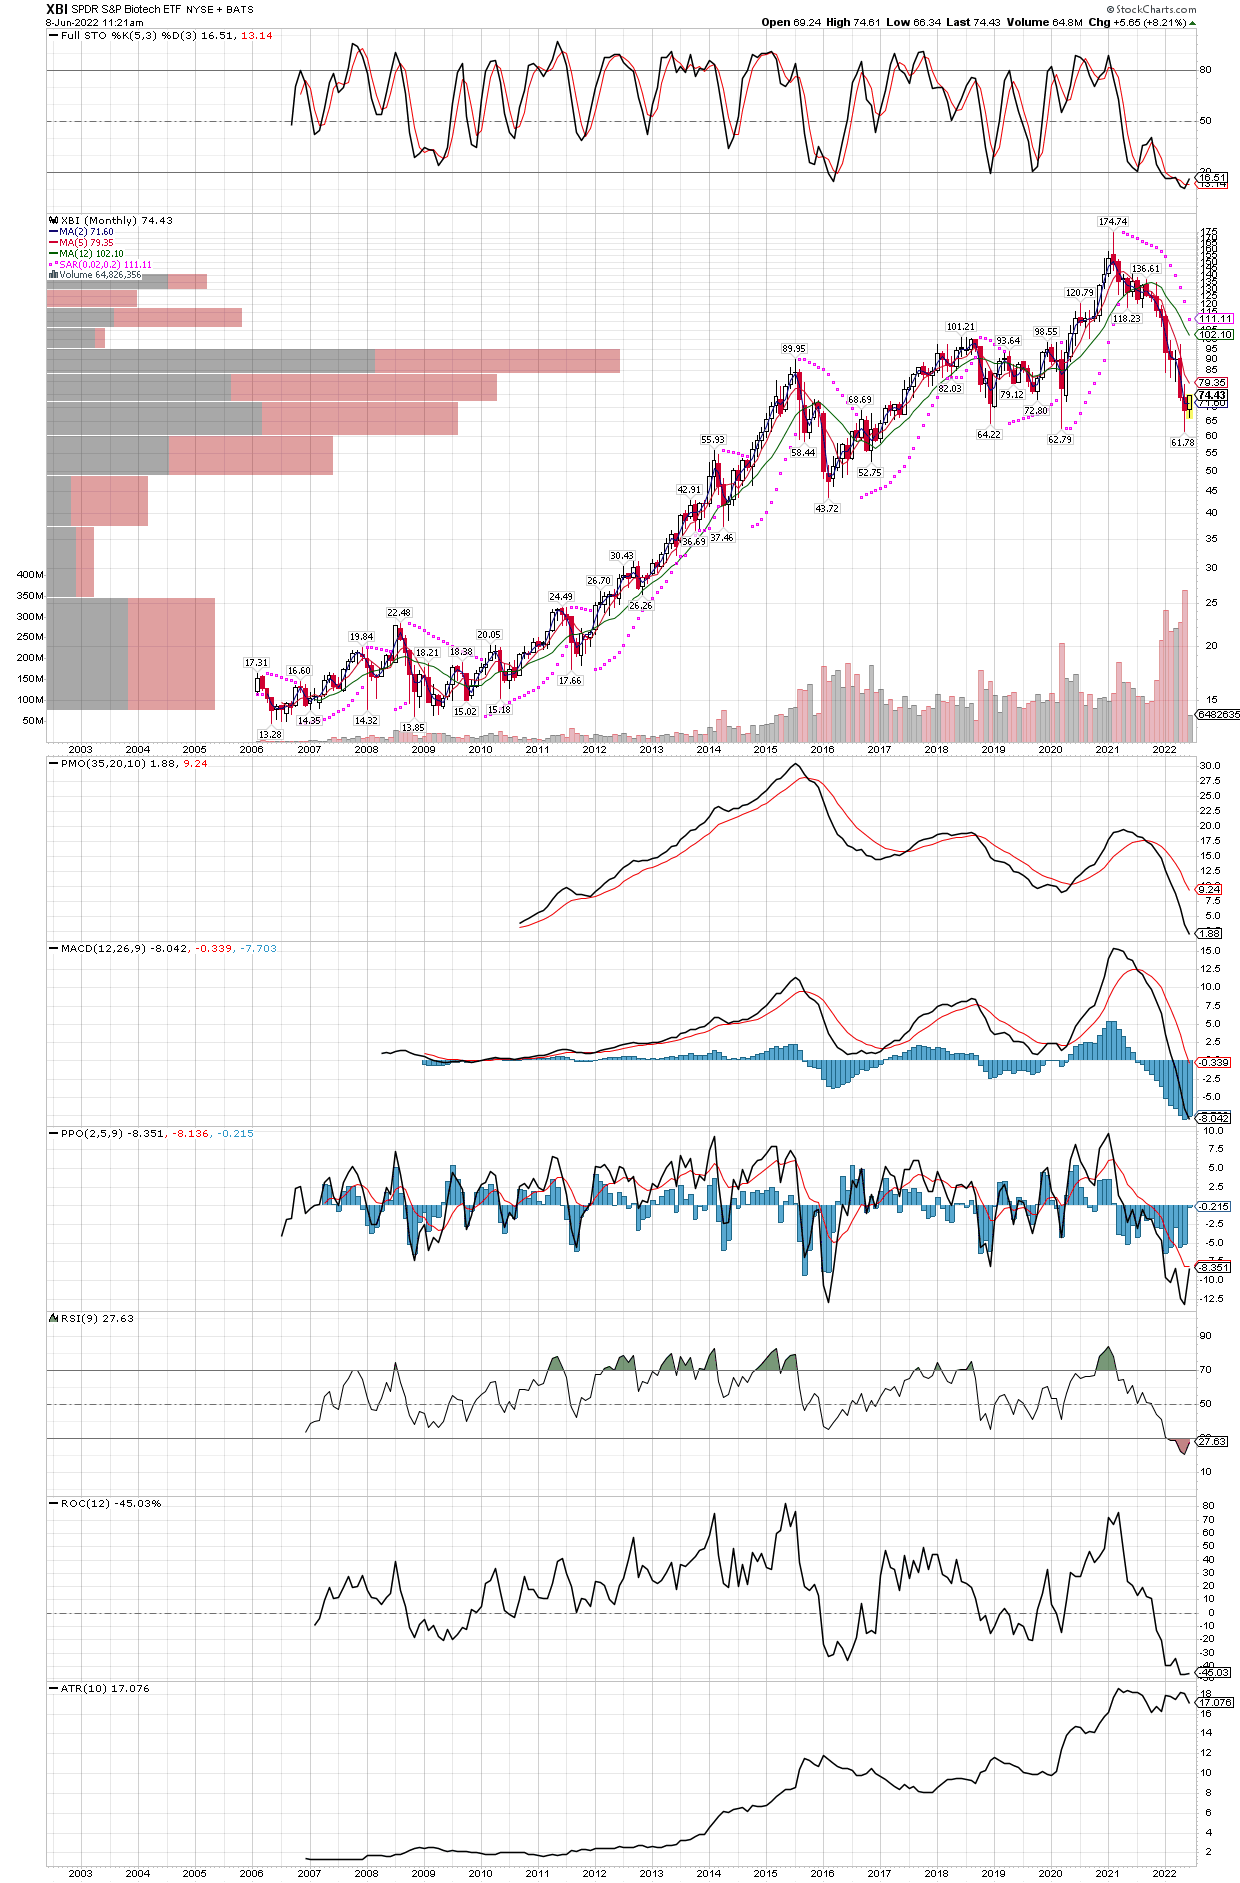
The biotechnology etf XBI has flashed a buy signal on the monthly chart, suggesting a possibly 6-10 month bounce. We are playing this using the LEAP call options that expire in Jan 2024. Be sure to note the oversold stochastics now crossing higher, the lowest RSI (9) reading in the history of the etf, and the PPO is about to print its first positive bar in 15 months. These longer term signals can take a little while to get started, but so far so good.
XBI appears to be due for a substantial bounce, on the monthly chart.
Took advantage of today’s dip to add to LEAP call options in CDE and SILJ. These expire in January 2024, with a strike price for the CDE options at $10, and for SILJ we bought both the $14 and $15 strikes.
Today, lets take a look at some ratio charts, as they show us what something is doing versus another. First we see on the daily GDX:SPY chart that the trend in outperformance of of the stock market over gold miners looks to have changed. The ratio remains above the 200 day MA, which is also gently starting an uptrend.
GDX vs. SPY
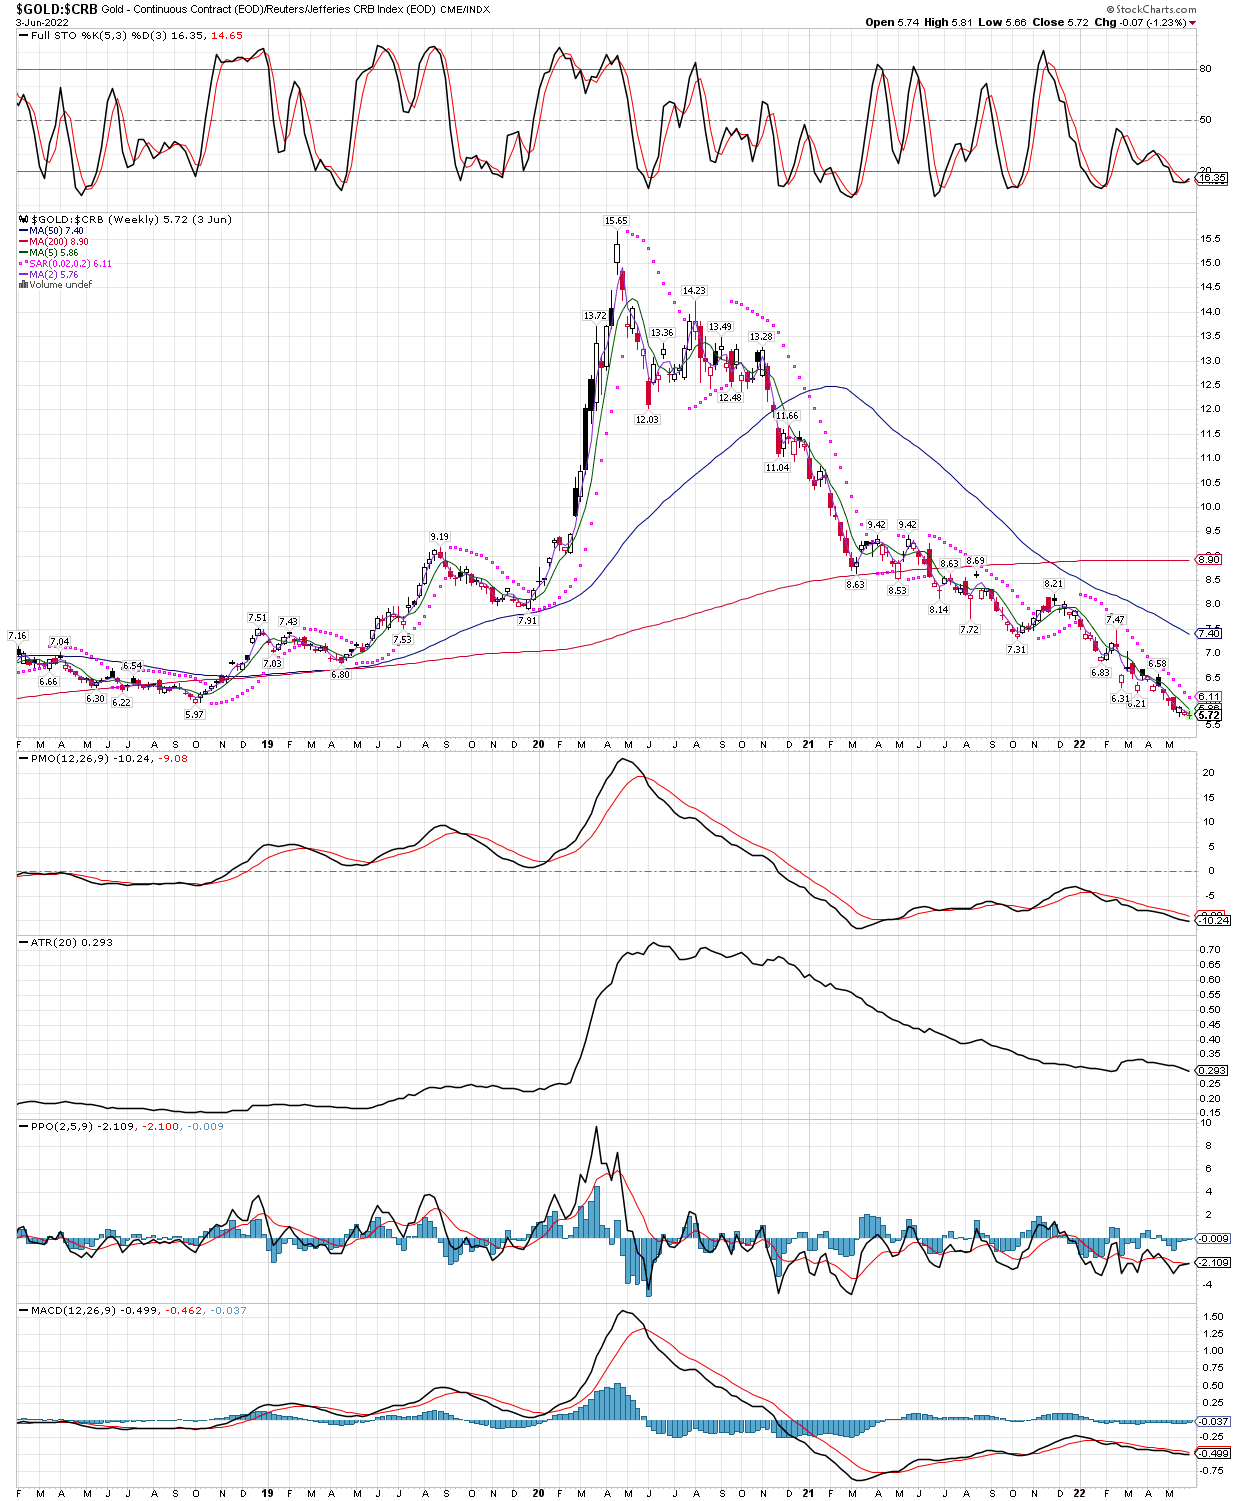
In the second chart, please note I changed it to a weekly setting, so as to get a longer term view. In this one we see the gold futures vs the CRB index, $GOLD vs. $CRB. I am not a huge fan of the CRB as an overall representation of the commodity sector, with weightings of Energy: 39%, Agriculture: 41%, Precious Metals: 7%, Base/Industrial Metals: 13%, but since precious metals are such a small part of the index at 7%, it makes for a better comparison between gold and the group in general. As you can see, gold has been underperforming the other commodities since around the middle of April 2020. However, the ratio is deeply oversold on many technicals such as stochastics, and since the nature of ratios is to normalize over time, we should expect to see either the energy, agriculture, etc come down in price, or gold to rise, or both. And if things like natural gas and oil continue to smash into new highs, that should bring gold higher as well.