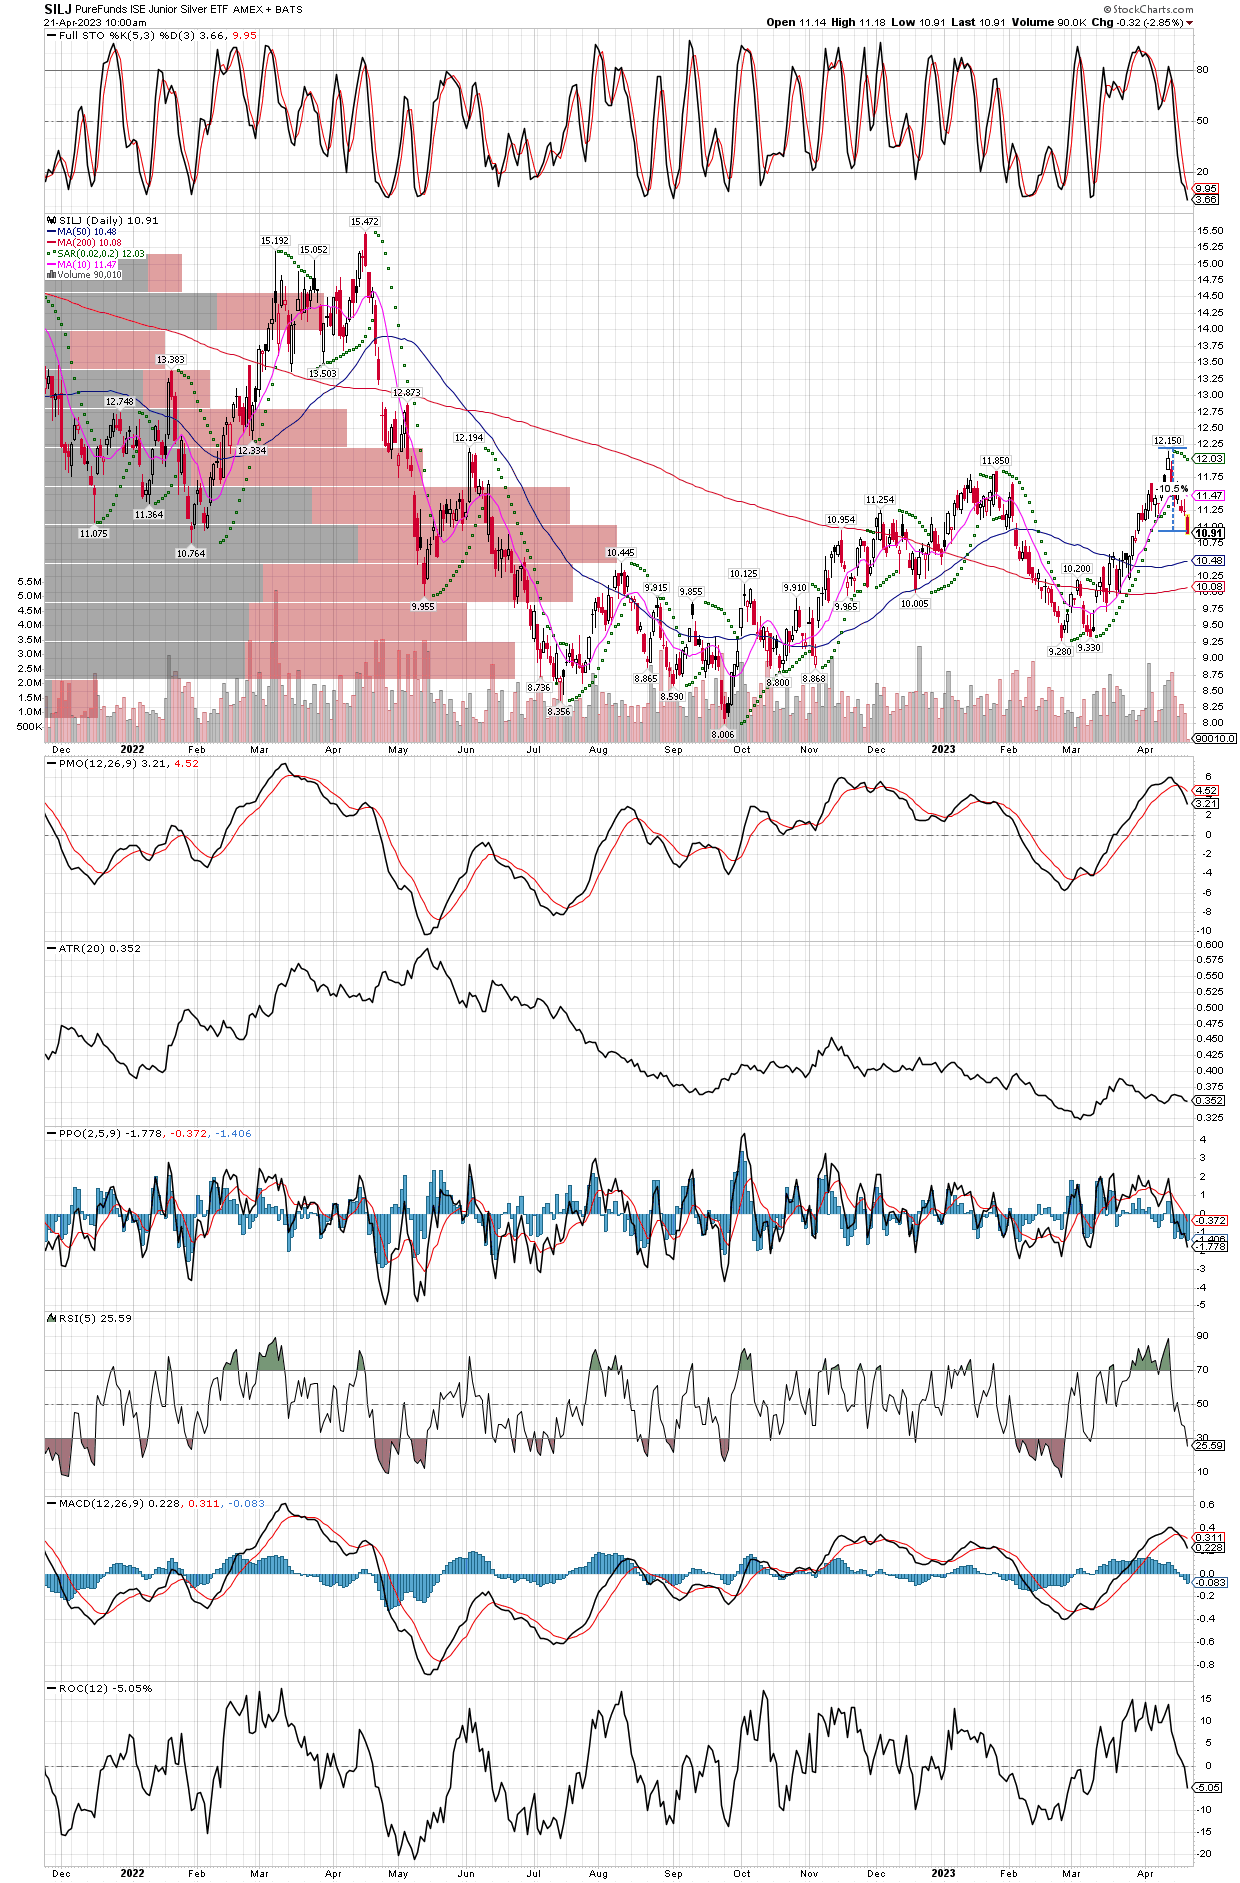
Miners are experiencing a decent pullback on the daily charts, now sporting oversold technicals like stochastics and RSI which is usually a good time to add. I am doing some nibbling here on the SILJ and trying to add to some individual miners are well, like EXK.
An 11% correction after a nice run is an area where I like to add to positions.
While I don’t make trading decisions off the COT reports, I found this very interesting.
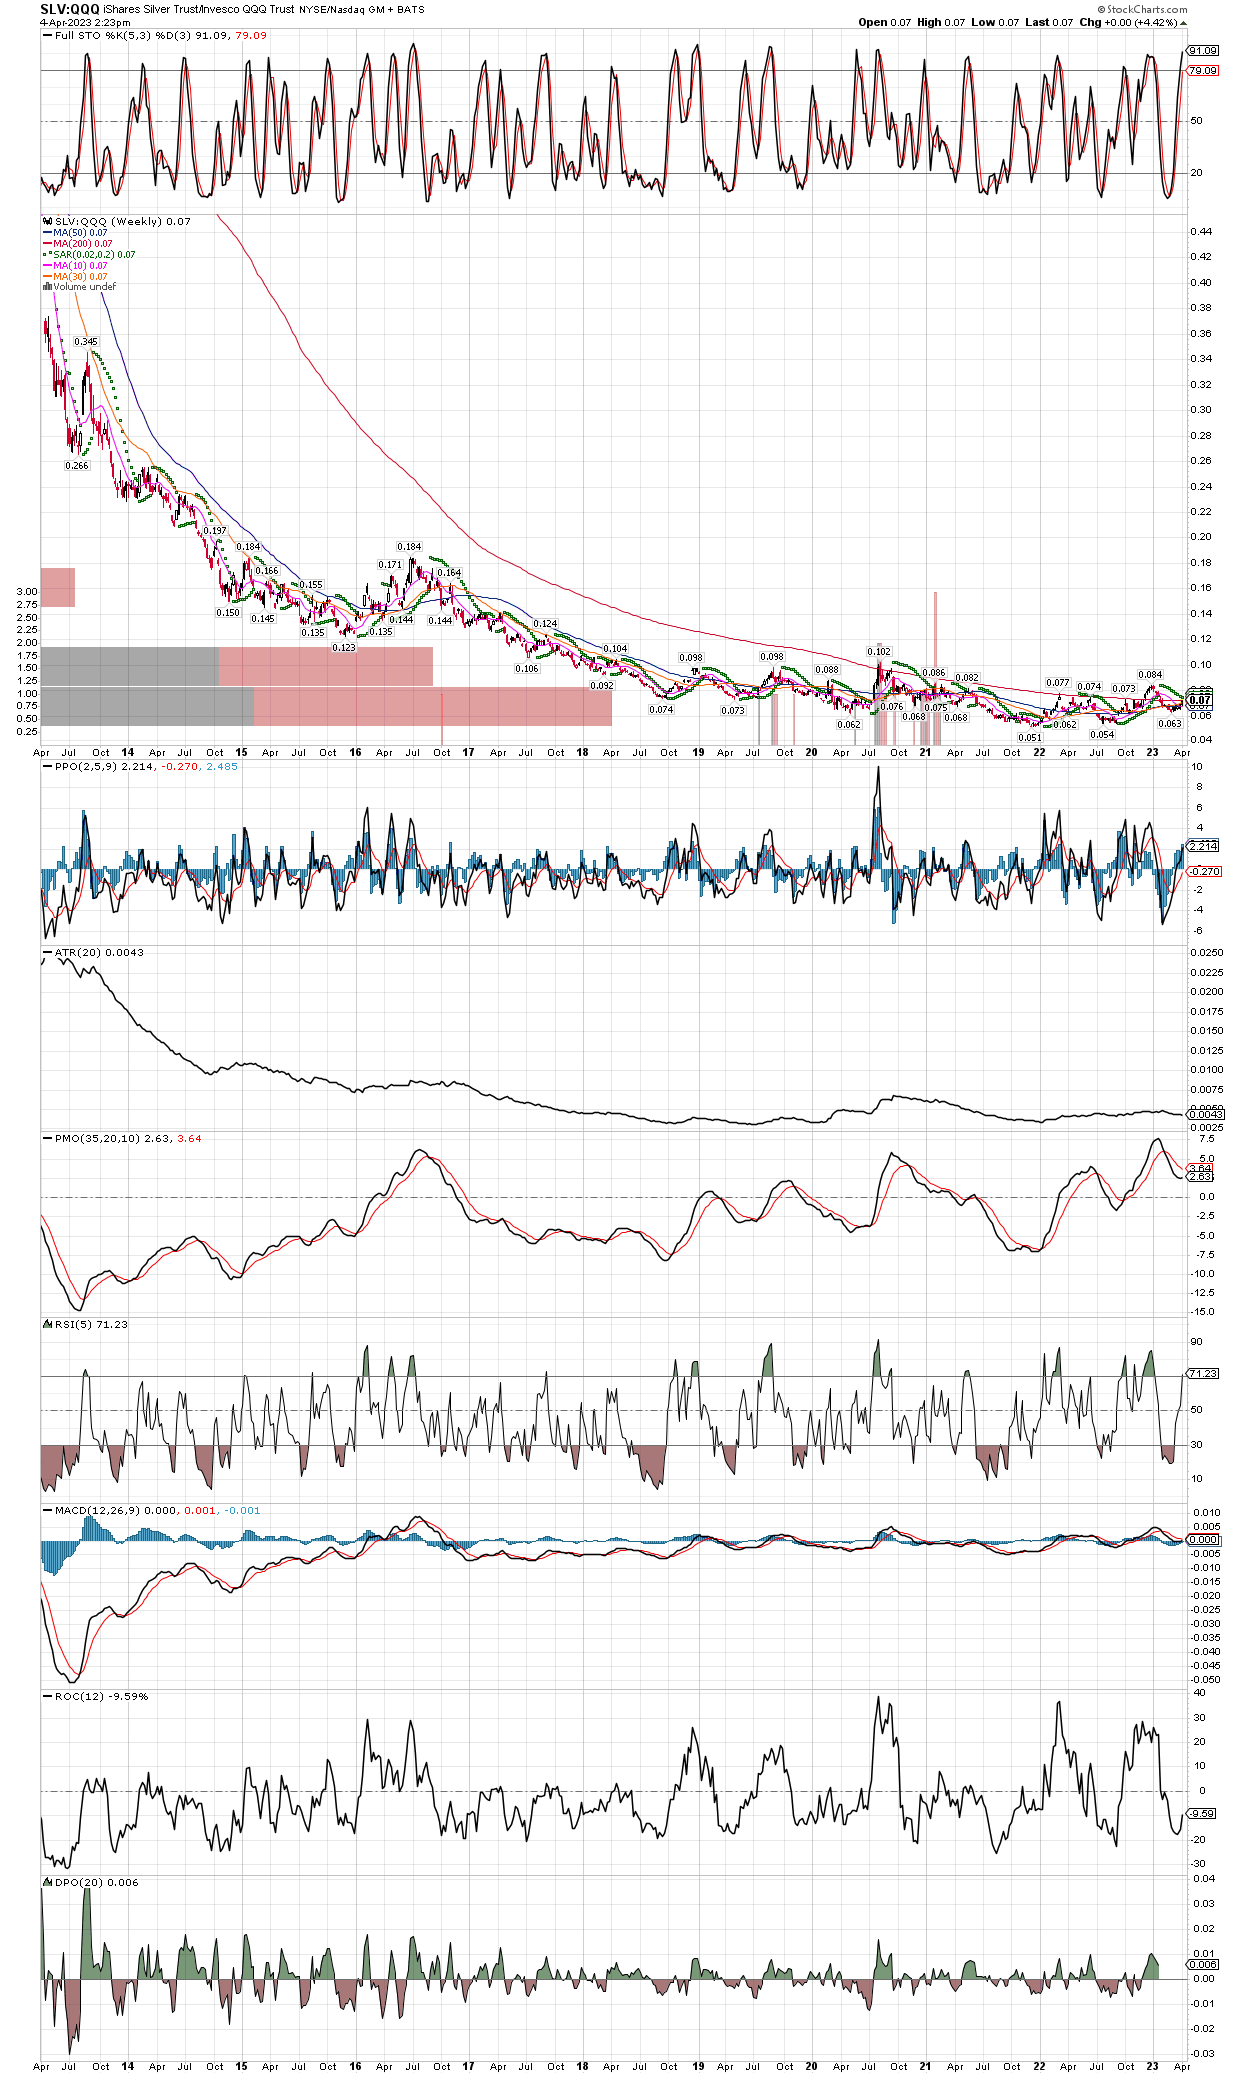
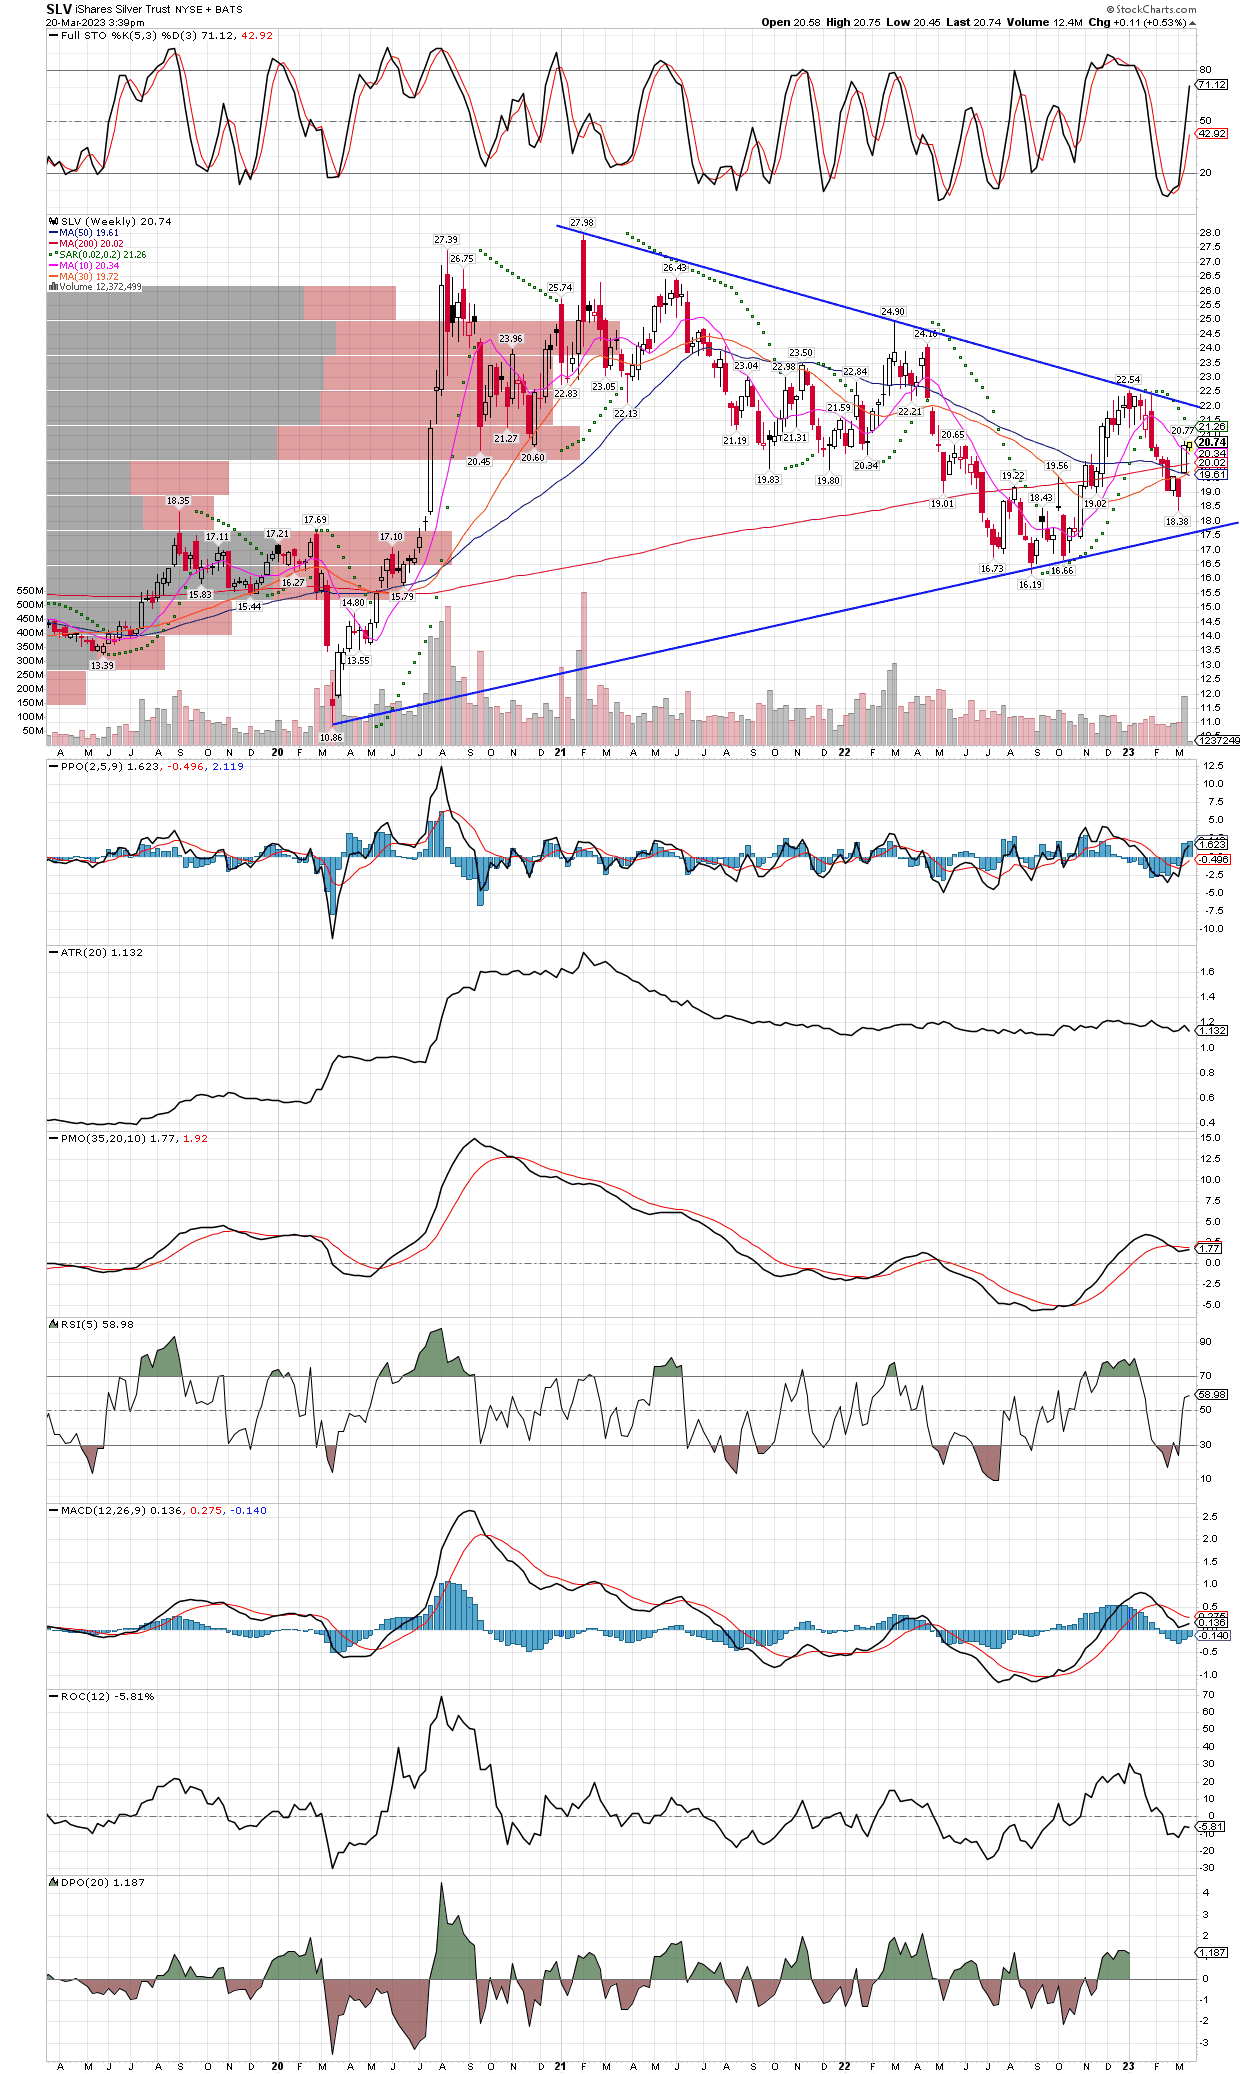
This chart goes back ten years showing SLV divided by the QQQ’s (Nasdaq market). It trends for long periods, could a breakout higher above all the moving averages lead to a big uptrend in silver and the miners? I think so, and we are getting there now, with the 200 week MA also flattening out before starting to trend higher.
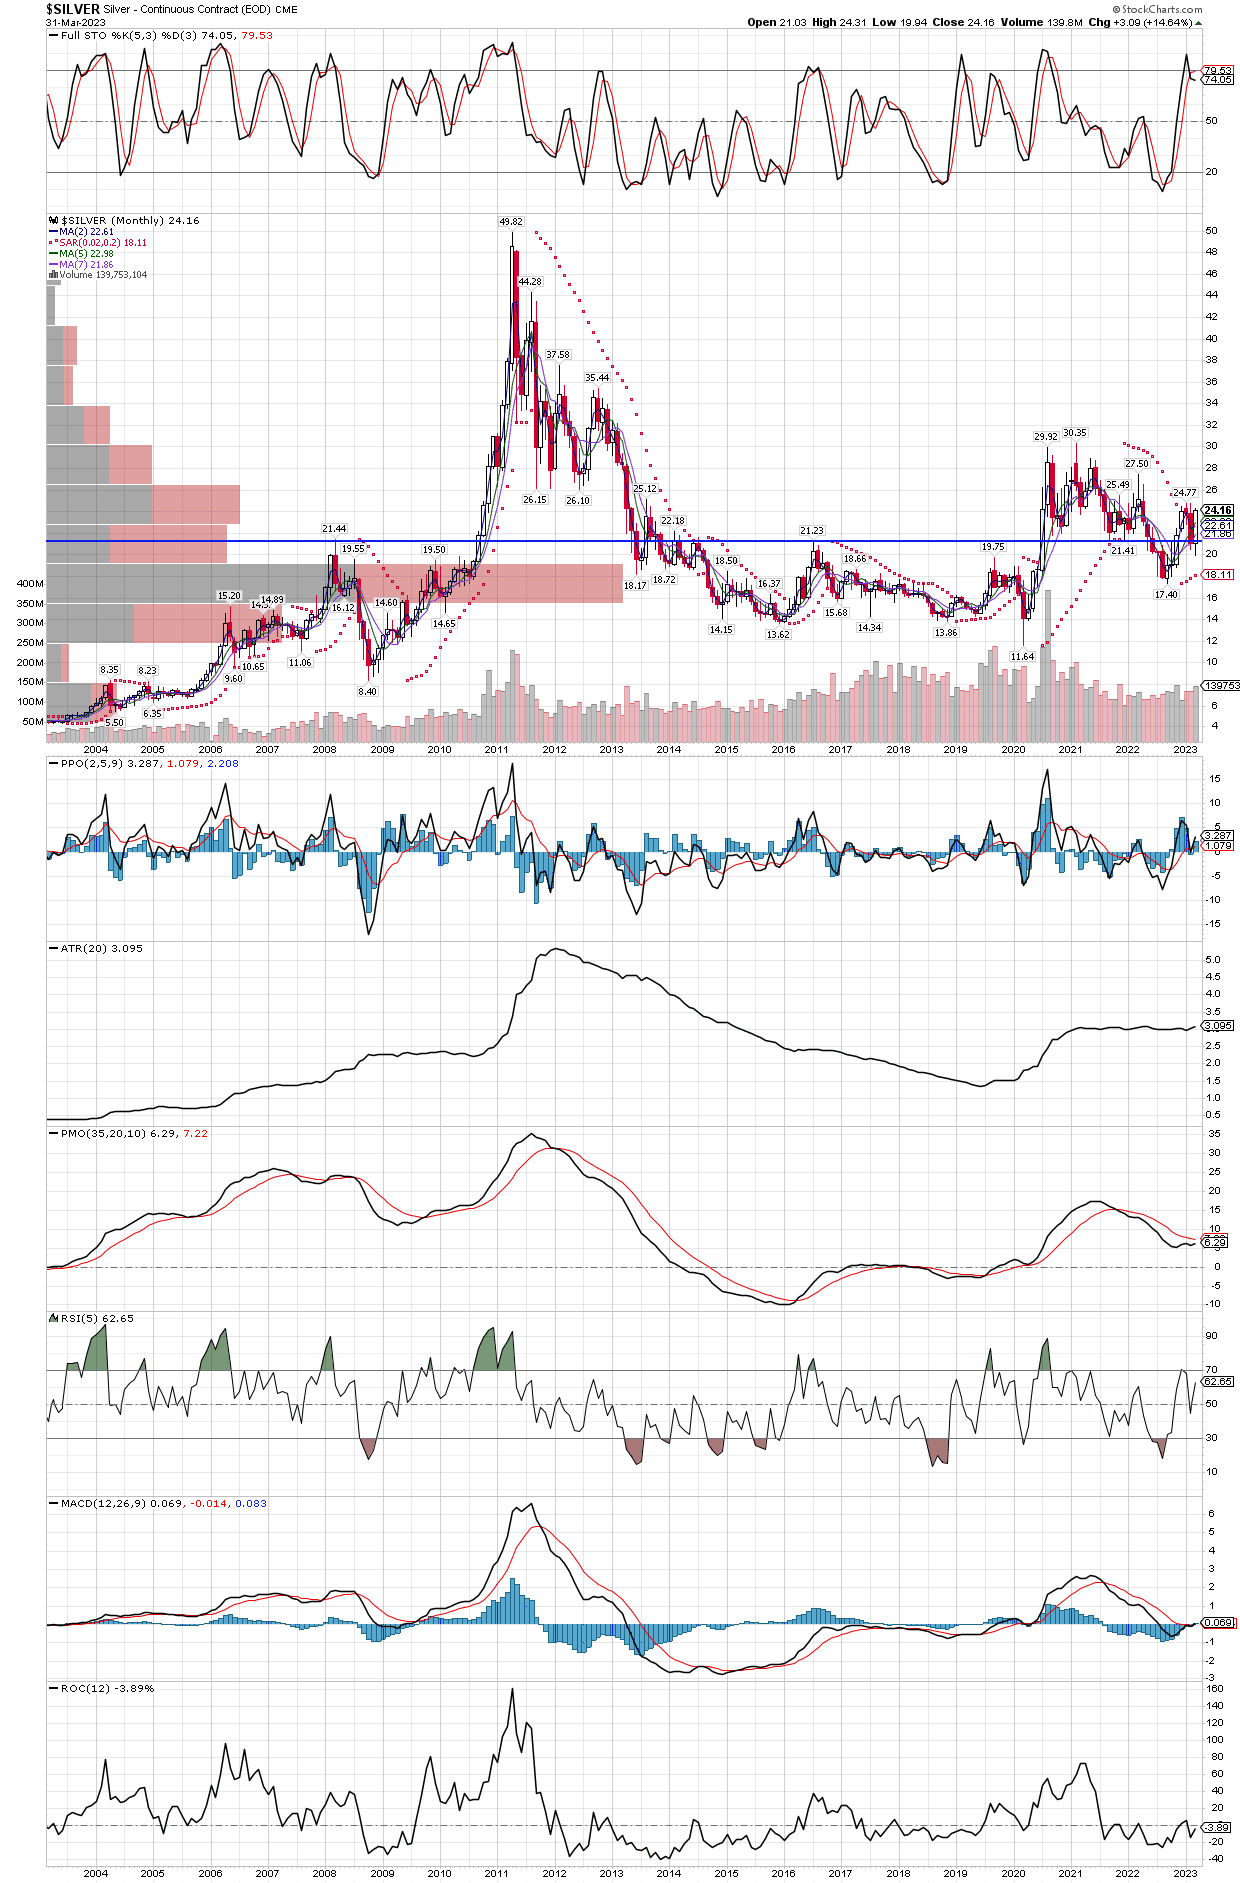
Just a quick post looking at the $Silver futures monthly chart, going back twenty years. It shows strong support in the $21-$22 area, and no resistance once it gets over the $27-$28 level. Everything I pay for, both goods and services, have at least more than doubled in the last two years, so there is no reason to not think silver will do the same and take out it’s all time high near $50, and quite likely go much higher from there. With gold at $2000 again already, silver could be the best investment on the planet at the moment.
I am going to go out on a limb, and say that SILJ will not go below $10/share again in this bull market. I will discuss the chart in a minute, but so many things have been happening lately with banks going belly up in both the US and Europe, real estate prices now souring, and inflation still a big problem, that the fundamentals supporting precious metals are now better than at any time since the late 70’s. Combine these observations with the technicals on the charts, gold trading near all time highs, etc, and its a recipe for a rip-roaring bull market. I saw this morning that Equinox gold is selling forward some of its gold production, about $200 million worth, in order to fund their newest mine build. Normally selling production forward is something shareholders don’t like, we want the exposure to higher metals prices in the future, but here is where the EQX news gets interesting. They sold gold for approximately $2175/ounce, deliverable between 2024 and 2026, which shows the buyers think gold will be north of that level, and well into new all time highs! Not only did they not have to dilute shareholders to fund the new mine, they are getting prices for their gold that have yet to be seen on the futures markets, suggesting the real price of gold is much higher than what leveraged paper exchanges are showing. Let’s hope this starts a trend in the industry, where producers raise funds at prices much higher than current paper metal prices. Importantly, it is still too early to focus on junior explorers, in my opinion, this option would not be available to them as it has to be a miner already producing the metal, this means the small juniors will still have to dilute shareholders, so I am sticking with mid-cap producers for the time being in the SILJ etf. Here is the Equinox article https://www.equinoxgold.com/news/equinox-gold-announces-up-to-200-million-in-gold-prepay-and-gold-purchase-and-sale-arrangements/
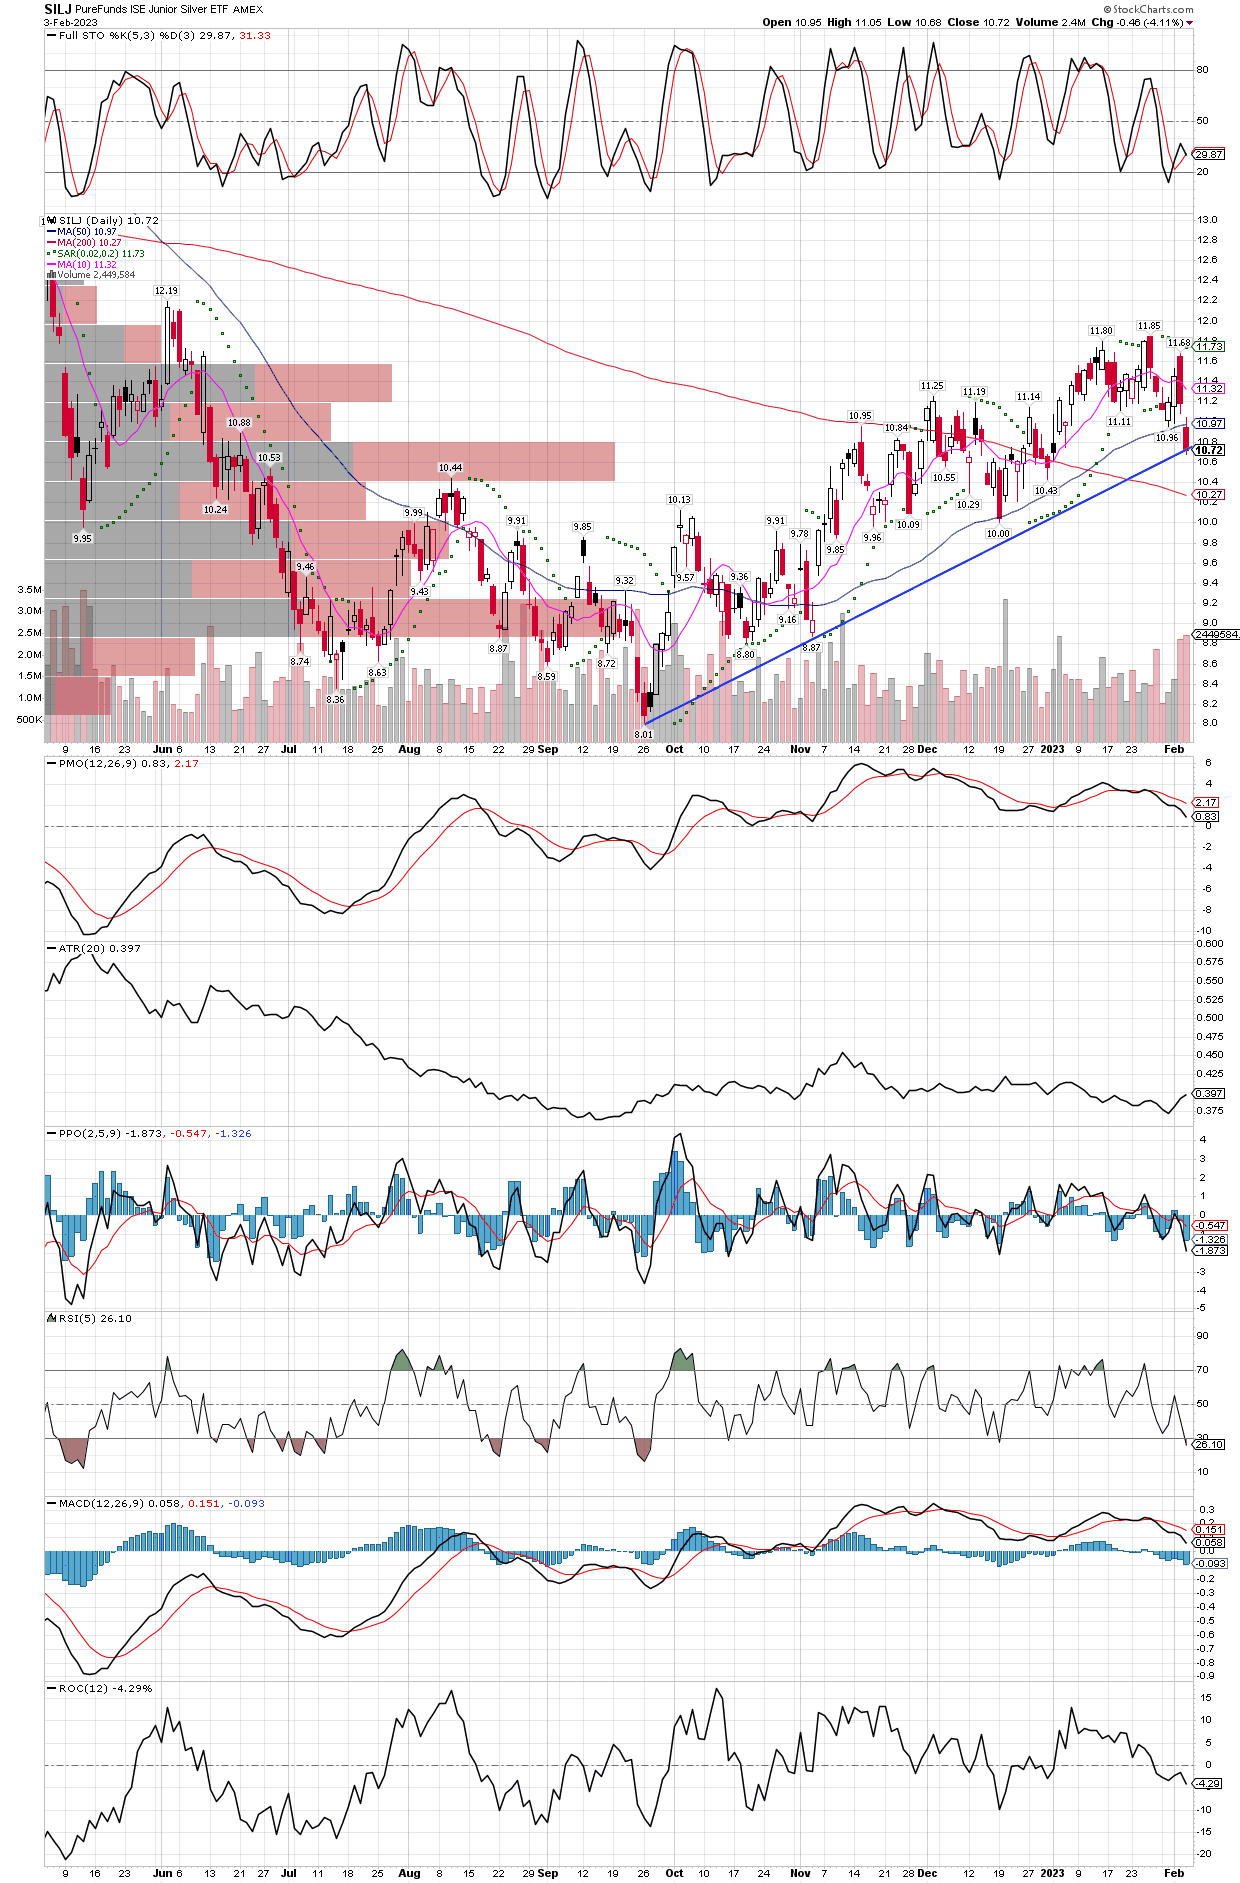
Now lets look at the charts. SILJ’s 200 day MA is flatlining and about to turn higher, as the GDX etf just did today. We are also in a new intermediate cycle, about 3 weeks in so far, so should expect to see generally higher prices for many more weeks. Besides the steep trend line I have drawn also sitting on the 10 day MA, SILJ could find support at the 50 day MA around $10.40, and especially at the 200 and 20 day MA´s down at $10, on any pullback. With the 200 day MA about to trend higher, I feel fine predicting the bull is back in force, and SILJ won’t go below the $10 level again for the rest of this bull market.
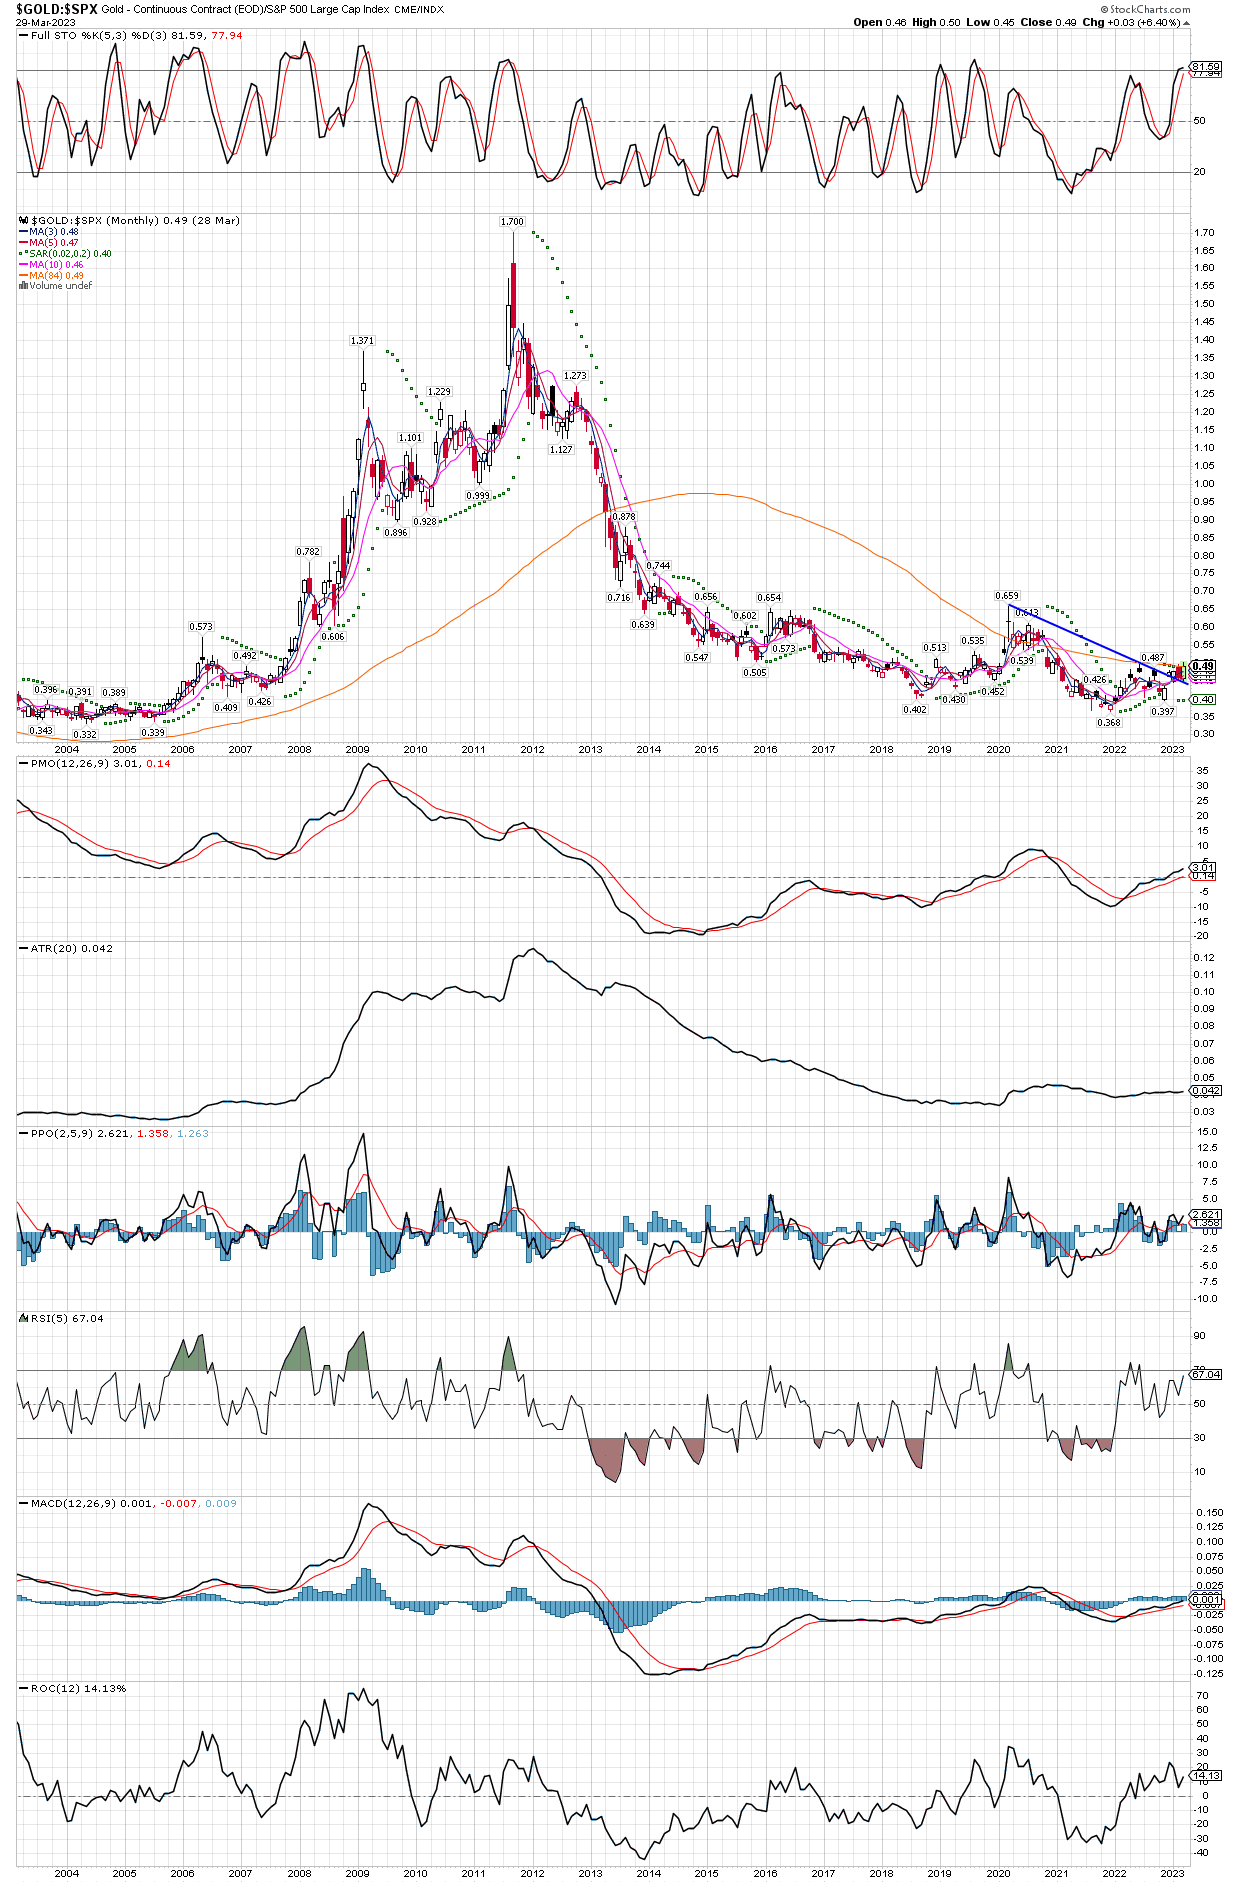
Next, let’s take a peek at a ratio chart of $GOLD vs. the $SPX. I must mention I got the idea from Patrick Karim, a fine technical analyst over at NorthStar BadCharts, but I sometimes find his charts hard to read the fine print, so I made my own ratio chart with the broken down trend line. Not only has gold broken out vs. the S&P on a long term, monthly chart, as Patrick suggests, the ratio is breaking above the very important .49 level he determines by using the 84 month MA. In short, he suggests a monthly close over .49 is a historic breakout, one of only four that have happened in the last 100 years or so. It would usher in a new, big bull market in metals and miners, and the end of the month and the quarter is just 3 days away. Gold itself might even achieve an new all time closing high on the monthly and quarterly charts, so very exciting things are occurring, all with the backdrop of failing banks and the Fed expanding its balance sheet again!
There has been so many headlines lately that its hard to keep up! It doesn’t matter, when one has a plan. Gold, silver, and miners have been the only things rising lately, so will likely entice investors to get involved at some point soon, and considering we are very early in the new intermediate cycles for metals and miners as we are probing breakout areas, this could be the start of something big.
Besides adding to several precious metals positions over the last few weeks, I just started to nibble on uranium miners via the URA, URNM, and URNJ etfs. I will cover the new stake in uraniums in the next posts, but I have only started and my major focus in on precious metals and their miners at the moment. The fundamentals are in place with big banks going belly up daily, and while the central banks so far are still getting involved with printing money to soften the blow, there are other things vaporizing overnight like crypto bank Silvergate Capital, institutions that are unlikely to get bailed out. The Fed is now trapped, plain and simple, if they choose to continue to fight inflation by raising rates, that will continue to bury the banks and the economy. And if the Fed changes course and starts making more fiat currency out of nothing, with inflation rates already very high, this tact will cause inflation to get much worse. All one has to do is ignore the distractions and panic, and be out of banks and most paper financial assets, instead be invested in real assets, tangibles like gold and silver, as well as their miners since they also own the physical commodity already safely buried in the ground. Other commodities are fine as well, like uranium mentioned above, but in the immediate future as the economy tanks, things like energy and base metals will see demand destruction and pressure on prices quite possibly. I want to own copper miners at some point, but unlike uranium miners, coppers have not yet pulled back enough and consolidated long enough yet to turn me into a buyer. Still I would own just about anything commodities over financial assets at this stage of the game, though I would not trade futures contracts any longer with the credibility of the exchanges in serious doubt. I will stick with the miners of commodities, and physical metals when it comes to gold and silver.
Over $22 on SLV gets really interesting, and Gold is already approaching all-time highs!
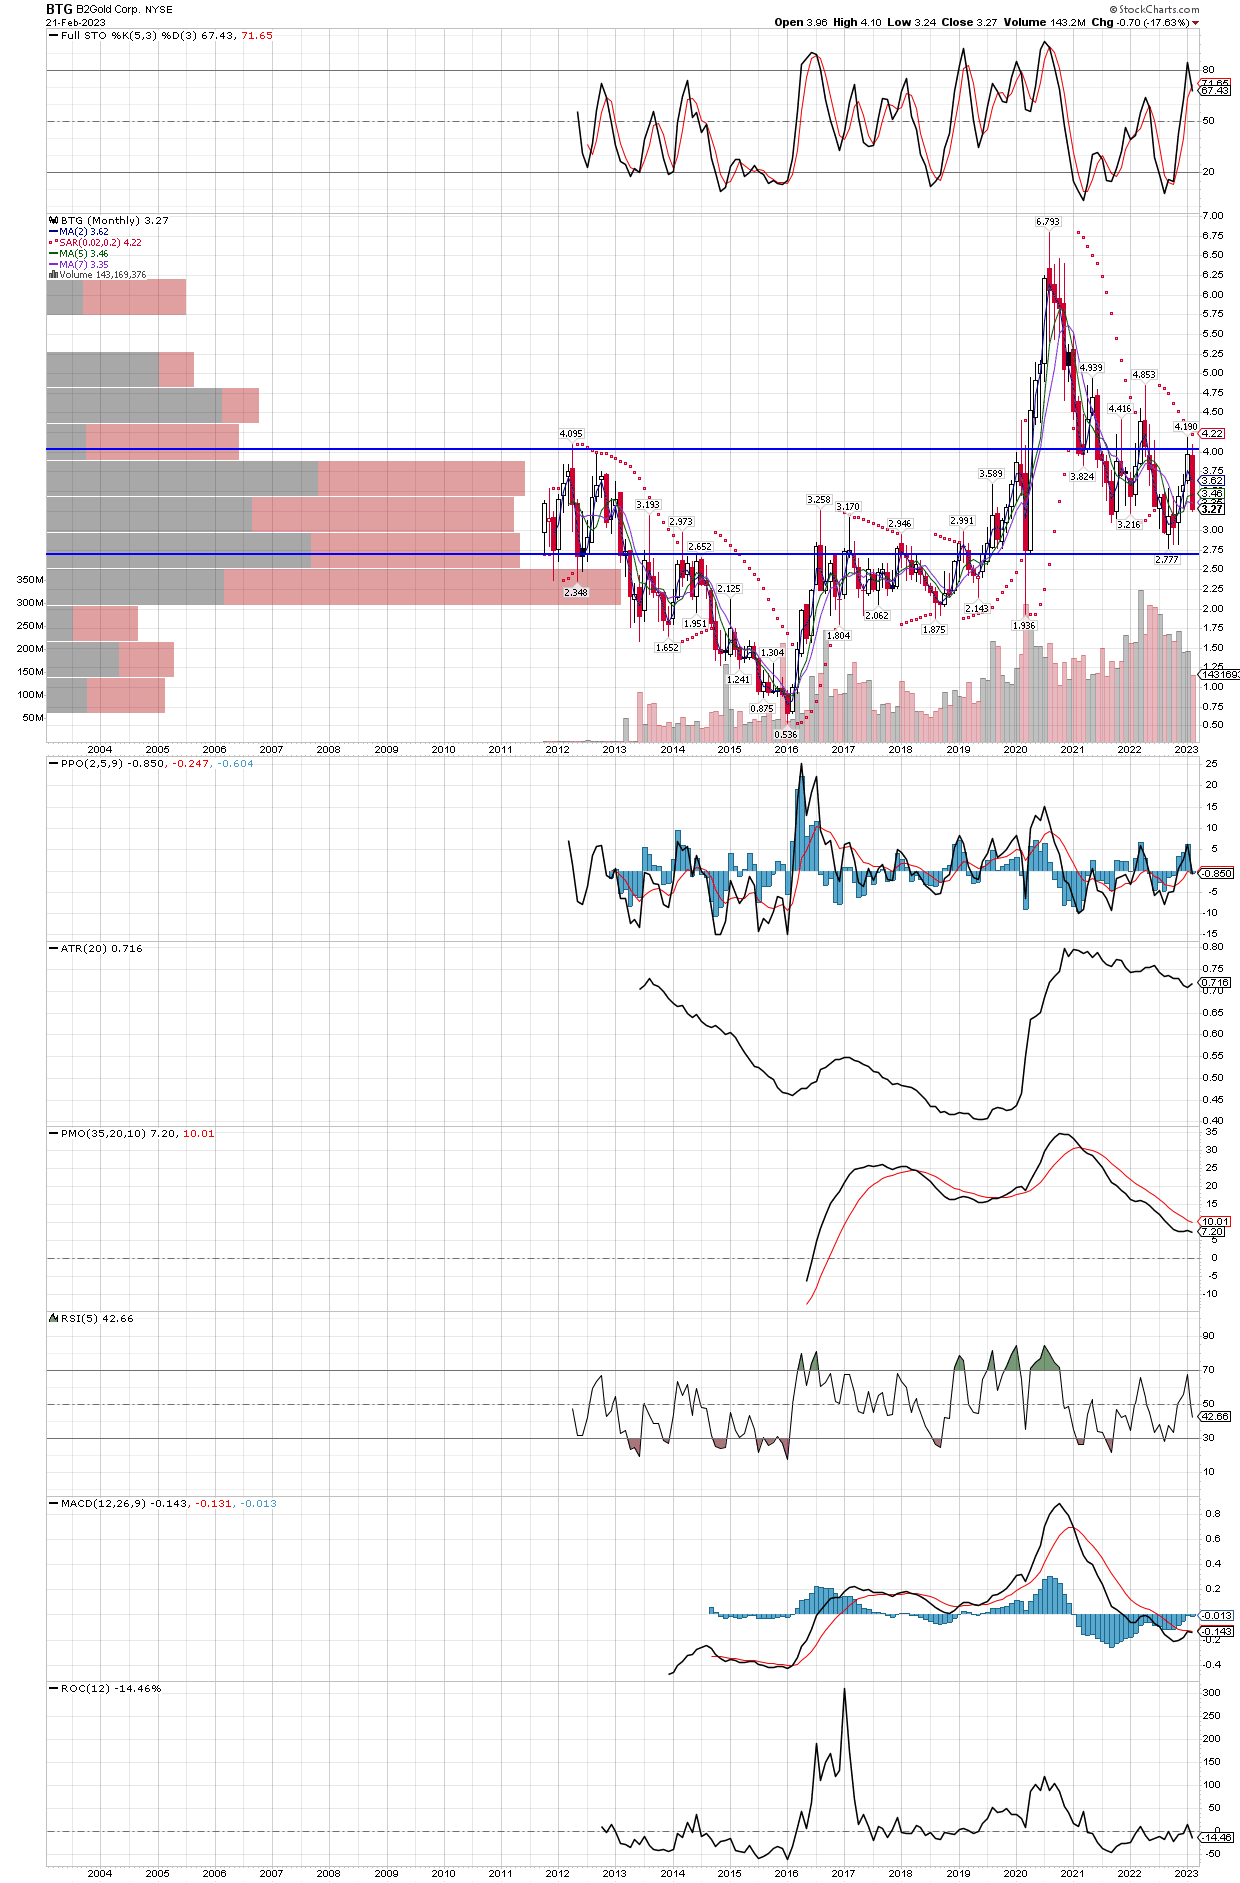
B2 Gold (BTG) pays a 4.82% dividend as of last night’s close, and is in an area I don’t mind buying. A return just to the recent high two months ago would be a 30% gain, and a return to the all time high made in 2020 would be well over a double from here. I like that it made all time highs in the last couple years, it will likely do it again as their free cash flow continues to grow. Below is the monthly chart, and while I prefer the stochastics to be oversold, they still have not reached overbought so the shares still have more upside potential. And the weekly chart does show the stochastics to be oversold already, so I have no problem buying into a roughly 25% decline that has occurred over the last four weeks
Getting paid 4.82% while we wait for BTG to make new all-time highs again
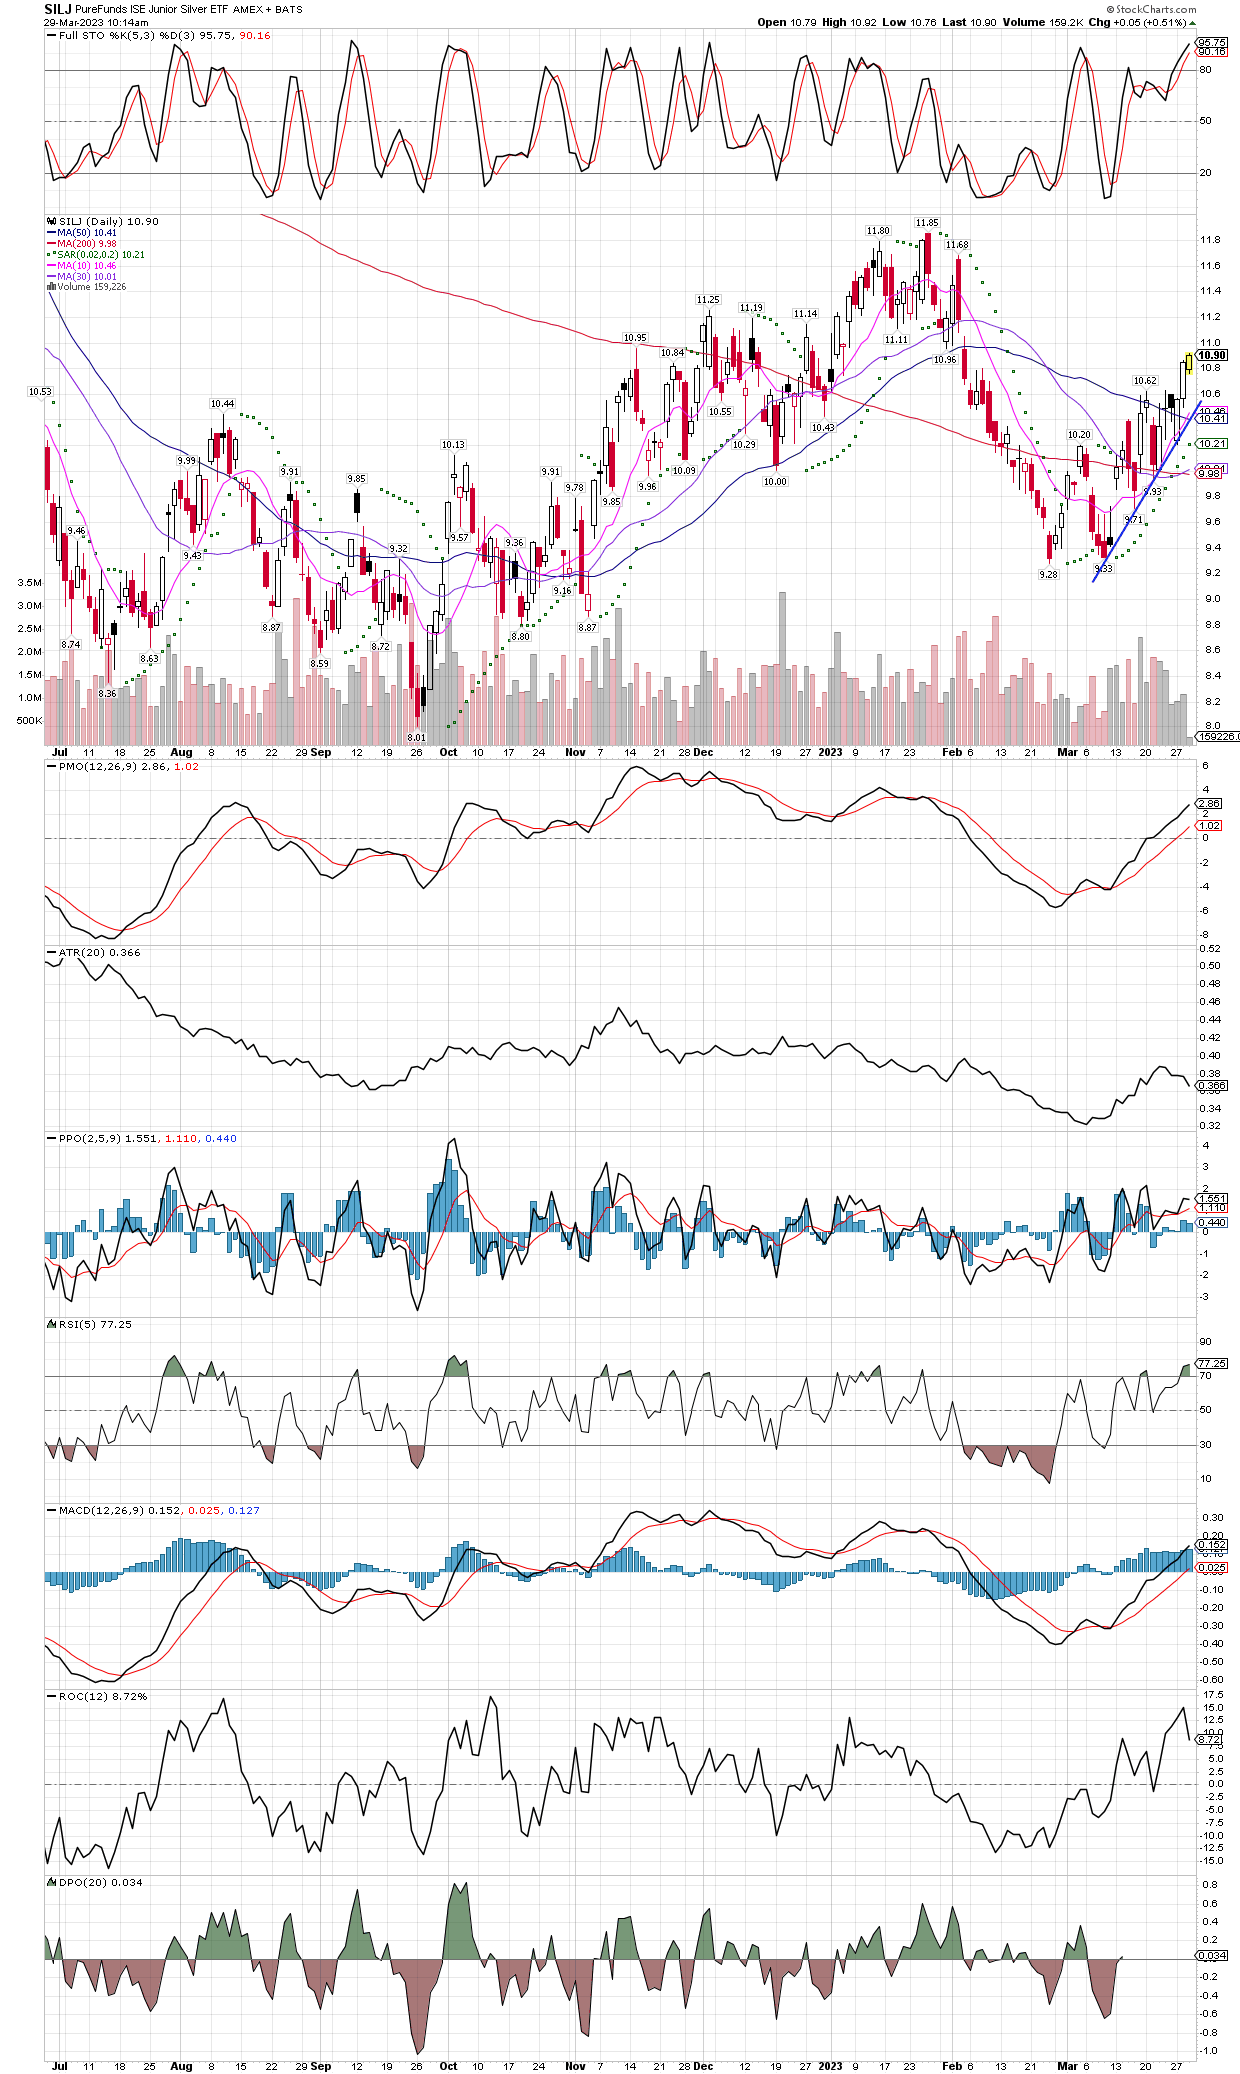
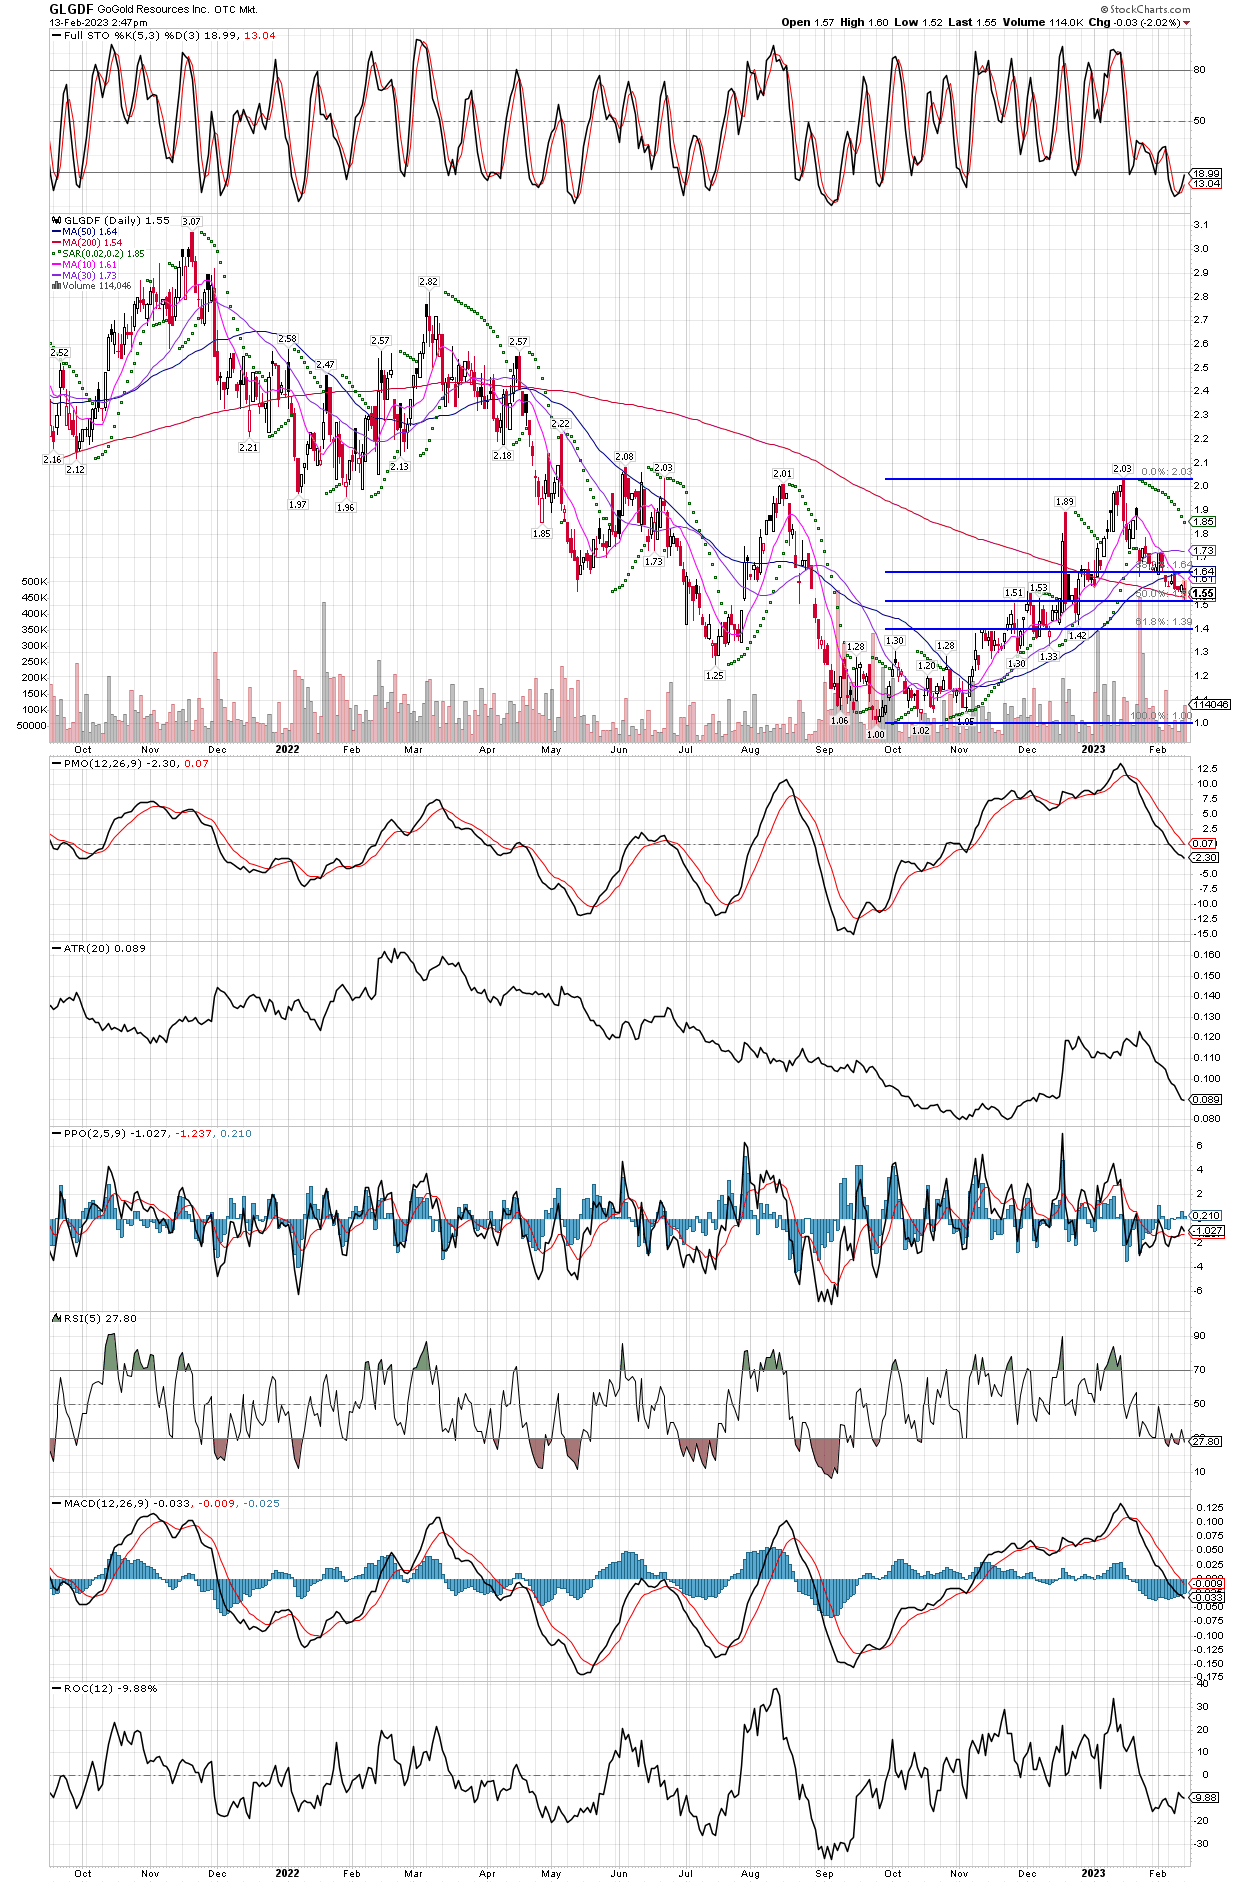
GoGold Resources has a classic daily chart, nice run up that doubled the price with a typical 50% pull back shown by the Fibonacci retracement, into oversold stochastics. There are several miners sporting similar charts that I am willing to start a position in, or add to our existing positions. Its a lower risk entry in this area, sitting on its 200 day MA as well, so I bought some across all accounts. In fact, the SILJ etf is quite similar, with regards to the 50% retracement, so I might add to it tomorrow morning.
Sitting on its 200 day MA, after retracing 50% of the run higher since November
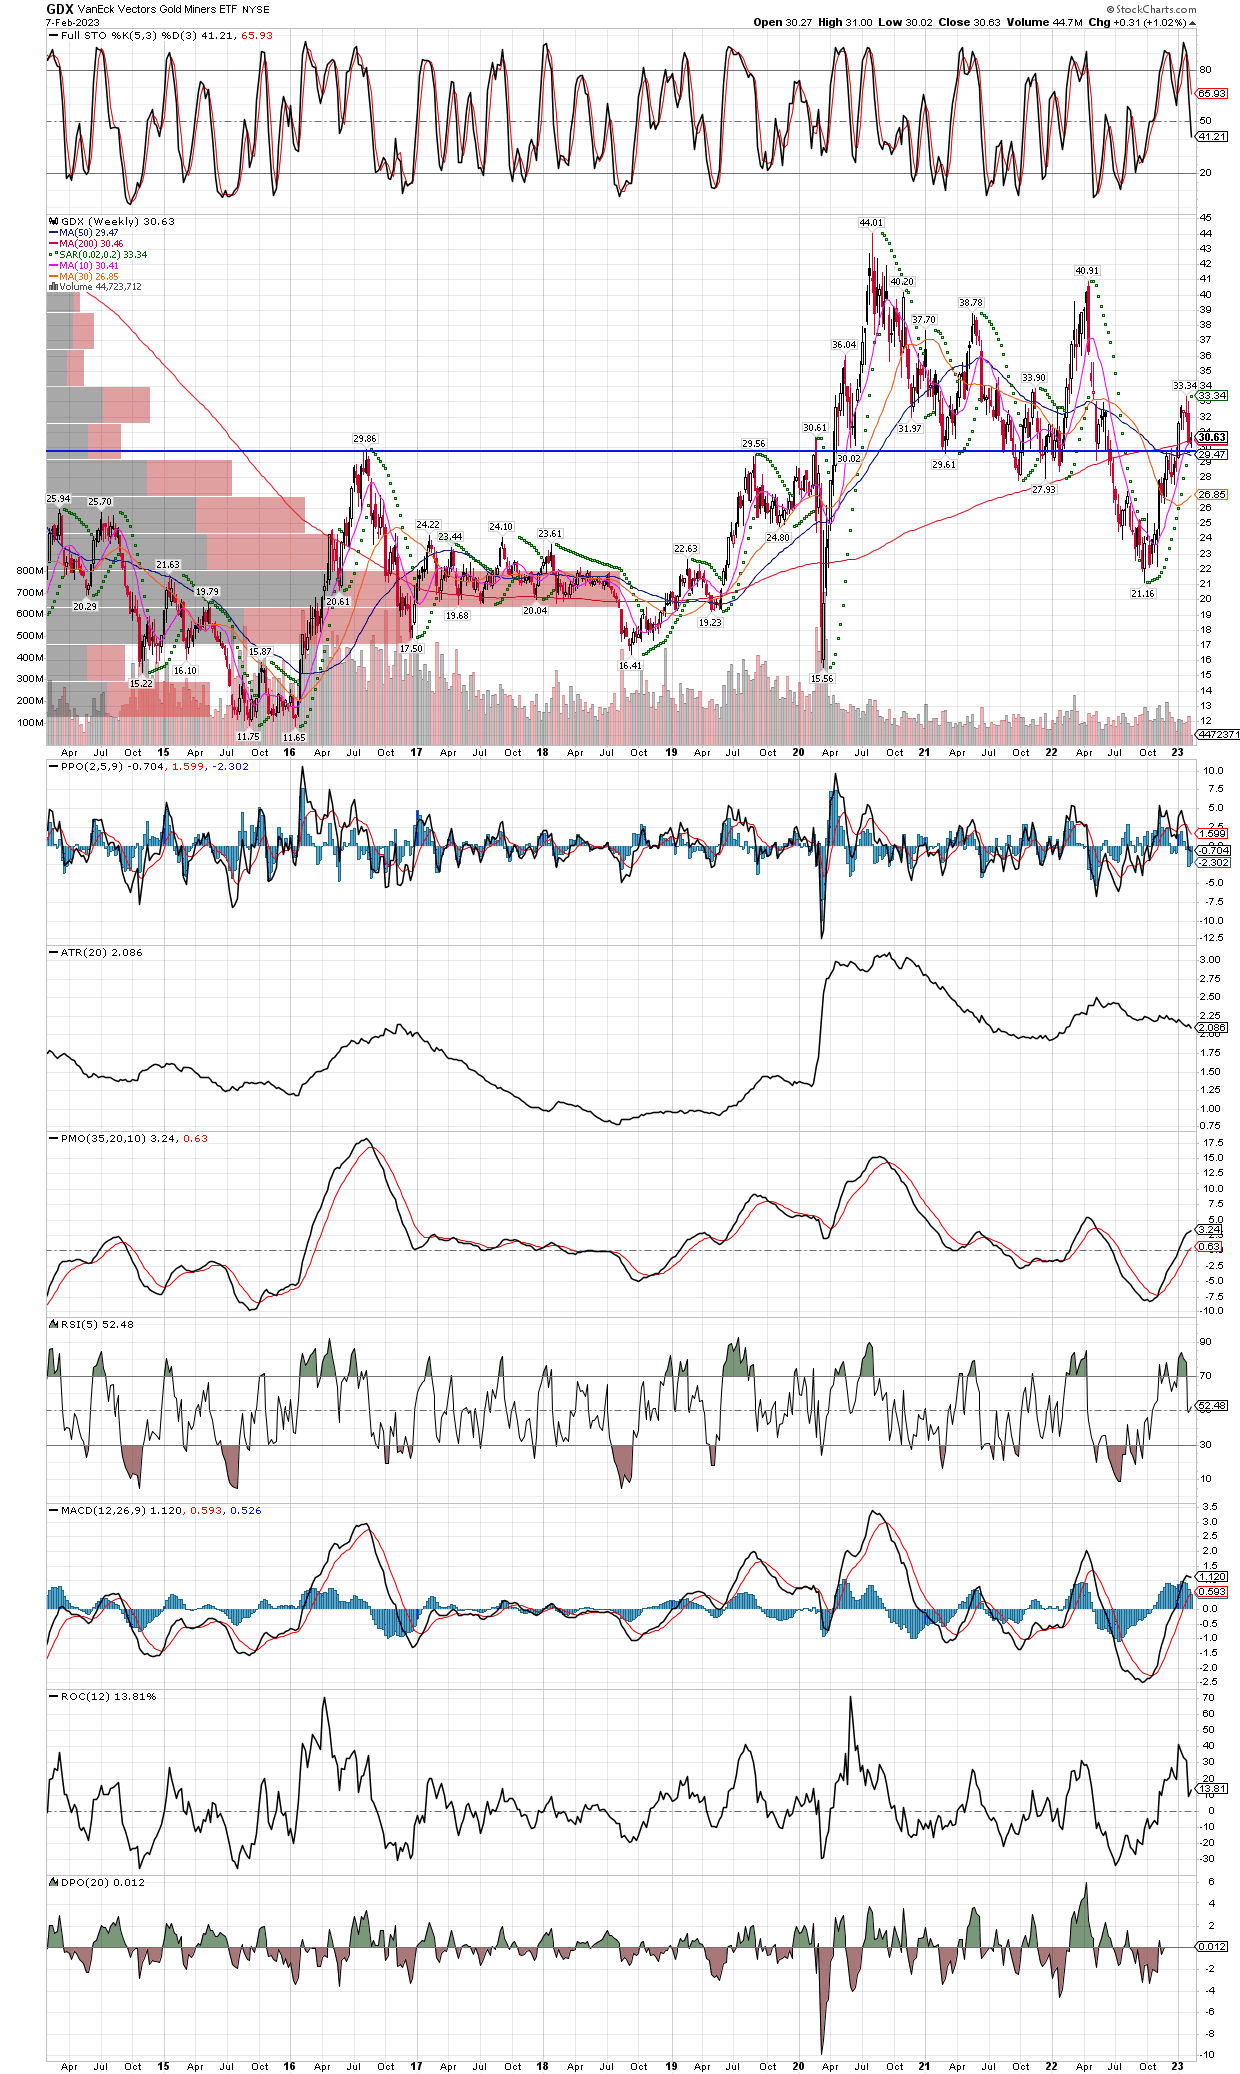
The weekly chart of GDX is close to presenting another buying opportunity. After trimming 16% of our holdings in the precious metals miners the last couple weeks, I am slowly putting the money back to work at lower prices. I added small amounts back again today, but am prepared to put all the proceeds back into miners this week if they and the metals can drop a little more into well oversold technical levels on the weekly charts. I will only buy when the intraday stochastics on the 30 min bar chart are oversold, to help with timing discipline. Here is the GDX, with a horizontal trend line I drew like with yesterday’s silver chart. Note that they look quite similar, which tells me they are more likely to stall their downside move than not, in the areas near the trend lines.
GDX weekly chart gong back 9 years, I feel good buying into this decline.
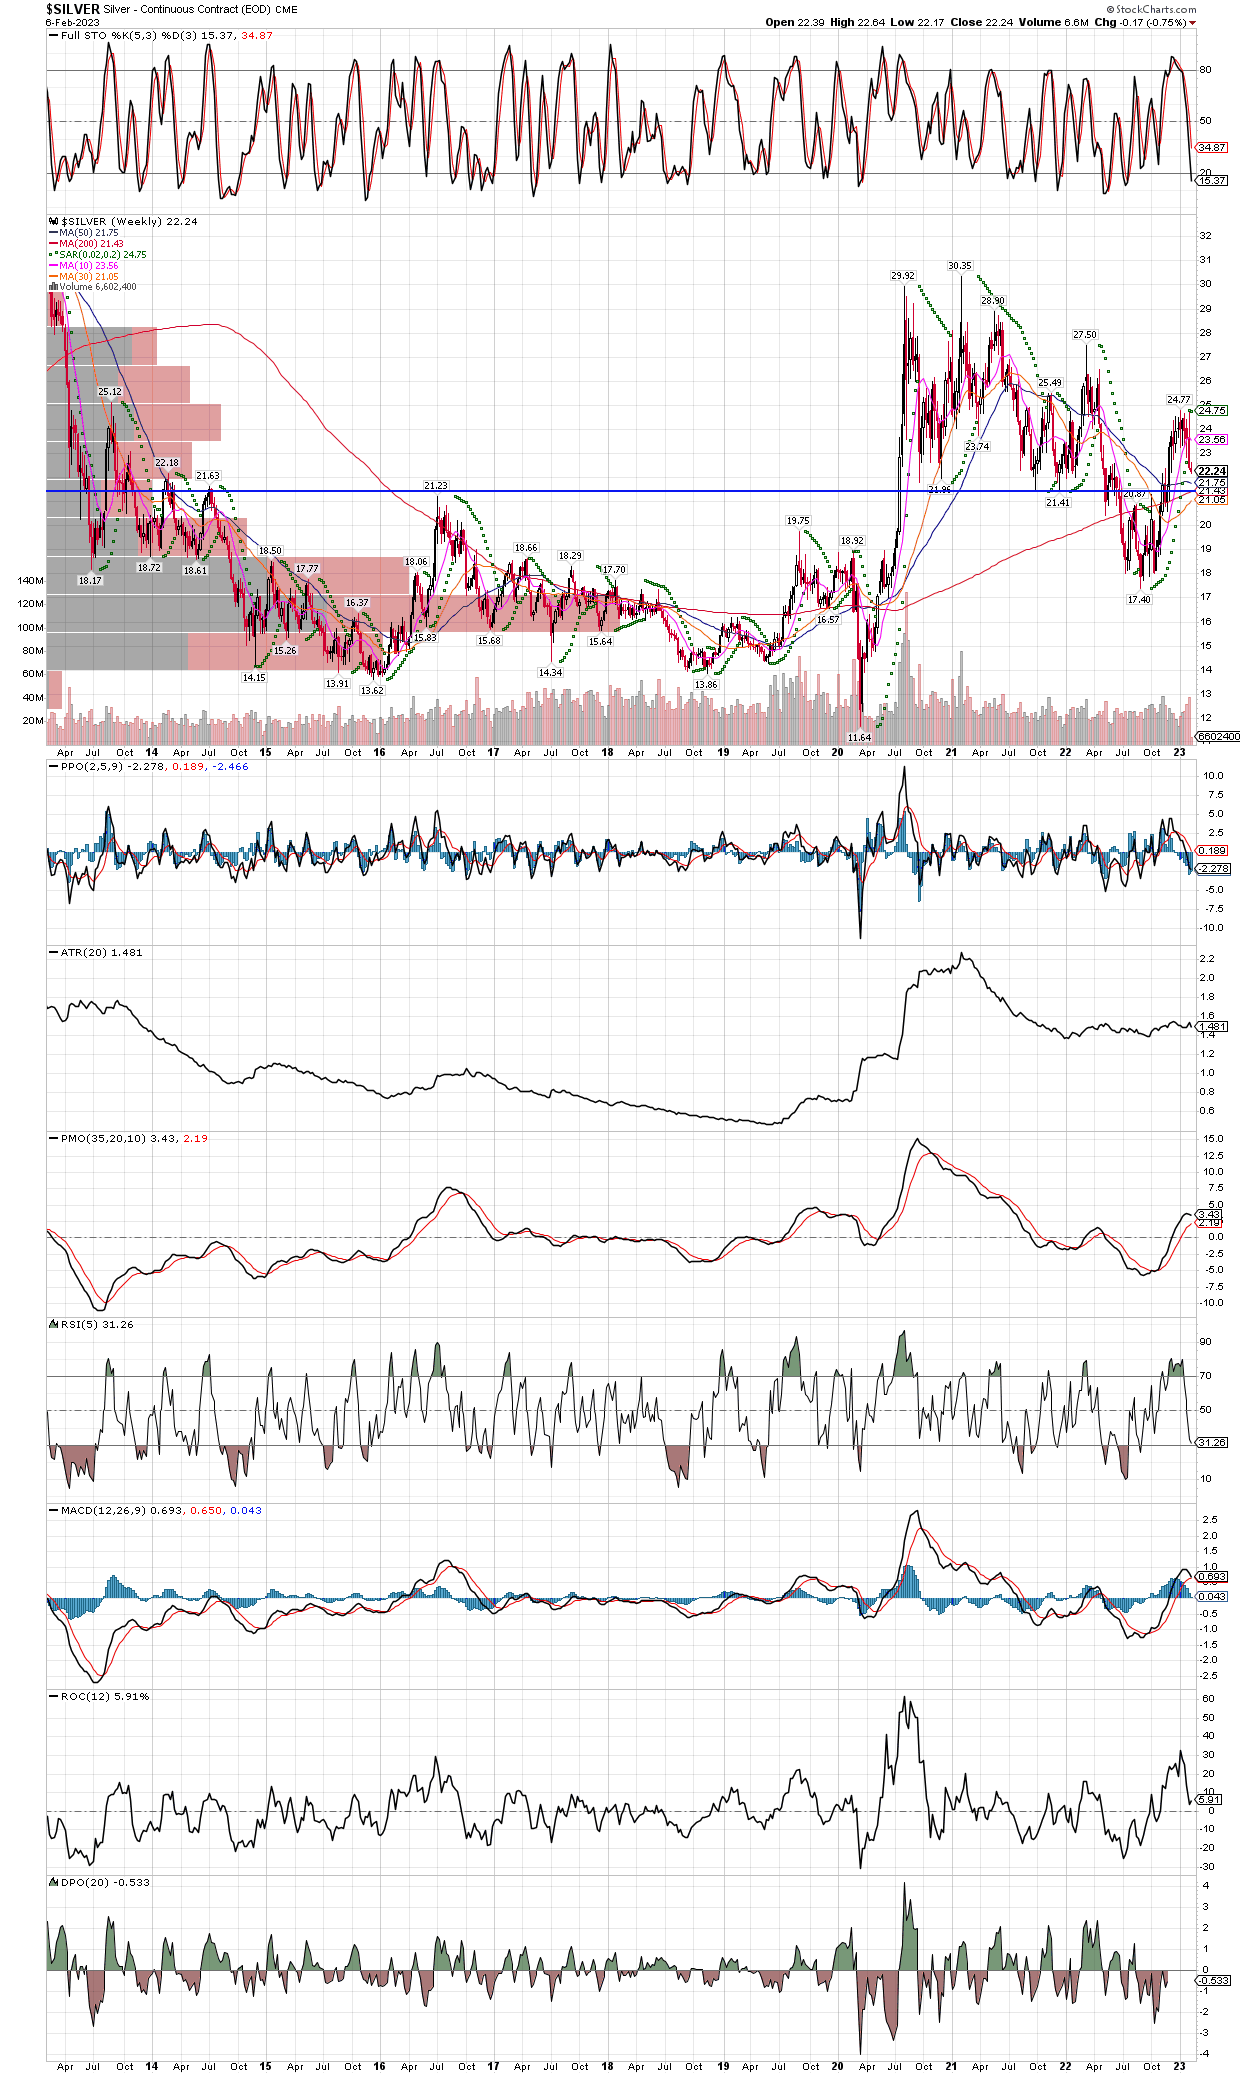
Just a quick wrap up after another down day in silver and the miners. I pulled up the weekly chart going back 7 years, and one can see the 2016 high around $21.25 and lows in both September and November all are in the same area as where the 200 WEEK MA currently sits (and the 50 WK MA as well). That is good enough for me, and I will add more heavily if silver gets down to my horizontal trend line, but since it might not, I added more shares to my miners today replacing some of what I sold recently.
If support on the weekly chart is reached, its only 75 cents below today’s closing price. Both the 200 WEEK MA and the 50 WEEK MA are a few pennies apart and should act as support, not far from the 2016 high.
As mentioned in prior posts, trend lines are highly subjective so should not be relied upon as the sole basis of buy and sell decisions, however they do give general areas that might provide support and resistance. Keep in mind this chart of SILJ is form Friday’s close, so using the last tick as the final connecting point is risky, we could easily see SILJ trade below my trend line, even down to the 200 day MA in the $10.27 area. Being miners are in an overall uptrend and have been the strongest performers over the last quarter, my bet is the uptrend will remain intact and that dips should be bought. We also woke up to news that Newmont Mining has made an offer for Newcrest at a roughly 25% premium to its closing price last week, so the biggest miners are still looking to acquire others. Interestingly, the media reports that this could spark more bids for Newcrest as the buyout offer is widely thought to be too low, all good news for the group as a whole. I began adding to positions again Friday afternoon before the close, in the miners I recently trimmed (sold 16% of holdings recently), and will continue to buy more as the intraday technical readings reach oversold on the 30 minute bar charts.
Bought some SILJ Friday near the close, and will add more this week in this area, and down near the 200 day MA if it can drop that far.