B2 Gold (BTG)
September 25, 2024
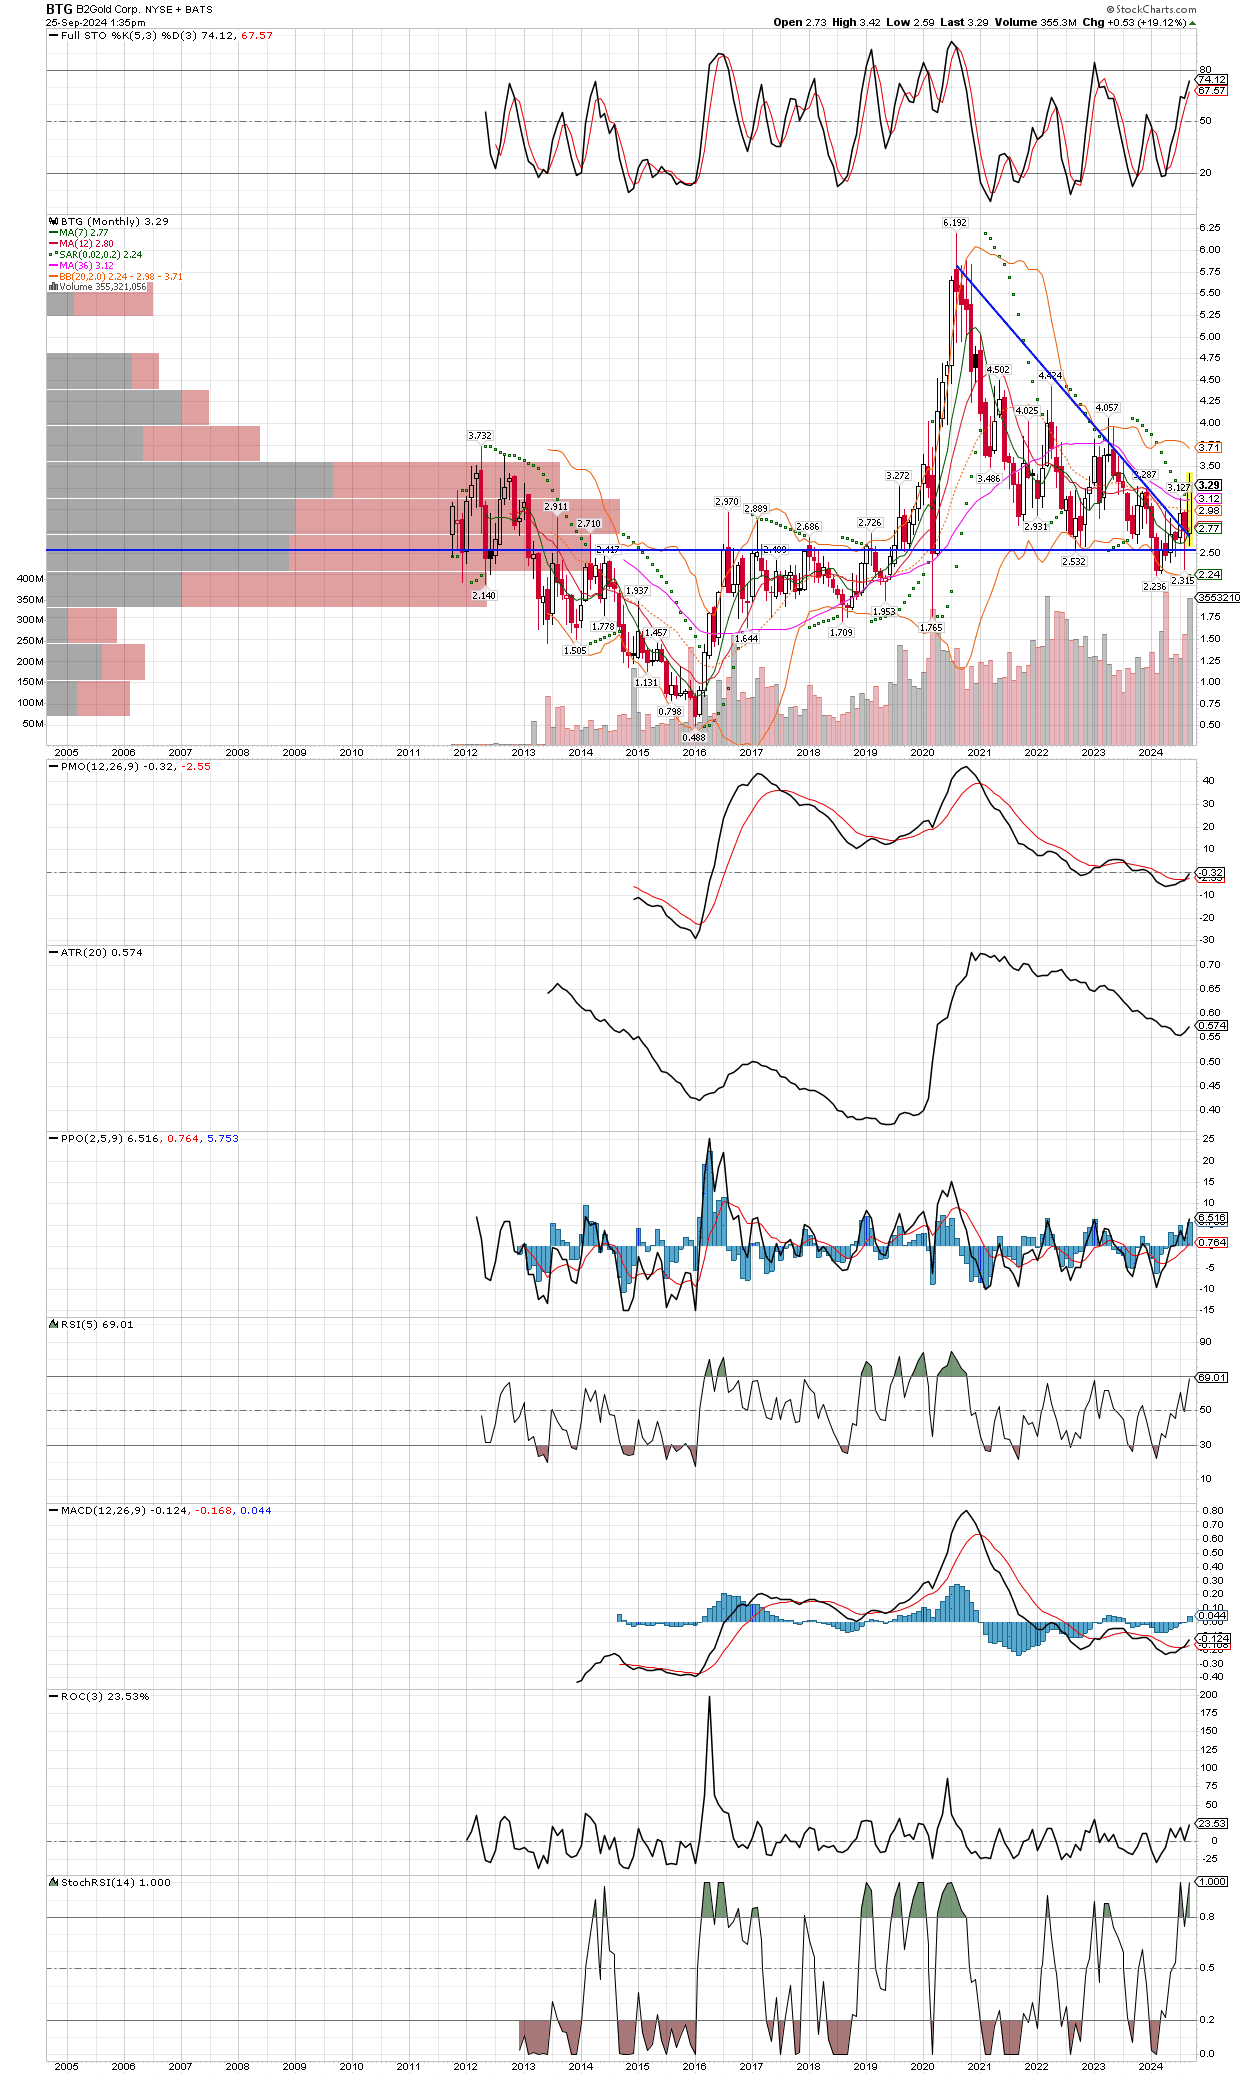
While I take most technical analysis with a grain of salt, especially my loosely drawn trend lines, I still find them useful to define areas of support and resistance. They are not lines in the sand, since they are quite subjective, people see what we want to see. But besides showing us general areas to watch, technicals can also tell us when big changes have occurred, especially when they occur on longer term charts, such as this monthly chart of BTG. From our entry price, its paying us a 6% dividend while we wait for price appreciation in this gold miner. The lines I’ve drawn were just thrown up quickly, but they show an area of long term support which has held, and now a sharp rebound that takes out the down trend line, indicating a change of direction longer term. Also note the MACD just turning positive, along withe the PPO crossing higher near the zero line, both signals that this stock wants to go higher for quite awhile. Buy on dips, and remember the time frame of the chart that gets you into a trade, this chart tells us to size properly for a multi-month hold at a minimum, likely much longer.

