B2 Gold (BTG)

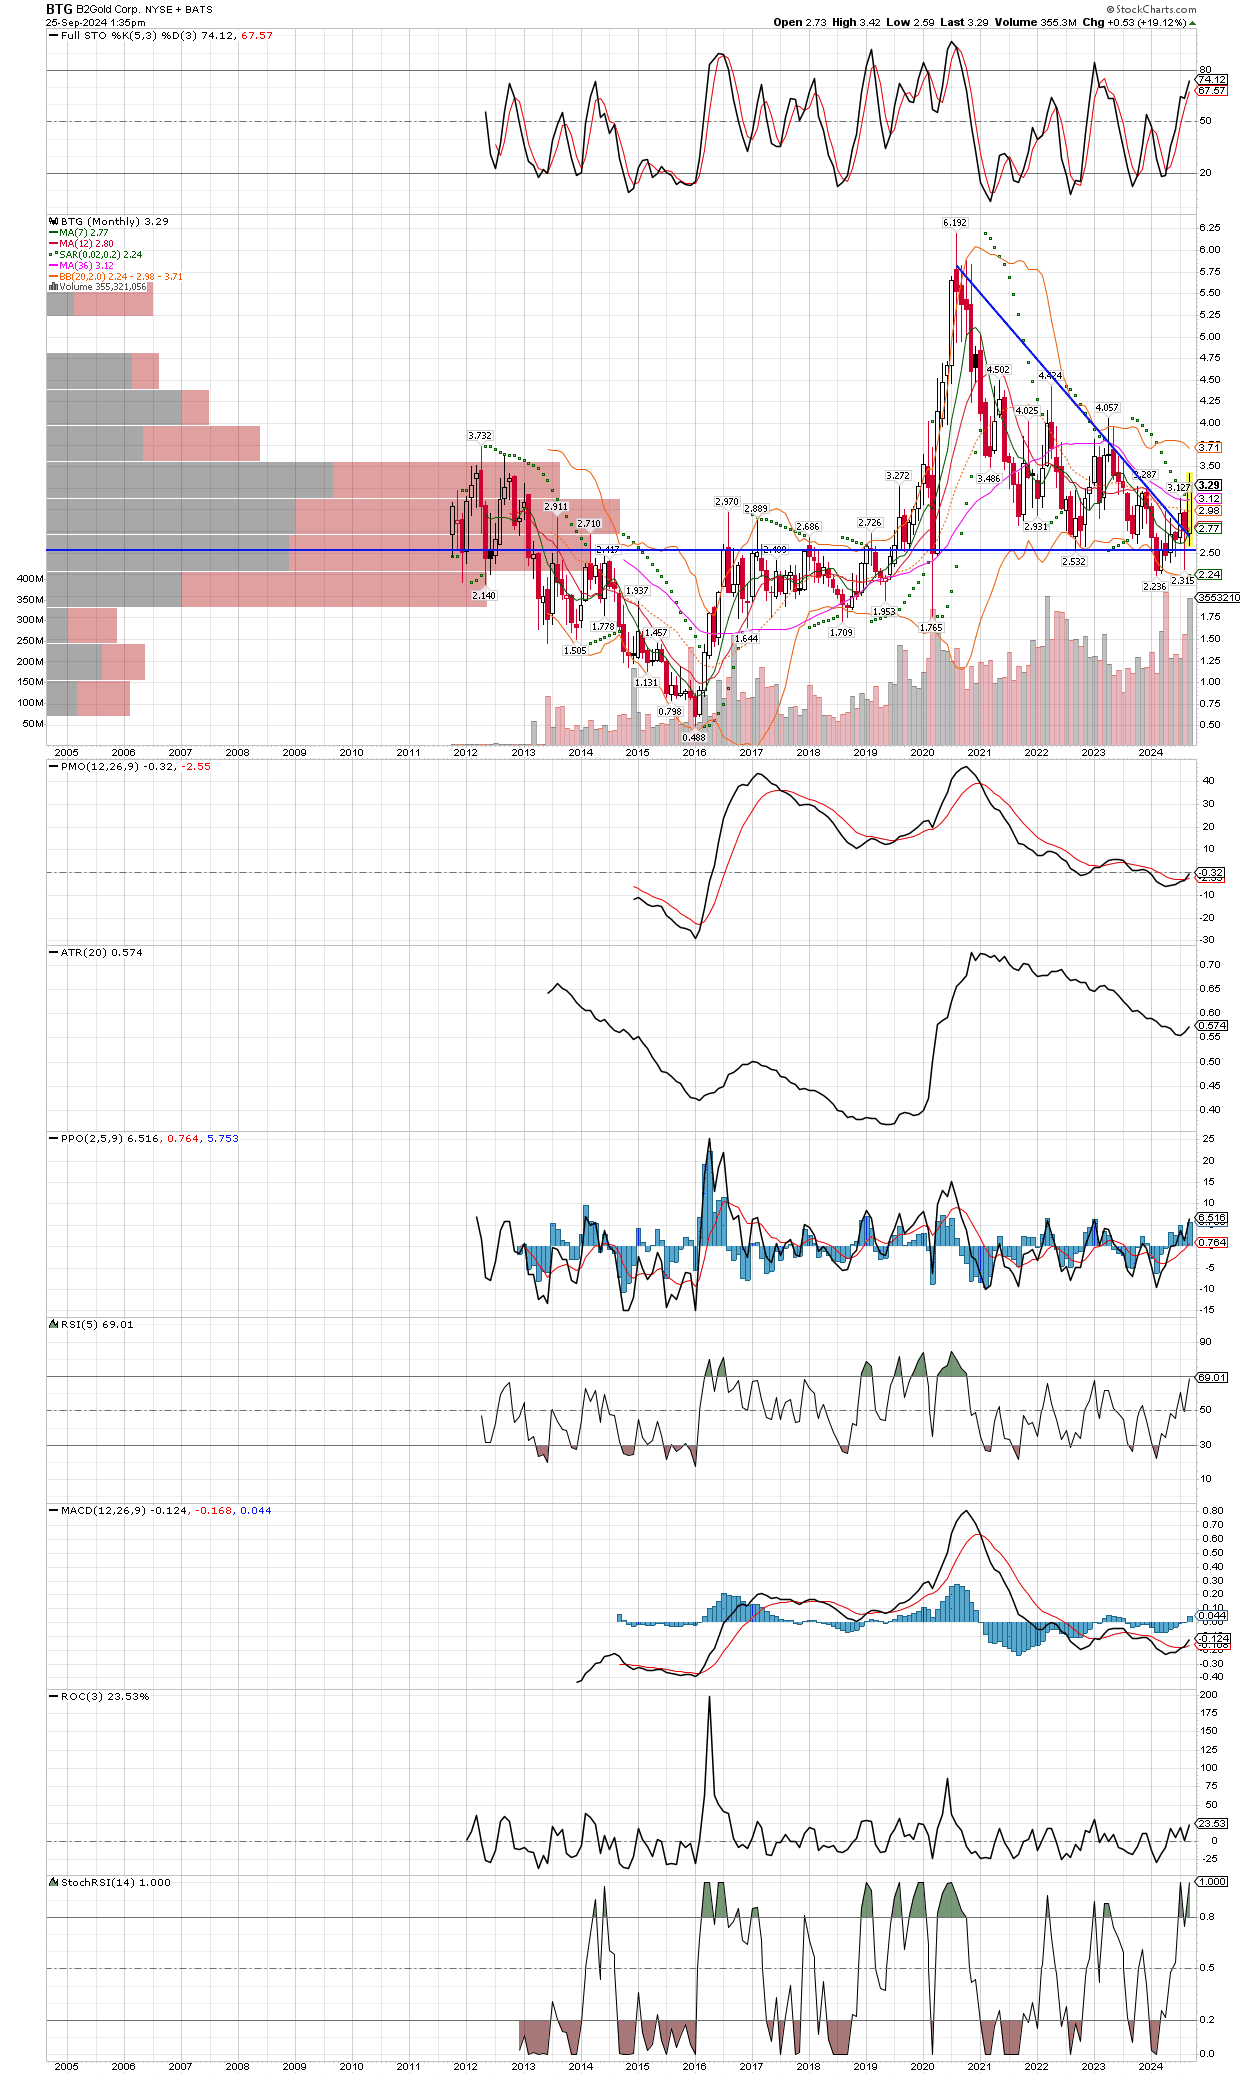
While I take most technical analysis with a grain of salt, especially my loosely drawn trend lines, I still find them useful to define areas of support and resistance. They are not lines in the sand, since they are quite subjective, people see what we want to see. But besides showing us general areas to watch, technicals can also tell us when big changes have occurred, especially when they occur on longer term charts, such as this monthly chart of BTG. From our entry price, its paying us a 6% dividend while we wait for price appreciation in this gold miner. The lines I’ve drawn were just thrown up quickly, but they show an area of long term support which has held, and now a sharp rebound that takes out the down trend line, indicating a change of direction longer term. Also note the MACD just turning positive, along withe the PPO crossing higher near the zero line, both signals that this stock wants to go higher for quite awhile. Buy on dips, and remember the time frame of the chart that gets you into a trade, this chart tells us to size properly for a multi-month hold at a minimum, likely much longer.

Breakouts All Over The Place As They Shovel Money Into Our Accounts As Fast As They Can!

I have been quiet lately, patiently observing the action in markets. I make it a point not to interrupt the process of traders shoveling money into our accounts as fast as possible. In fact, I often turn off the computers and go do something else for awhile, so I don’t get sucked into making calls day to day, or worse, convinced to sell to early. Today, I just wanted to re-visit the GDXJ monthly chart I posted back on April 14 of this year, not quite six months ago. It has clearly broken out of the triangle and is headed to the $63 area as a next potential rest stop, then onto new all-time highs up at $137. I know its hard to buy after such a sharp move higher, but if one isn’t invested in the precious metals and miners yet, there is still lots of upside to catch. Personally, I don’t like to chase moves higher because more often than not they will reverse. But the times prices keep marching higher are life-changing events, as compounding really starts to kick in!

I also want to point out that silver (using the SLV etf here), is very close to making new 11 year highs. About 20 cents more and it will be there. Silver is still a huge opportunity, it has yet to make new all time highs over $50/oz. Just reaching that level, which seems a given, is a 56% gain from where it sits today, and I expect it will blow by $50 with ease, could even get to $100/oz in the next year. I am not predicting such drastic gains in such a short time, but the point is that silver is going there sooner or later, and the fact this metal can move like a rocket when it gets going, implies the gains will come quickly once it starts. Don’t miss it, buy physical metal first, then miners for investment funds, and stay away from “paper” silver like this SLV etf altogether. If you have to buy silver in a brokerage account, then stick with something like PSLV, where they update ve with serial numbers on a regular basis. I am focused heavily on the miners at this point, and expect them to outperform by a huge margin.

SIGN UP FOR UPDATES

NO SPAM, EVER!