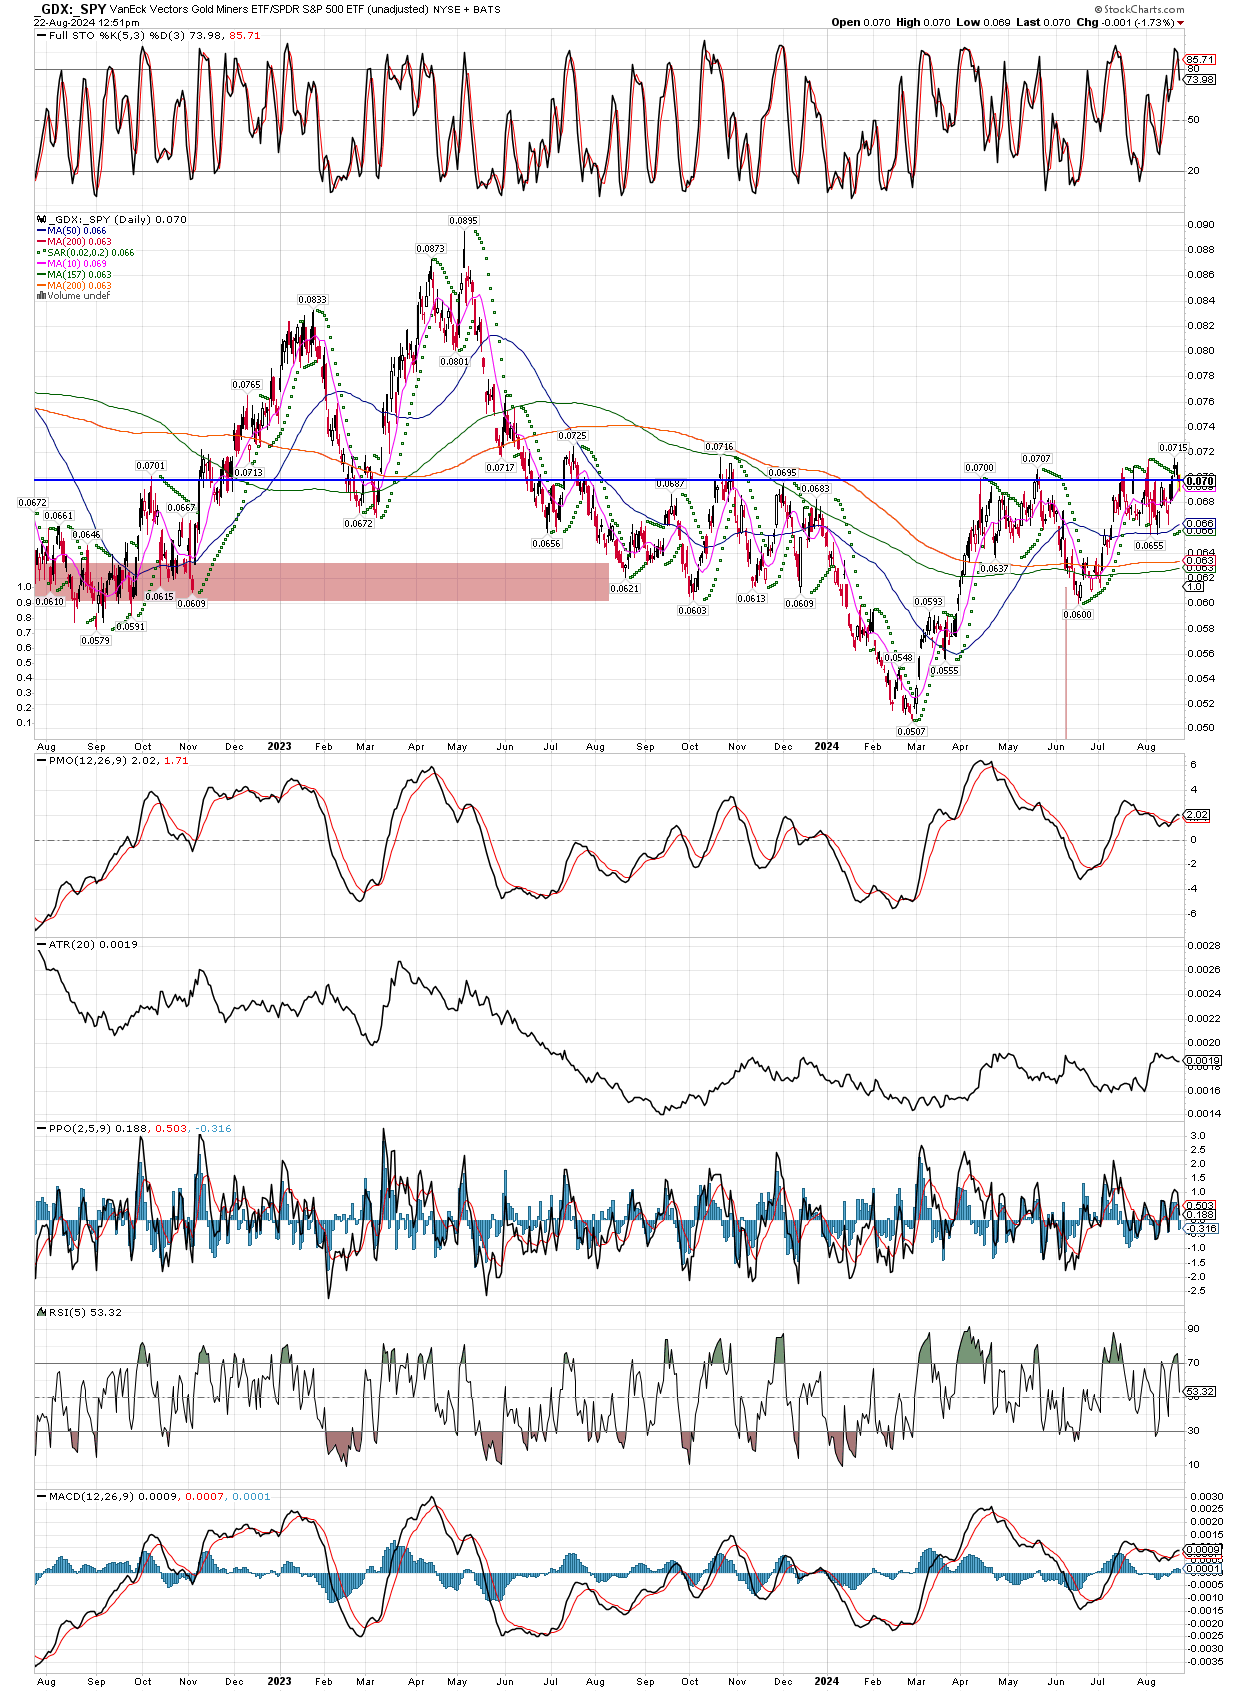
GDX vs. Spy Ratio Chart
August 22, 2024
Looking back a little over two years ago, we see the GDX vs. SPY chart showing an inverse head and shoulders pattern, and the ratio is trying to break above that horizontal line of resistance. I drew it loosely, because much of technical analysis is subjective, such as where to place a line, or which tops or bottoms to connect. In any case, it looks to me that the ratio is trying to work back up over my trendline, meaning gold miners should be outperforming the S&P 500 going forward. If the ratio can stay above that line, miners should outperform for more than a year, maybe two, as money flows out of the general stock market and into the precious metals sector.