Zooming In On the GDX vs. SPY Chart

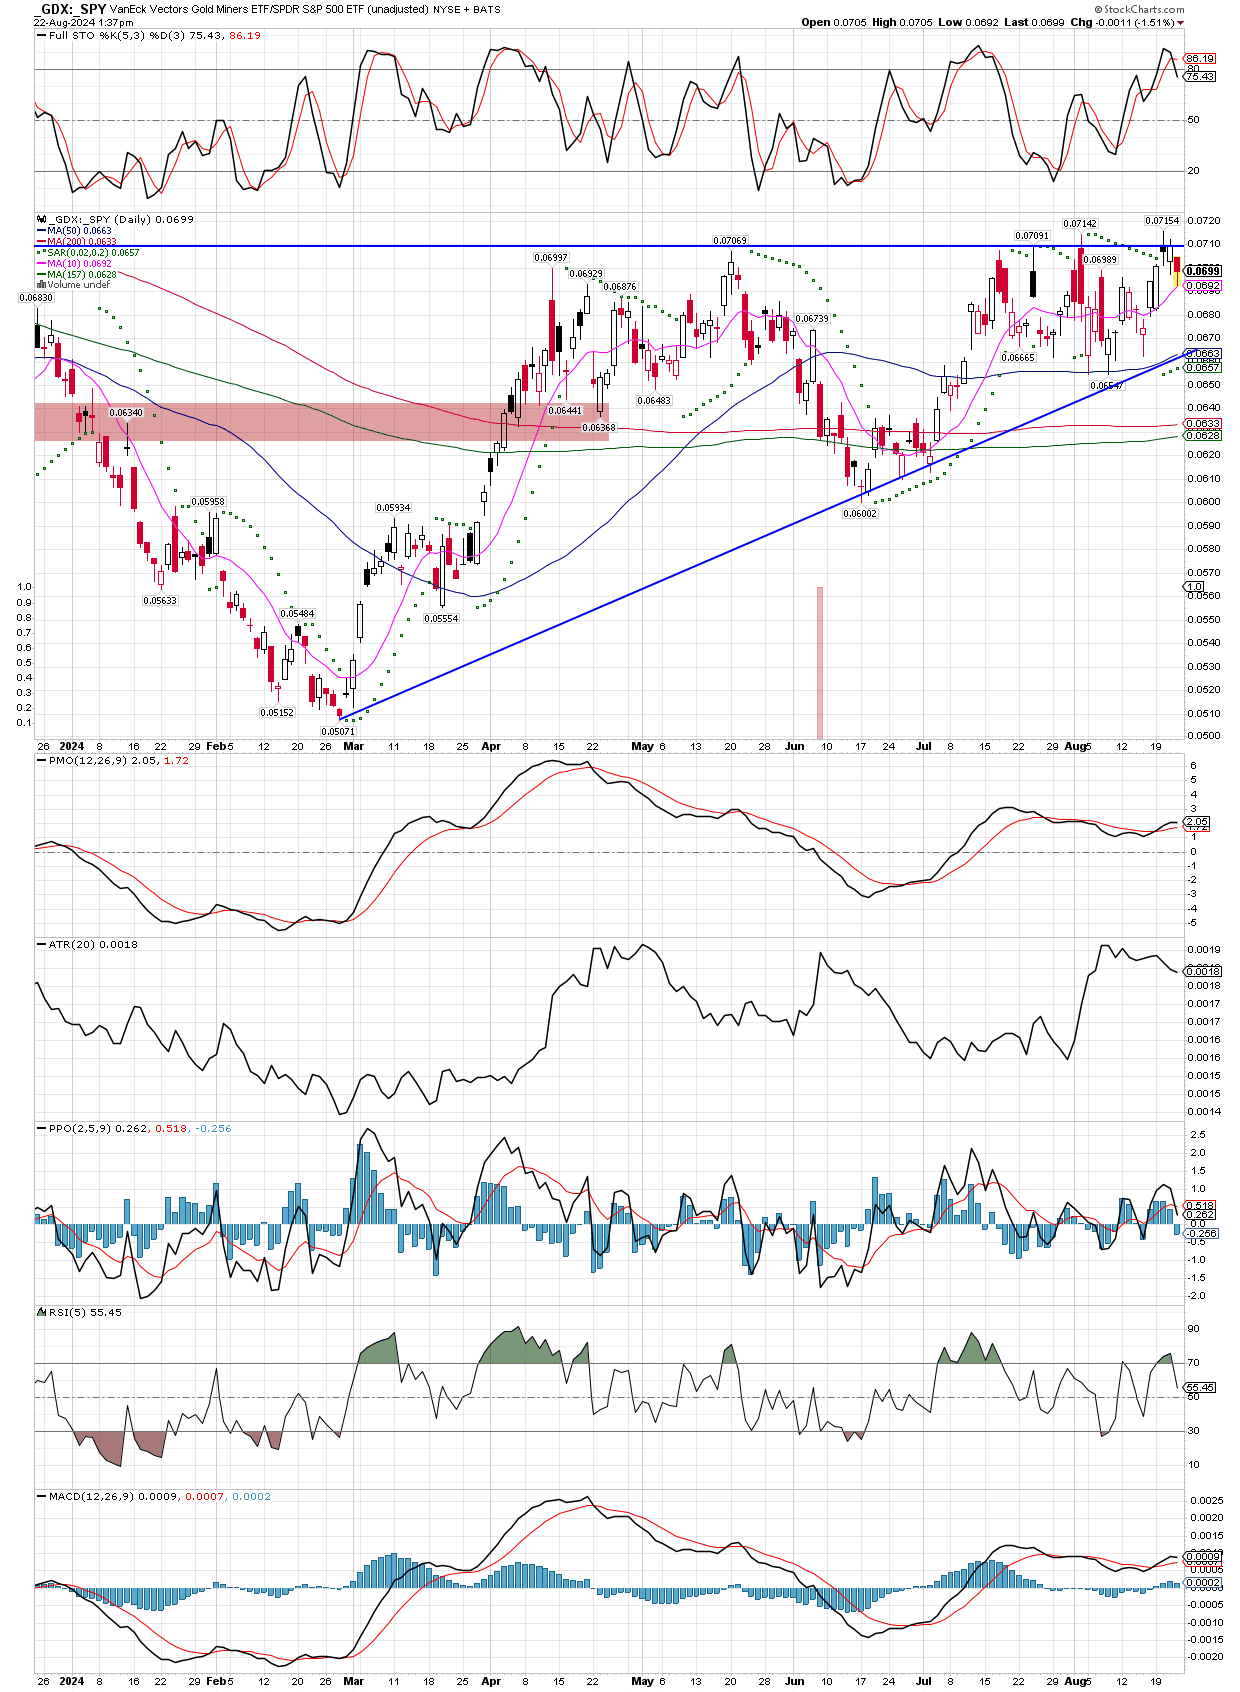
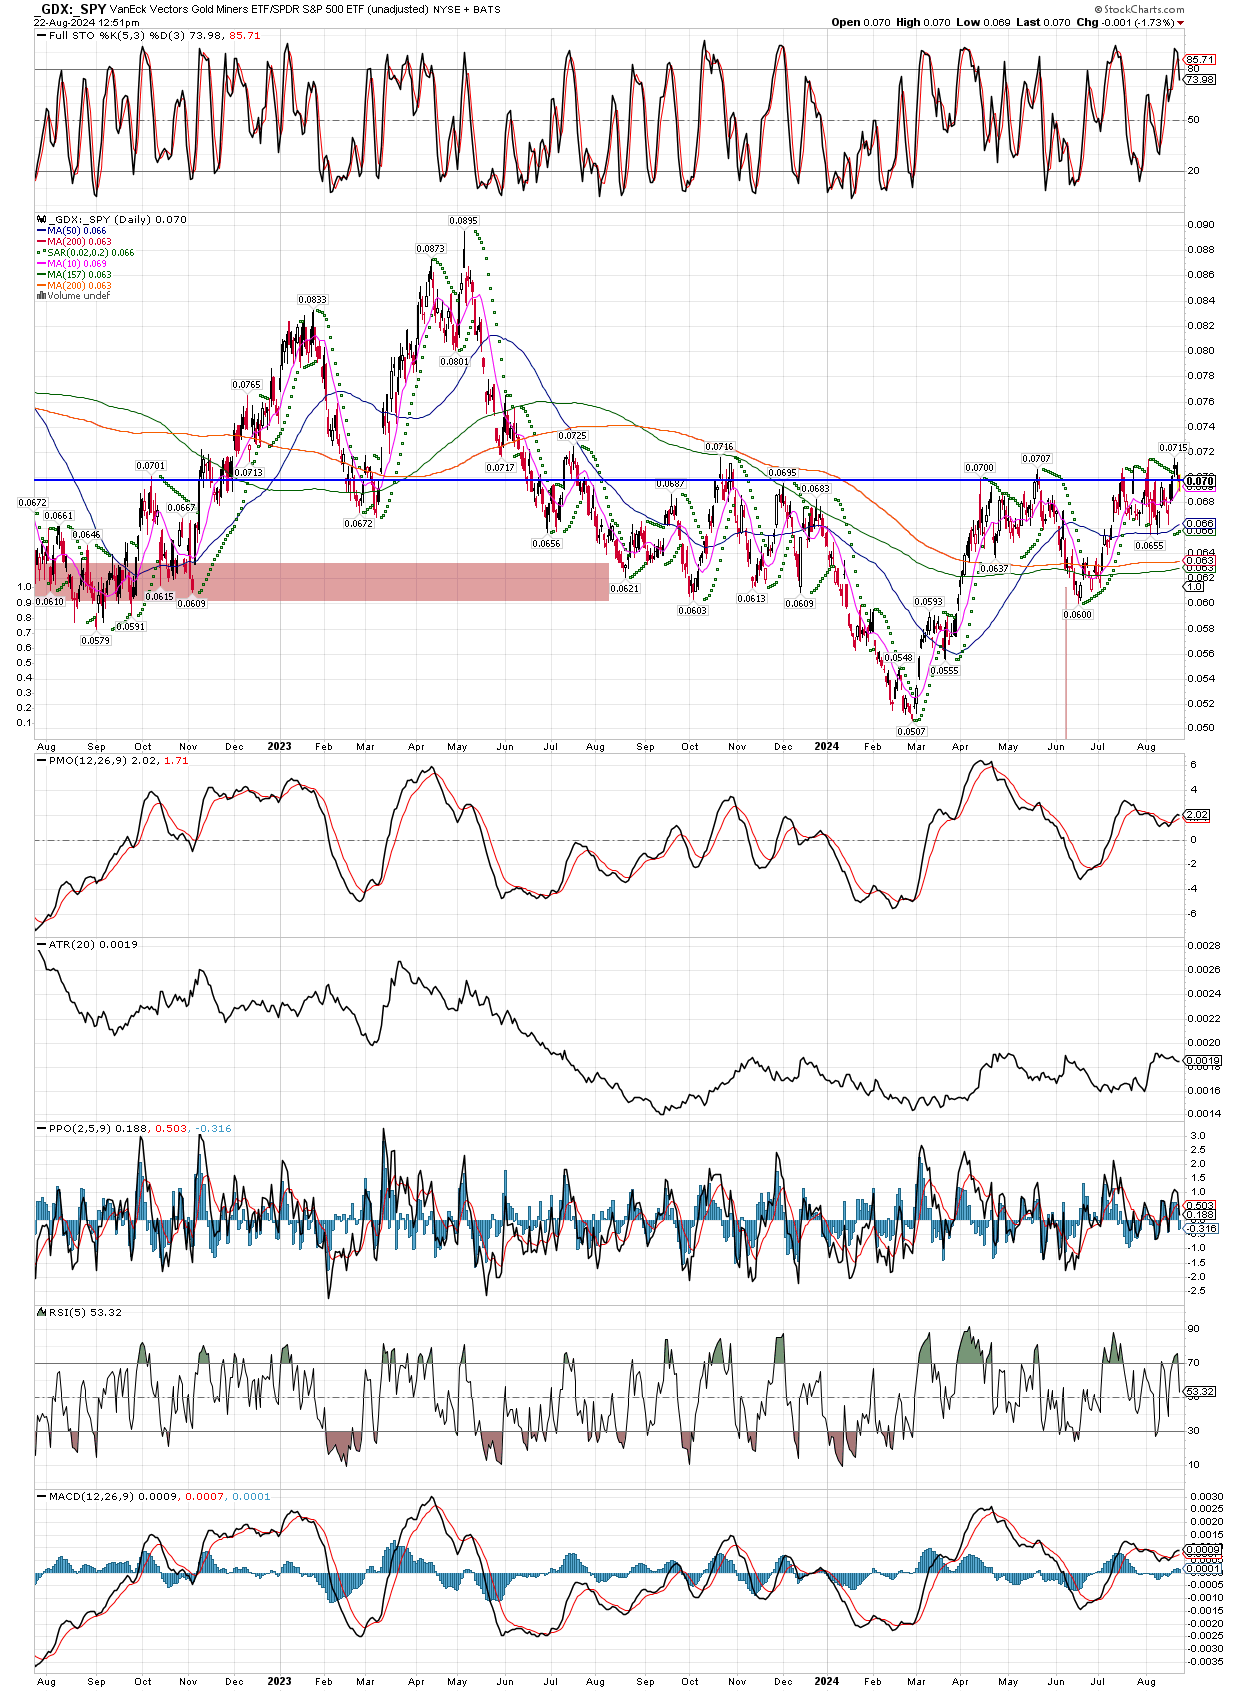
In this post let’s look at the DAILY chart of the GDX vs. SPY. Not only is the ratio in clear uptrend, we can also see it’s trading above all it’s moving averages, which themselves are beginning to turn higher. I put the horizontal trend line on the chart again, and its easier to see how close we are to a real breakout, confirming what the weekly chart suggested, that miners should outperform the general stock market for a long time once solidly over the resistance. The fact the moving averages are all just recently trending higher means we are near the beginning of something big.

GDX vs. Spy Ratio Chart

Looking back a little over two years ago, we see the GDX vs. SPY chart showing an inverse head and shoulders pattern, and the ratio is trying to break above that horizontal line of resistance. I drew it loosely, because much of technical analysis is subjective, such as where to place a line, or which tops or bottoms to connect. In any case, it looks to me that the ratio is trying to work back up over my trendline, meaning gold miners should be outperforming the S&P 500 going forward. If the ratio can stay above that line, miners should outperform for more than a year, maybe two, as money flows out of the general stock market and into the precious metals sector.

Classic Bull Market Shake-out In CDE

When I say sharp dips are to be bought, we can use a chart like gold and silver miner CDE to illustrate the point. Notice the violent bashing it took over just 4 days in the beginning of the month. Now, it has come back to where it was before the selloff, after rallying 43% the last two weeks. For those that had the nerve to buy or add to their positions, its a very nice return! This stock was the most glaring example I came across, but similar action was seen in many miners, so we added to several of our positions including CDE, SVM, HL, EQX, EXK, BTG, and a few others.

GDXJ Weekly Chart

The junior miners, as represented by the GDXJ etf which is really a fund of mid-cap miners, is nearing breakout levels. This chart goes back over three years, and GDXJ isn’t far from taking out the high made in April 2022. This stochastics cross higher has seen a launch in prices, suggesting very strong underlying momentum. Be long, hold strong, buy any sharp dips, and don’t expect them to last very long in this type of action.

HUI Index Weekly Chart

Next stop appears to be 338.04, then the 2020 highs up around 374. Many stocks are making new bull-market highs, like NEM and GOLD, but also some mid-caps like SA, and smaller caps like JAGGF, which has rallied 50% in just seven trading days. GDX is only 20 cents away from making a new 52 week high, this is the stuff of which bull markets are made!

In bull markets, dips are to be bought. Get long and hold, proper position-sizing relative to one’s risk tolerance will allow them to stay on the bull.

SLV Weekly Chart

Another Look At Silver Weekly Chart

Stepping back to get the bigger picture, this SLV chart goes back 8 years, the horizontal trend line is my doing. While I don’t trade in or out because of trend lines, mostly because I feel they are more loose areas than lines in the sand, I still find them useful to identify areas where something might find support or resistance. Seeing SLV oversold on the weekly stochastics, combined with coming into a range of possible support going back many years (it was past resistance), helps one pull the trigger.

Bought Silver Futures Today-December Expiry

Bought 3 contracts of the. SI futures December expiry at average price of $28.08. However, below I posted the more active September contract. You can see that stochastics on both the daily and weekly charts are oversold, and silver looks to have pulled back into an area of possible support, after a near 20% correction, all good enough reasons for me to buy here. While the weekly shows a further 40 cent dip to the trend line is possible, more so with the metal coming into support at it’s 200 day MA. If we see silver pull back another 40 cents or so, I will use that a an opportunity to add to the position. On a side note, the Chinese continue to buy silver hand over fist, as reported here https://twitter.com/oriental_ghost.

The weekly ATR (average true range) is $1.82, which I will use as a general area to stop out, so the $26.26 area on the December contract. Keep in mind its trading at about a 40 cent premium to the September contract. So if I had bought the September futures, my stop would be about $25.88.

SIGN UP FOR UPDATES

NO SPAM, EVER!