The Significance of June 13

Historically, on average June 13 (today) is the low for the year in the precious metals miners. Since the miners were much lower in March than where they sit now, today can’t be the low, its either behind us or still in front of us. Either way, the plan remains the same. I’ve posted a couple charts below of stocks I am adding to positions, I really like BTG’s 6% dividend. I also started a fresh position in July Wheat futures (ZW), as you can see it has pulled back to some important moving averages and is oversold on stochastics, after a recent Donchian breakout in late May. I paid 620.00 per contract, and like that I can maintain a tight stop just below the 30 WK MA, limiting our risk.

Charts Of Interest

First is the SLV:GLD ratio, rebounding hard out of the support zone. As this chart trends higher, it reaffirms the bull market is underway. Oversold stochastics suggests this ratio has several more days upside, at least.

Next, we have the GDX daily chart, where I have measured the distance from the 200 day moving average thus far in this bull market. There is no way I will sell anything unless the GDX is at least 50-60% above it’s 200 day MA, as this typically is when the miners take a more significant break in their upside move. Until then, dips are to be bought, I don’t try to avoid them by selling and trying to buy back in at cheaper prices, because that is how one gets left behind.

Now for the SLV daily chart. We see the oversold stochastics again, accompanying this sharp rally, pushing SLV back over its 10 day MA. It’s a sign that this pull back might have already ended. If it has, great because we added to many positions over the last few days, and it it isn’t the near term end of the correction, we will get a chance to add some more. However, bounces out of declines with this much force should not be ignored. Just like that, silver is only about $1.50 from new bull market highs, after taking out long held resistance. Note that it also bounced out of the new support area, which is the old resistance area.

Correction Time Is Here

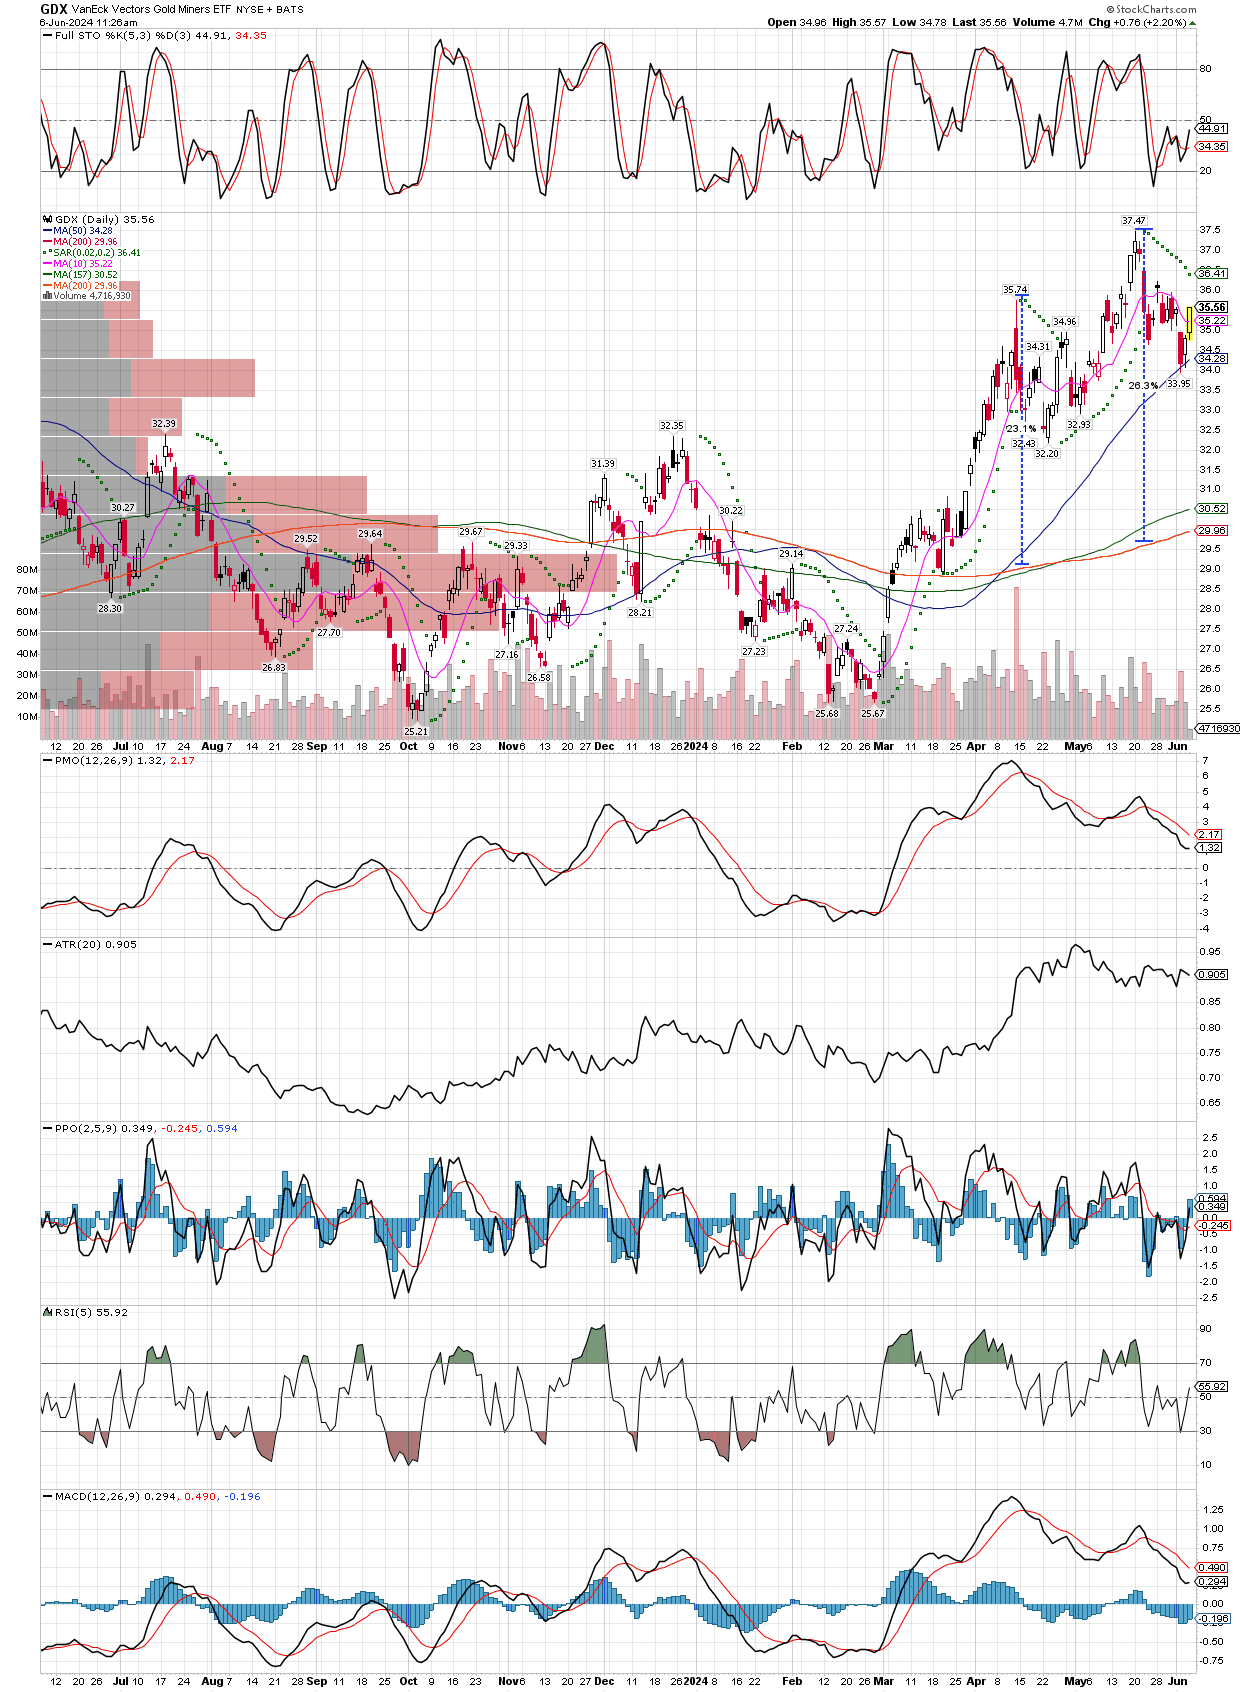
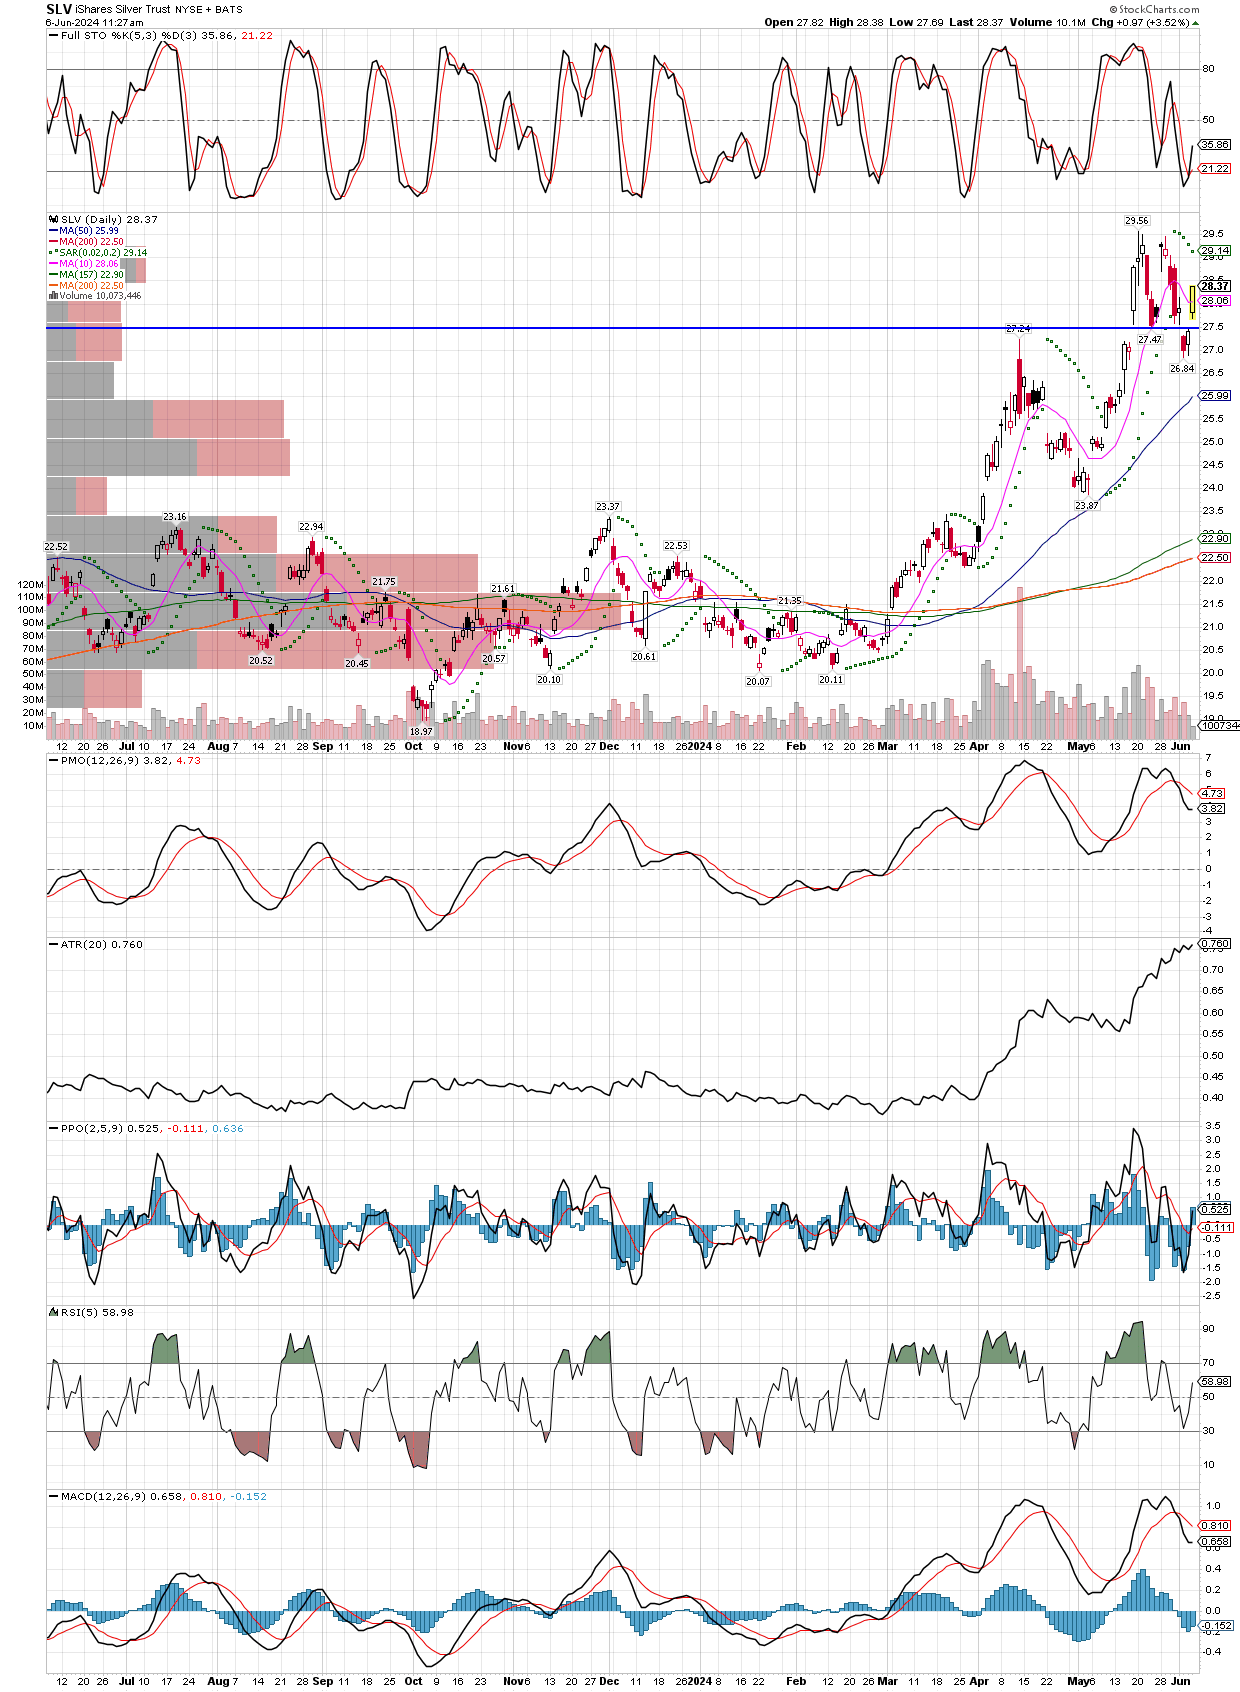
The last few days have seen the metals and their miners pulling back to their 10 week MA’s. For example, SILJ and Silver futures have both retreated around 10%, while some miners have had sharper corrections.

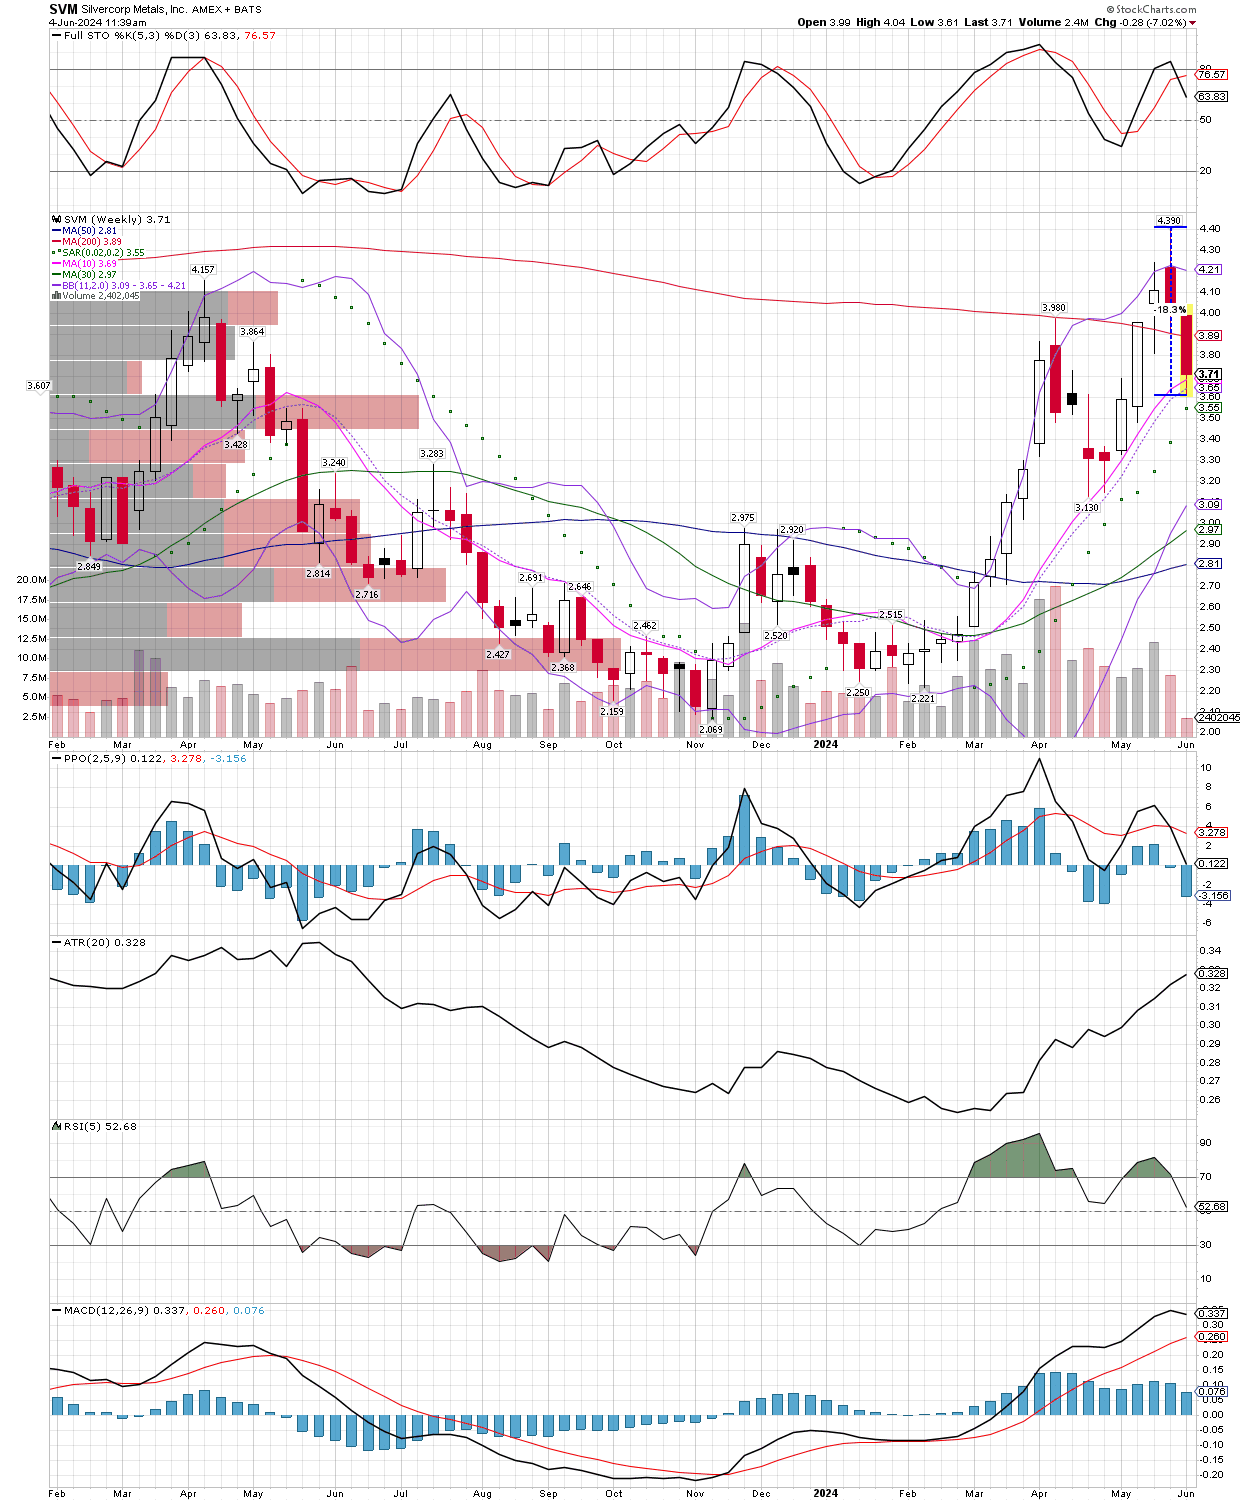
Now that the correction is here, the only question is how will you play it? Some weaker bulls, many of them late buyers into the runup, will be inclined to sell as they didn’t see enough gains to be able to hold steadfast into a decline. For those that bought in at much lower prices like we did, I am taking advantage and doing some moderate buying today, adding to various miners and the SILJ etf at their 10 week MA’s, which seem to get respected in a verified bull market. For no other reason than I just had this chart up, I decided to post SVM (Silvercorp), which I am adding to now, as the charts shows it’s already corrected around 18%. Can it go lower tomorrow? Yes it can, but more often than not, buying a stock that is in a bull market and has dropped 18% back to its 10 week and 50 day moving average, is a high probability bet.

Regarding other commodity groups I am watching with interest, such as copper and base metal stocks, they have also experienced decent-sized corrections. It will be interesting to see if they can hold, then turn higher from these levels, or if the weakening economy drags them lower. Energy is another group I am curious to see how it holds up, as its been relatively weak in the commodity arena. Are these rolling over, the XOP and COPX, or are they presenting an opportunity to get on the bull train again? We will know soon enough, but for now my focus continues to be on precious metals and their miners, as they can go up, in fact should benefit, from a weakening economy and stock market.

SIGN UP FOR UPDATES

NO SPAM, EVER!