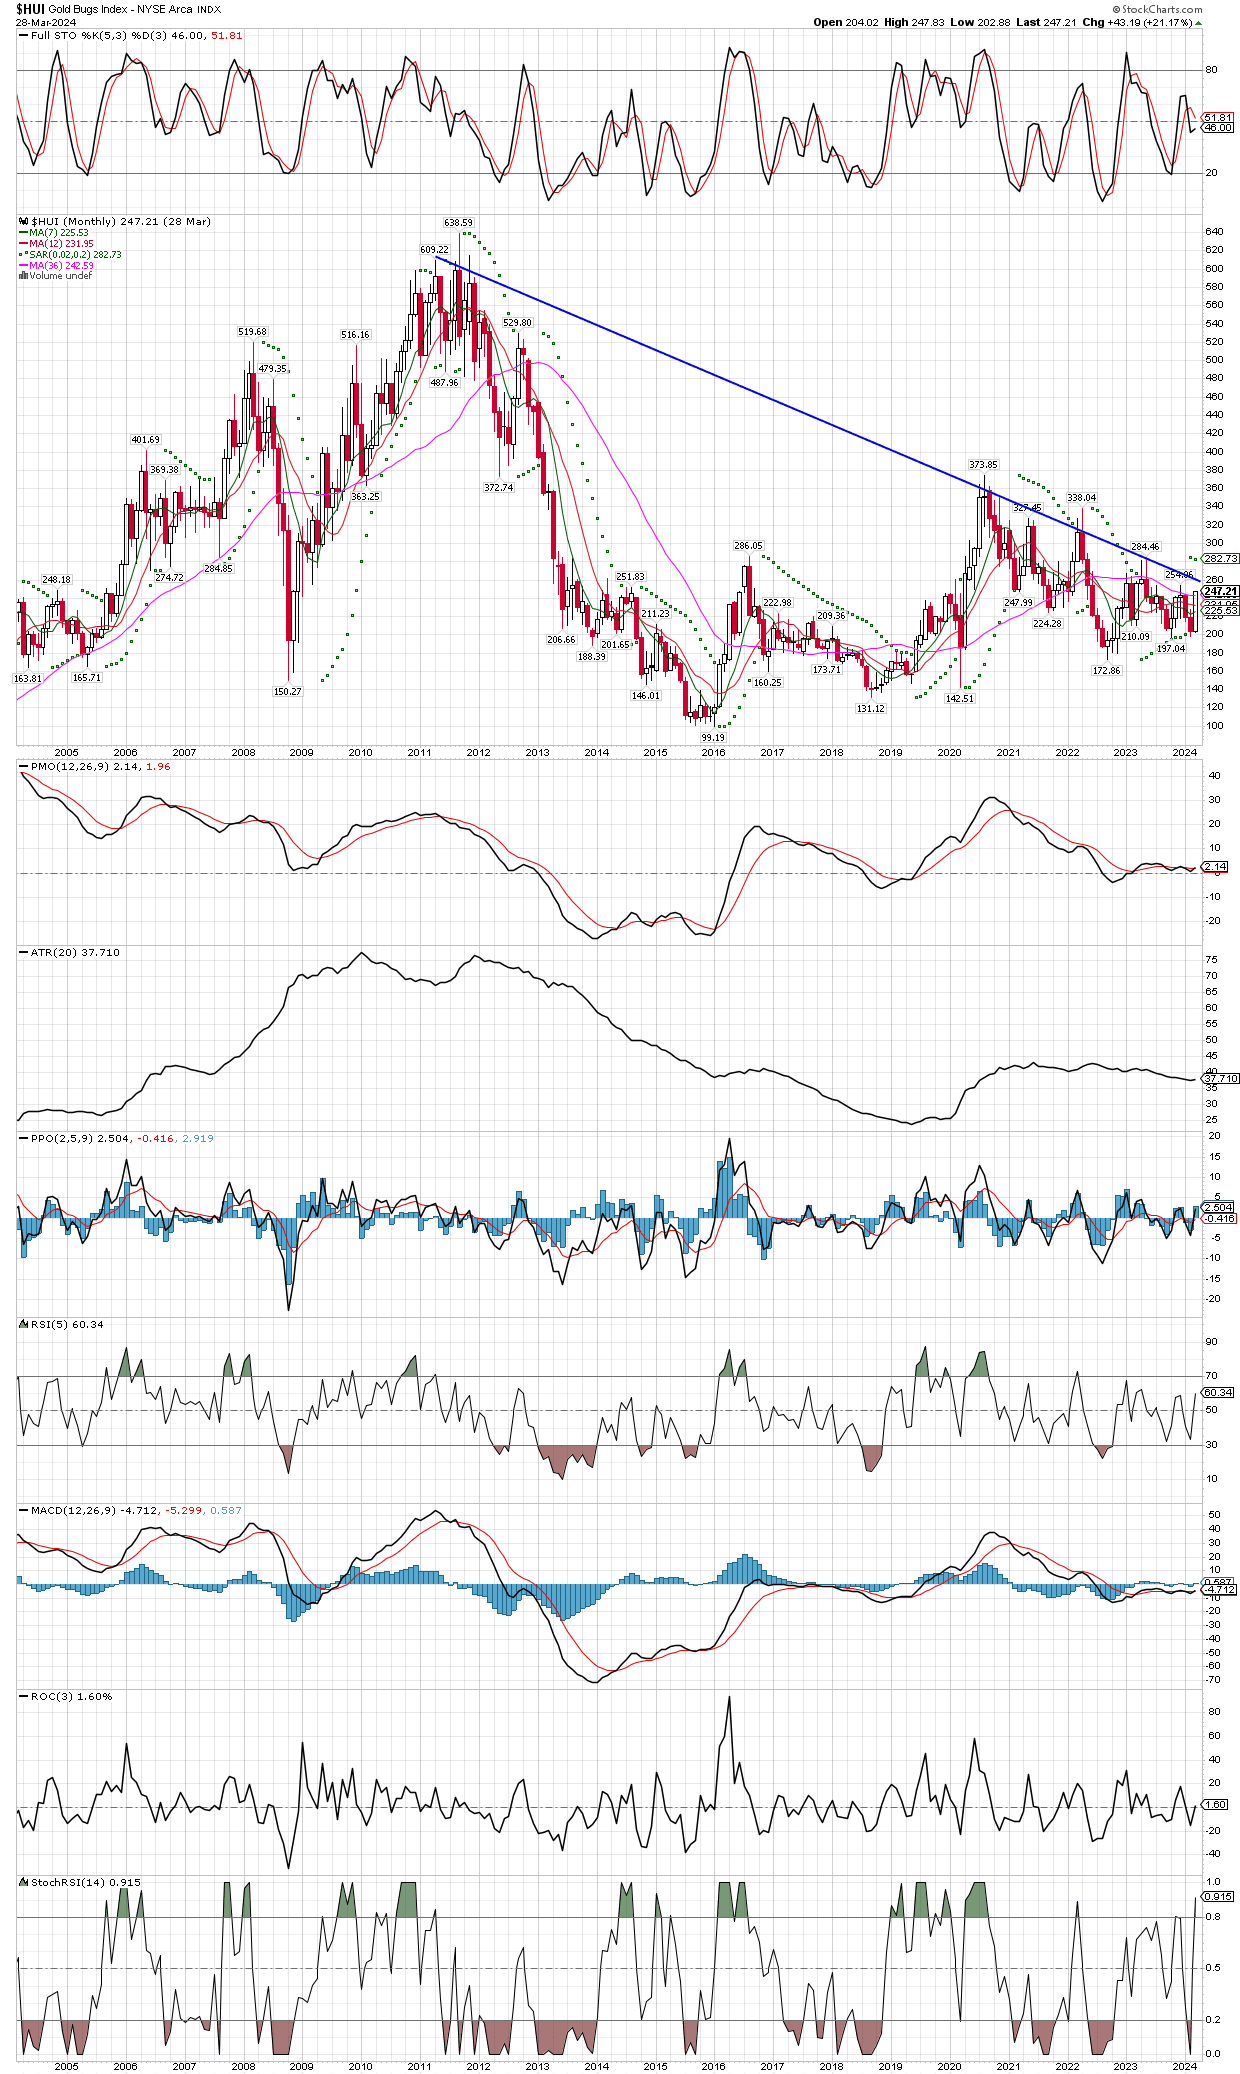
$HUI Weekly And Monthly Charts
March 29, 2024
The $HUI gold miners index shows lots of potential upside, once it can get back over it’s 200 week moving average in the 257 area. A move just back to the 2020 highs would be 51% from Thursday’s close, and seems highly likely to me. From there, if miners and metals can continue making new highs, we should expect to see the highs on the monthly chart taken out. The down trend line on the monthly chart, no matter how its drawn (bars to bars, or wicks to wicks), illustrates how important this current area is, with a move above 260 or so on both charts having big implications for the upside potential and probabilities. Testing the monthly chart high made back in 2011 would be 158% gain from yesterday’s close of trading, and that is just the bigger miners, the mid-caps and juniors should double those returns or more.


