The Weekly Charts Are Really Starting to Shape Up
March 24, 2024
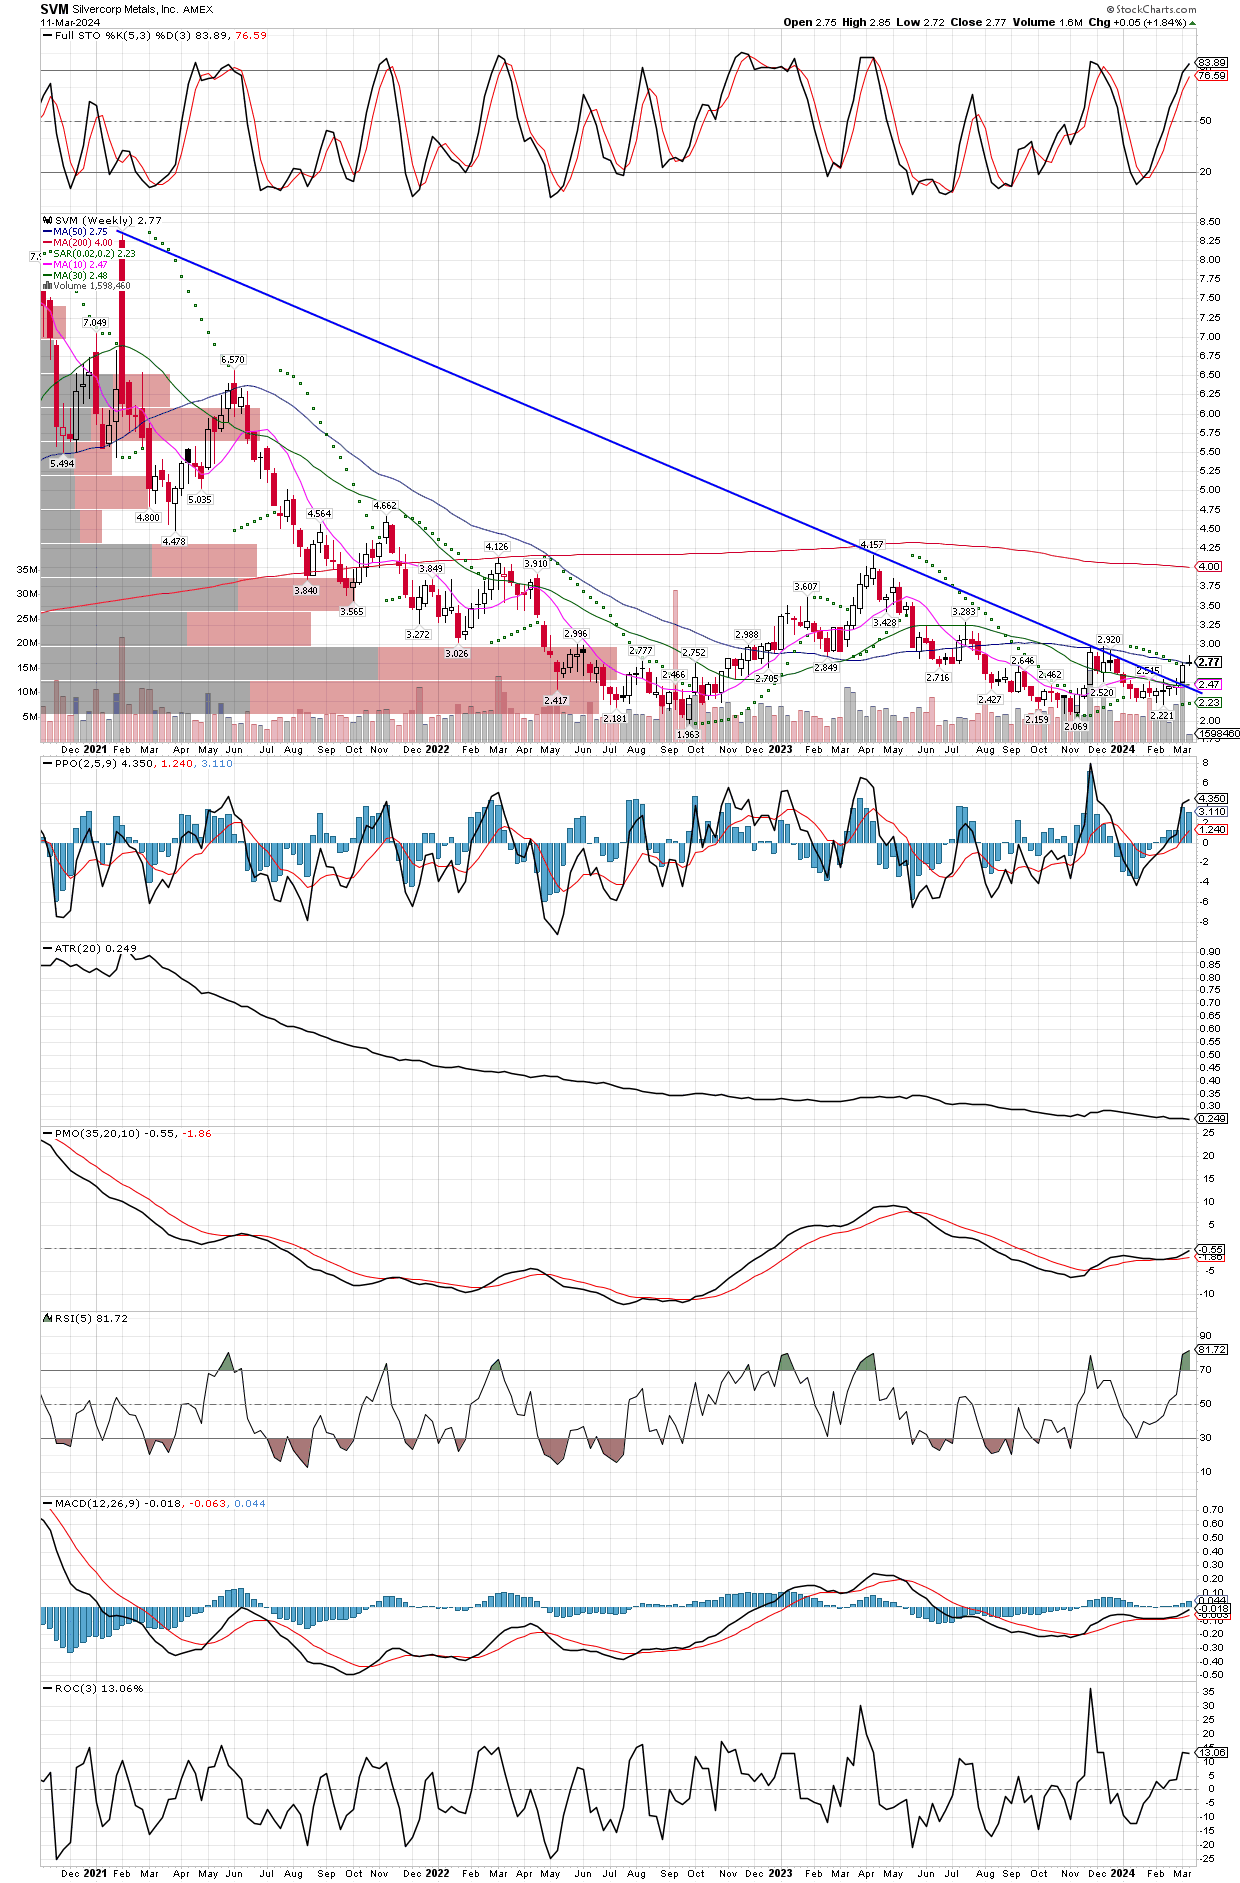
There are many similar charts across the precious metals mining group, today I just picked two that seem notable, but most of them exhibit similar developments. First, SVM appear to have broken its long downtrend, the next step is to start a sustainable uptrend, which I am confident it will.
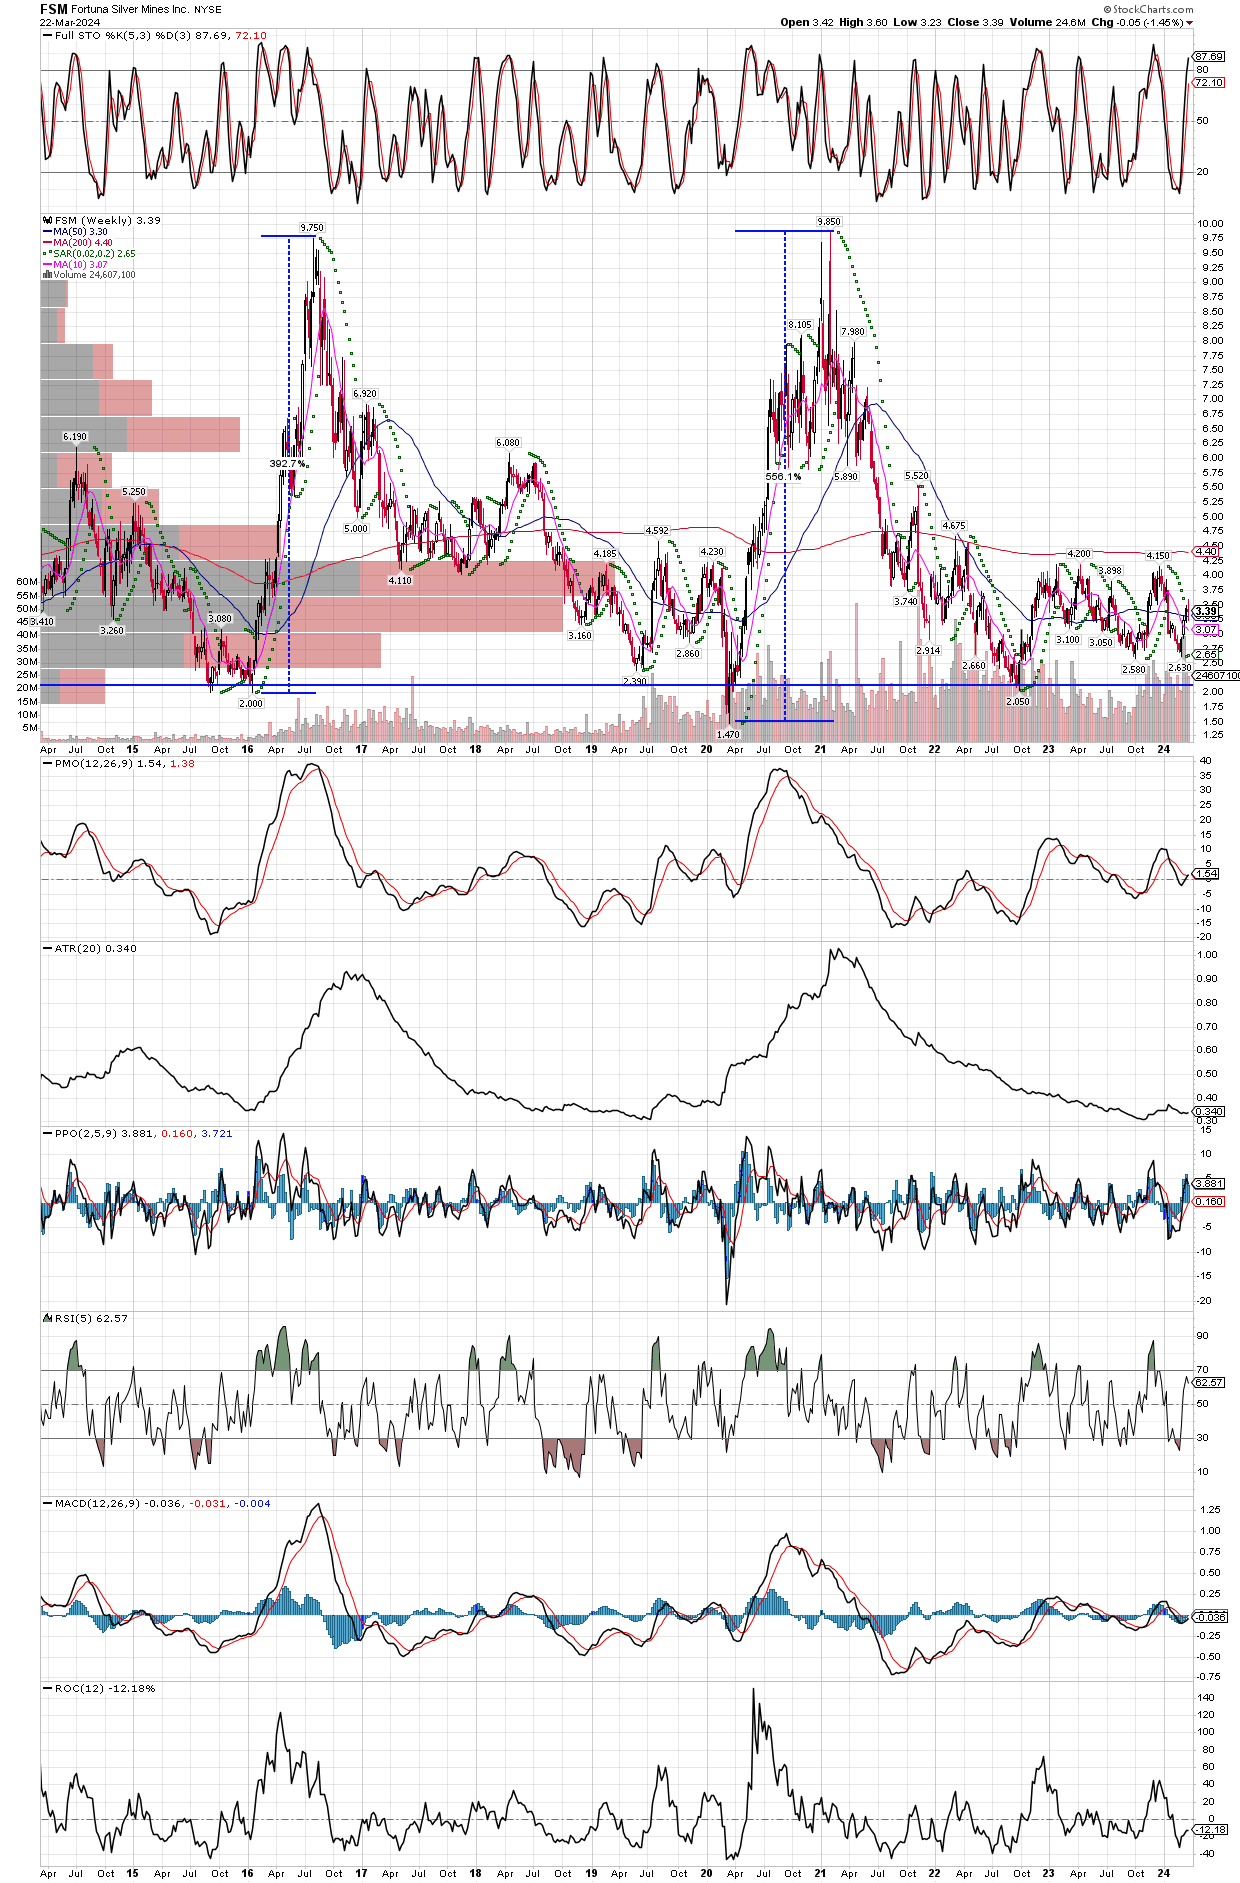
Then we haver FSM, going back even longer we see the general support area where it seems to always get a good bounce, and more interesting, about every four years its not just a bounce, but a 400-600% run to the highs in short order. Furthermore, this last trip lower towards the trendline, FSM wasn’t able to make it all the way down there, suggesting the path of least resistance is higher. I am looking for this miner to take out it 200 week MA (the red line above current price, which would be a nice gain in itself), for a sign that the stock is again headed up to test its all time highs. That would put another 500% or so gain on the board, and the gains happen very, very quickly, one has to be in them BEFORE the move starts, because they become quite difficult to buy once moving, and especially in big size, since they can have 10% drops overnight here and there along the way to making those stellar gains. I will add to both of these miners, and many more, into good sized pull backs that bring them down to their 10 WEEK MA’s, or near their 50 DAY MA’s, or 200 DAY MA’s, all over which are good enough areas to add.


