Commodities Bull? Buying Natural Gas After a 70% Decline
January 23, 2023
I believe we are in a commodities bull market, but am not sure of the term used so often lately by others, that we are in a “supercycle” for hard assets. On the one hand, the unmitigated money printing reeks of end of empire, and during economic collapses the only thing to own are tangible products, of which natural gas is one. In addition, the decreasing supply due to restrictions on drilling, cancelled pipelines, etc. should put upward pressure on prices. However, there is a trade off to be considered. Unlike gold and silver which can rise during periods of economic uncertainty, most commodities suffer downward pressure on pricing due to vanishing demand. This makes it a tug of war to determine which way things like energy and base metals prices will go, shortages and more currency units pressure prices higher, as the slowing economy crushes demand. Since I think we are already well into a recession (don’t wait for the government to admit it, by then it could already be on the mend, or a full-fledged depression), I have maintained heavy positions in precious metals and miners, as they should hold up better than everything else, even make good gains forward.
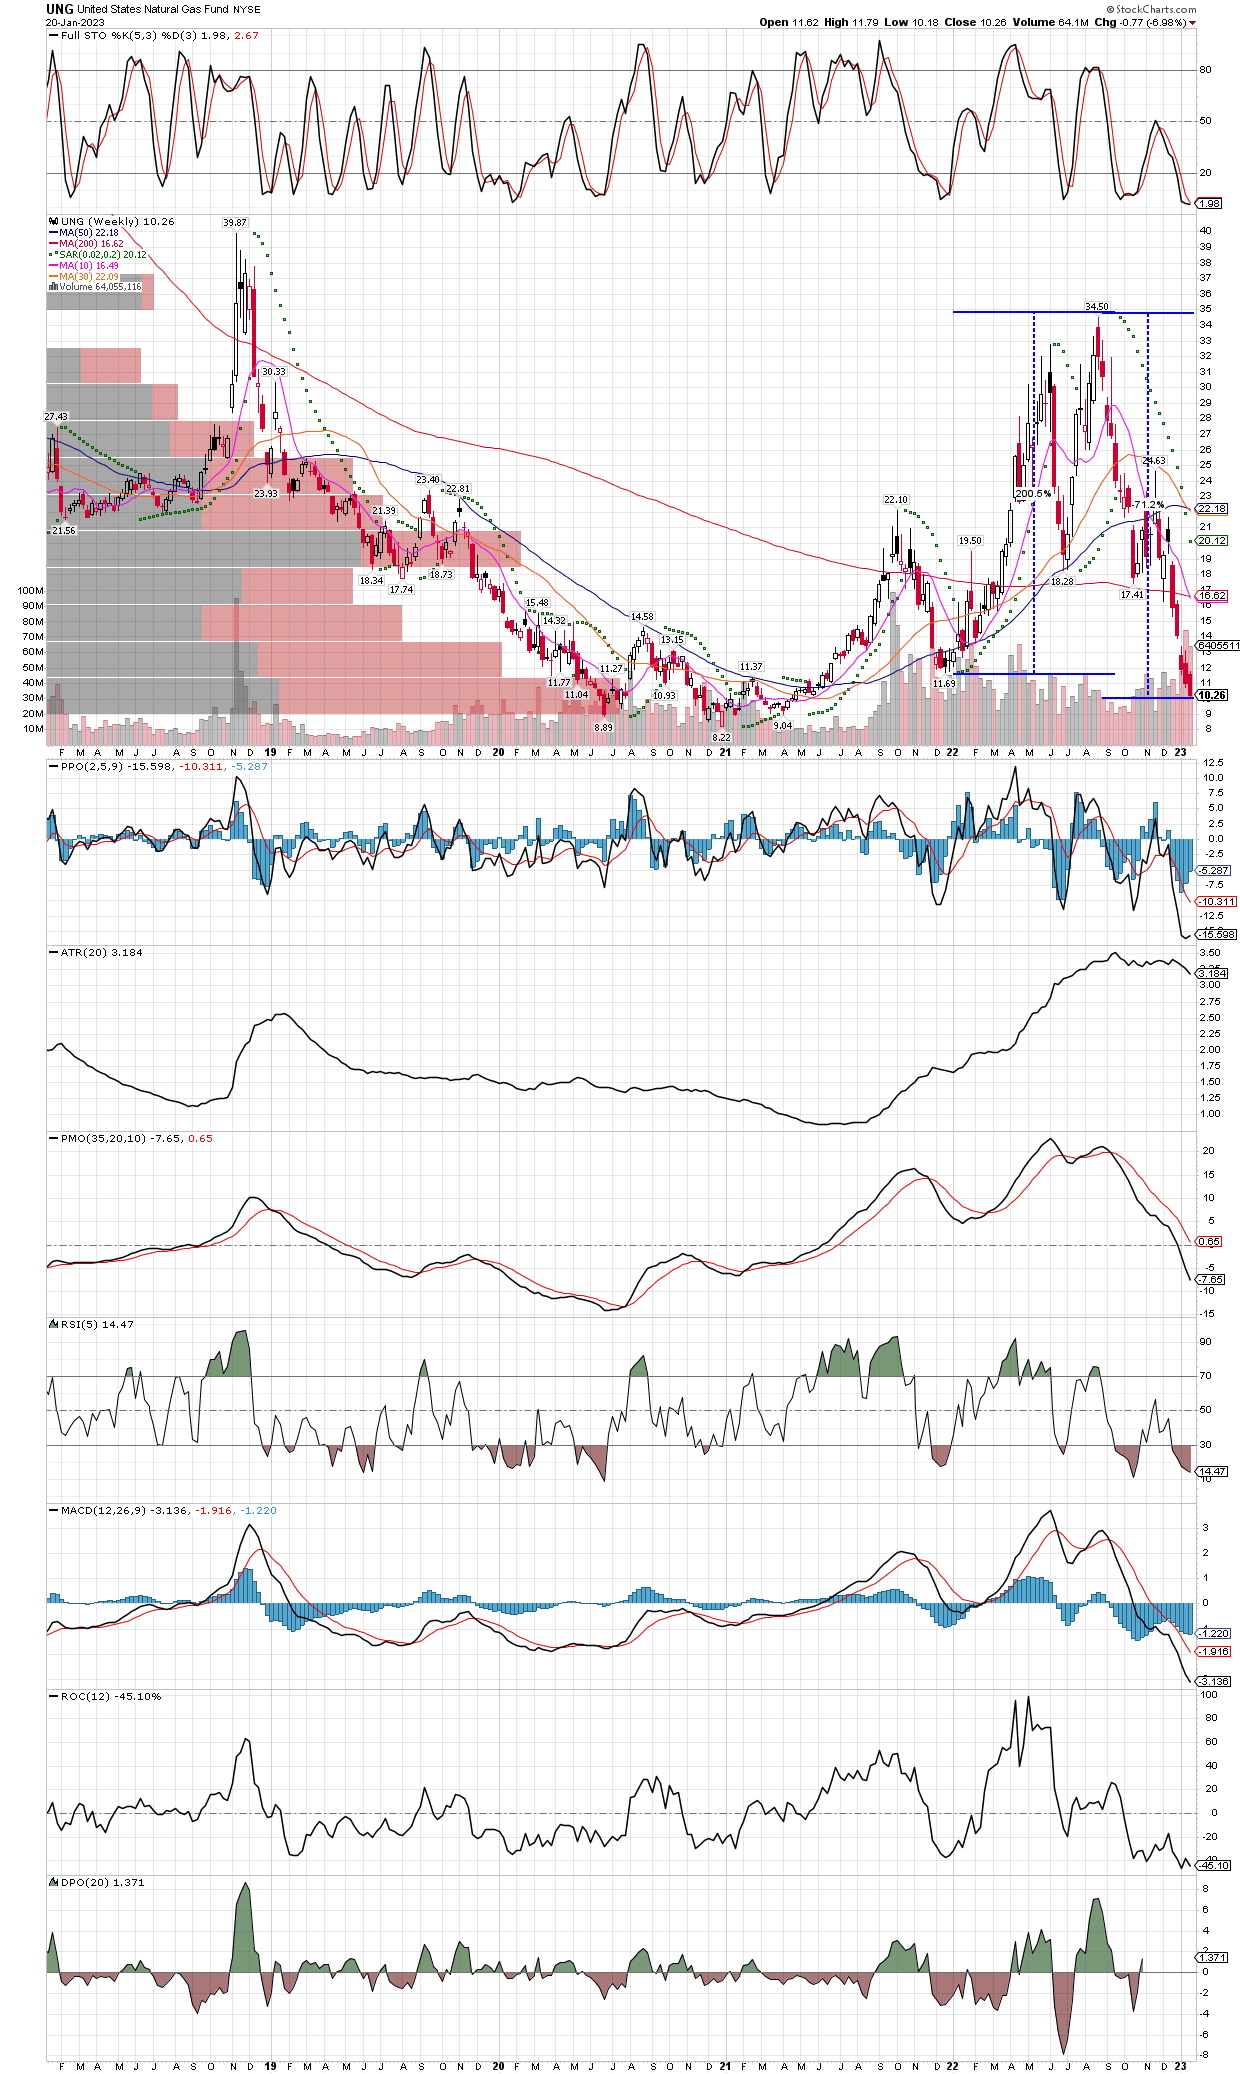
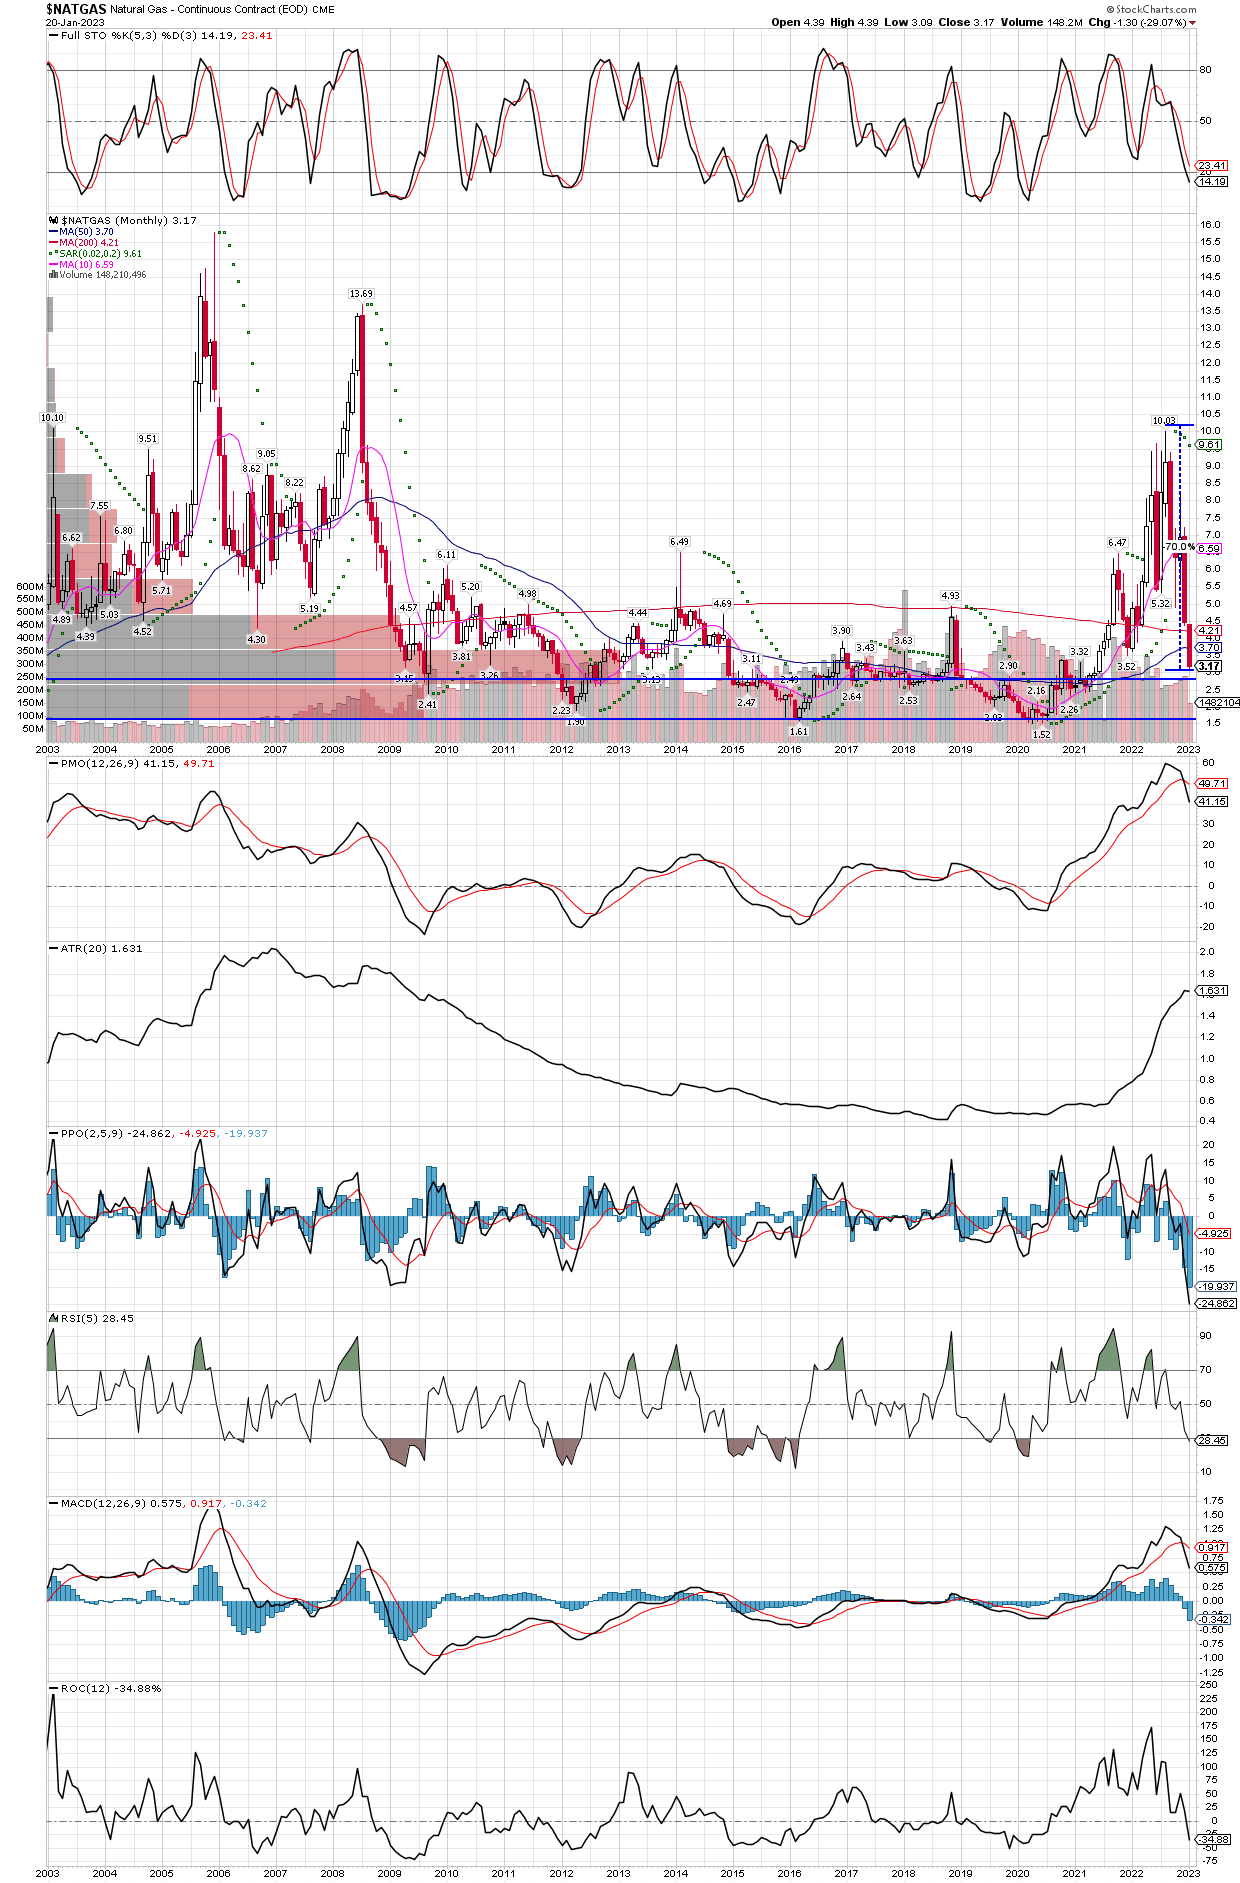
Still, there are opportunities in other commodities when they make outsized moves in one direction or the other, as volatility increases amidst the uncertainty. Natural gas is a perfect example, and we have just recently started a long position. We are looking to add to our holdings until we get to full size, after than we can add at any time if we are still up in the position, meaning we have unrealized gains, and keep overall total risk (TR) fixed. Below, I posted the monthly and weekly charts of $NatGas and UNG respectively, I only switched the weekly chart to the UNG etf since that is the chart I am using to “time into” the trade, and its actually what I bought for myself, friends, and family accounts.
Next, let’s take a look at the weekly chart of the UNG etf, where I have draw two “percentage change lines”. The one of the left that looks like a giant “I” shows the gains from low to high of roughly 200%, while the one on the right measures the total decline from tops to bottom, about 70%. The volatility is absurd, and could present great opportunity if one can get in before a big turn higher, but not so early as to suffer large percentage losses. So why did I choose to start getting invested last week, and looking to add this week? Simple, by any technical measures, natural gas is very oversold, but we also need a catalyst for the next bull run to start. For that, we know that over the last 20 years roughly, seasonal tendencies are for natural gas to bottom into early February, and then experience a nice run higher into late April. In fact, this is typically the best move of the year in the commodity, and while nothing is guaranteed, to me it is well worth taking a shot. I do think a weak economy could keep a lid on energy prices for awhile, but natural gas looks way overdone on the downside, especially considering it was able to rise 200% in such a short time recently, it means that natural gas is in play and plenty of participants making bets. I’m betting it’s more likely to make a big jump from here than a big decline, but as always, I will keep my total risk (TR) to the portfolios fixed.