Tuesday October 19 Update, and New Trade Signal in the MJ etf.
October 19, 2021
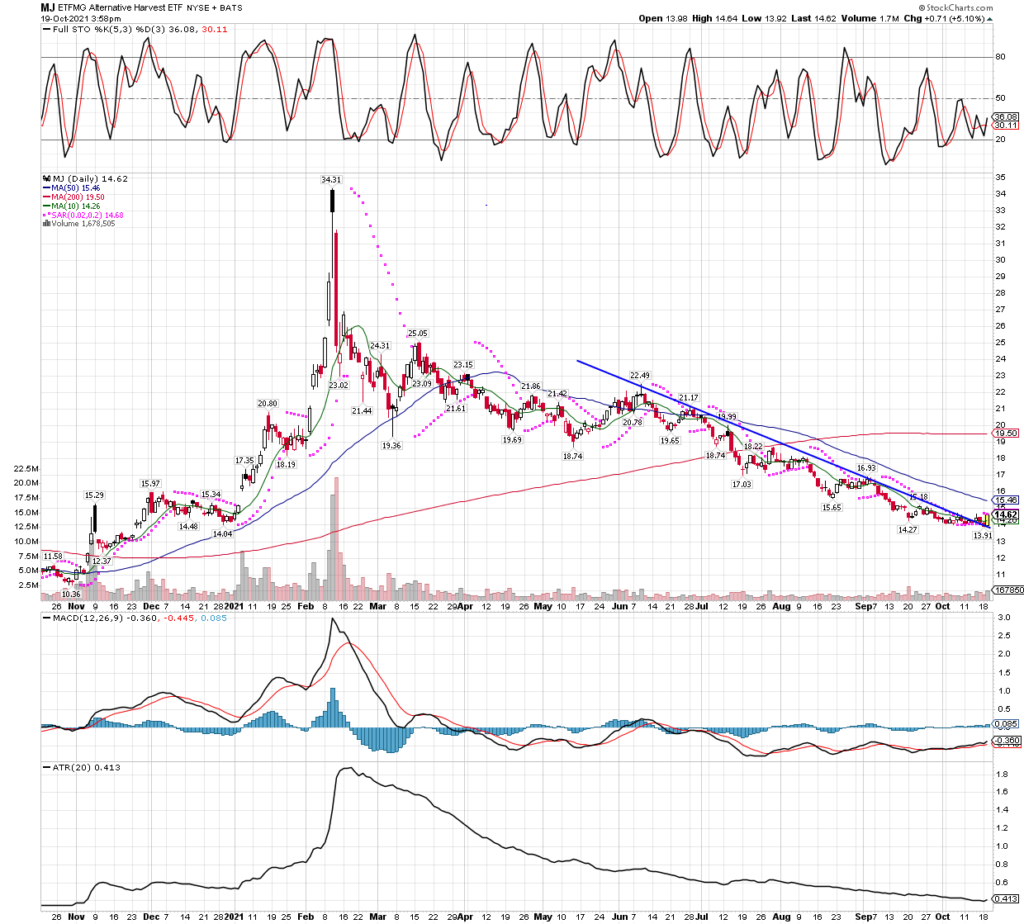
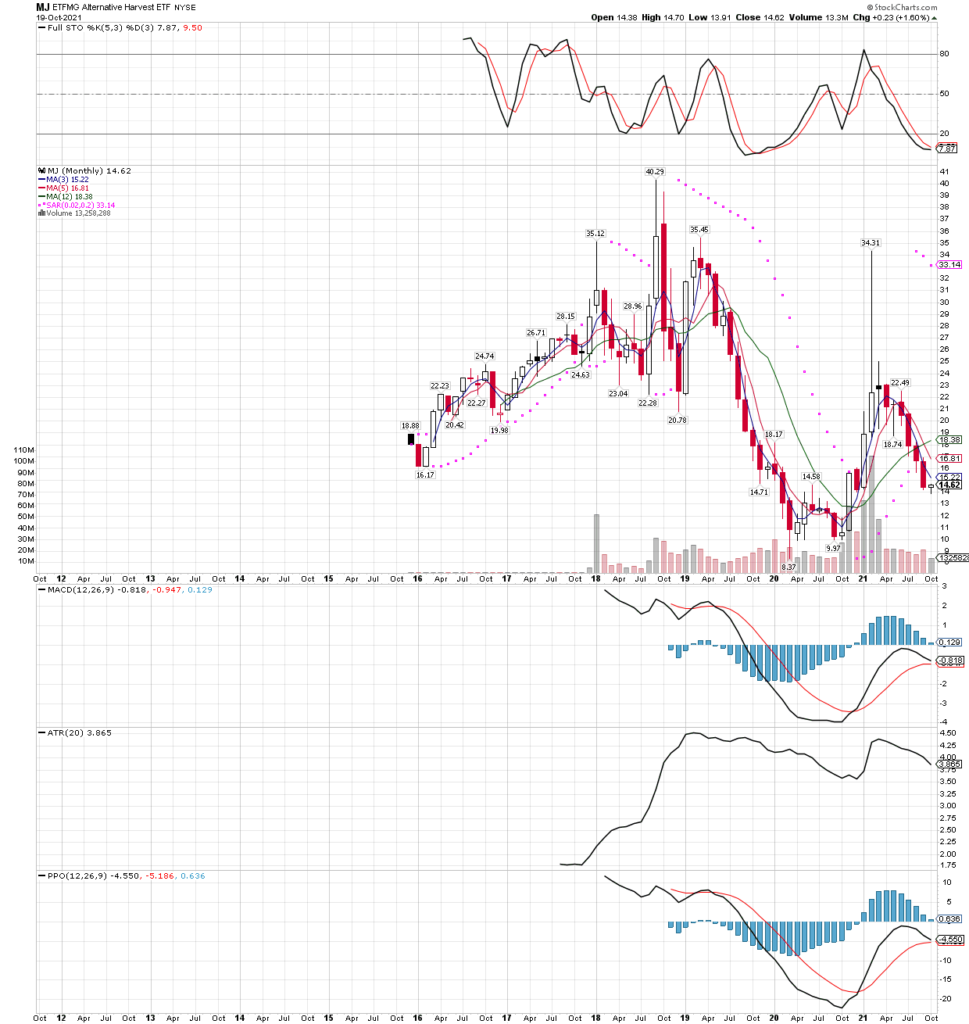
As miners continue to go sideways the last few days up near recent highs, which I like, a new buy signal on the marijuana etf MJ is here. I have not bought any yet, as my major focus continues to be on the precious metals miners, but I will look to acquire some MJ etf (the Alternative Harvest etf) into the next oversold intraday technicals on the 30 minute bar chart. I was tempted to start buying some before the close fo trading today, but the marijuana stocks were closing at the high of the day, after a long, tedious downtrend day after day since the beginning of 2021. Waiting for that longer term downtrend to re-exert itself in the next day or two seems like a better bet to start buying, rather than chase a short-term overbought move, since they always seem to fizzle, at least in 2021 so far. It’s the same way I have been buying my miners, there is no good reason to chase moves up in the context of an overall downtrend, except for the day they make the turn higher permanently. If you can tell me when that is, I will change my buy strategy!
I will keep this post short, and just show you the daily, weekly, and long term monthly charts on the MJ etf, so you can see how oversold the technicals are. Of course, they can stay oversold for awhile, so we don’t want to go in too heavy at the first positive sign like we had today, there have been many other days like this in the last year, and MJ always manages to head lower again rather than turn the trend up. Trading is just a game of probabilities and risk management, not much more to it. Lets take a look at those charts….


