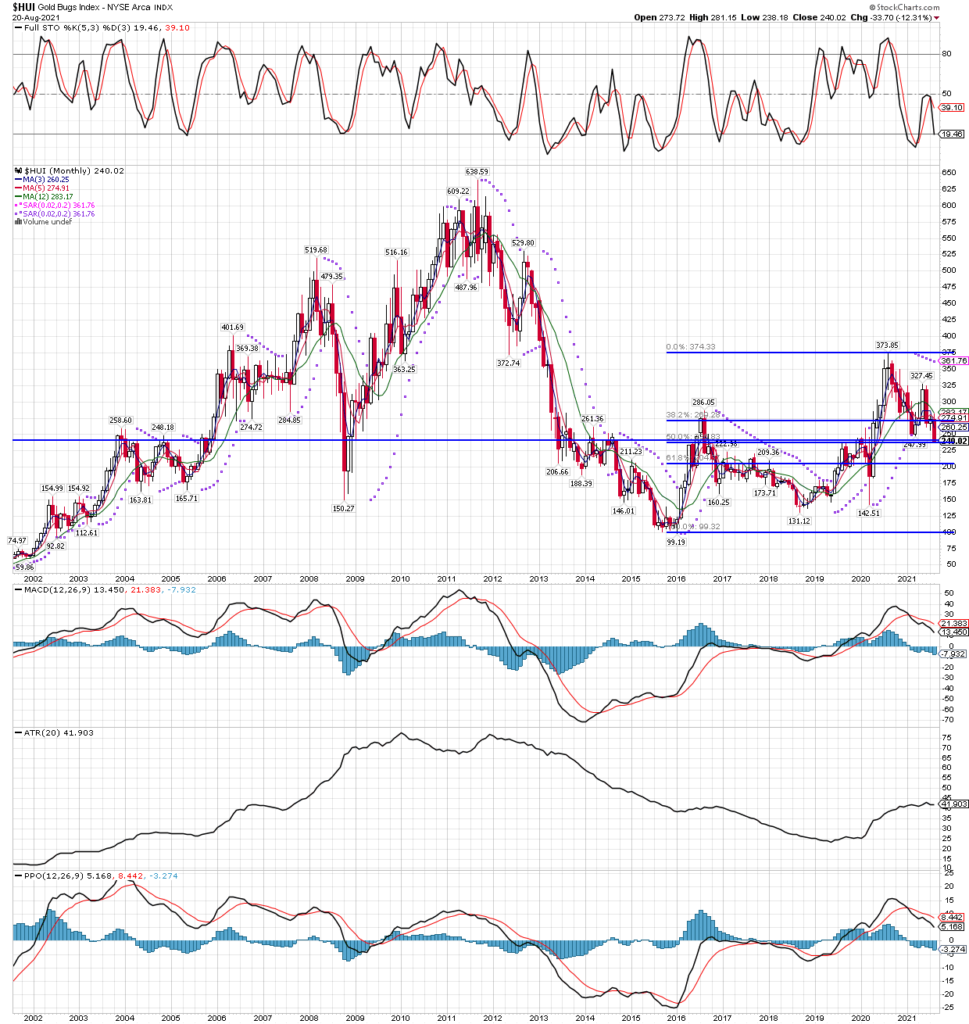
VERY IMPORTANT CHART of MONTHLY HUI
August 20, 2021
Long term charts have more significance because they not only show more history but have wider ranges and more contact points for items such as trendlines. Here we see the HUI MONTHLY chart with fibonacci retracements connecting the bear market low in beginning of 2016 to the bull market high in August 2020, with the all-important 50% retracement coming in at the 237-238 area, and 238 was tested just today, Friday, August 20, 2021.
And that isn’t all! The horizontal trendline touching the highs supports and resistances over the last 20 years also sits right in that area, about 238 on the HUI. Combine the above with the likelihood that as the month ends we will see the stochastics reach oversold (if we close here or lower), all suggest the is an ideal area for the index to find support, and perhaps mount it’s next long term bull trend higher. Something to think about this weekend! 🙂

If I had to rely on just a single chart to trade the bull market in precious metals miners, this would be it!
