Recap for July 30, 2021
July 30, 2021
Today was the last trading day for July, 2021, and while not eventful, I always look forward to seeing the new month’s charts the following week, since longer-term investors use the monthly (and quarterly) charts to make new investment decisions. Professionals and big money will also try to “paint the charts” near month end, in order to influence the trading decisions of others. July is now in the books and done, let’s see how the longer-term charts look next week when they print. Silver was close to “make or break” time according to many analysts, while I don’t think the $25.50 level is a definitive line in the sand, to me we closed close enough to confirm the long-term bull market remains intact.
Today didn’t have anything outstanding to focus on, it was a pullback day after a strong day for our accounts yesterday. I did take advantage of the weakness to add to a few names, and if one wants to check the intraday charts, they will see we got lucky on some of our buys today. We bought the afternoon pullback which turned out to be good timing, as miners turned higher not long after our buy orders were filled. The hourly action is not overly important to traders focusing on our time frames (usually weekly and monthly signals), but it’s always a welcome edge to find our accounts heading higher not long after we get out buy orders filled. 🙂
Looking to next week, I will focus on opportunities to add to miners since it appears the group is trying to turn higher. We also have some seasonal tendencies that should start to support the sector near term. I’m expecting to see a move higher lasting several weeks at least, so it’s important not to sell too early into the move up, since we cannot know yet how strong or far the stocks will run. I will look to add to anything I have added to recently, and focus more on things like the GDXJ etf LEAPS, or my most recent additions being stocks like HL (Hecla Mining), and the junior copper/gold explorer Freegold Ventures. I will also look to get heavier is my biggest winners like MGMLF (Maple Gold Mines), now bouncing off it’s 200 day moving average. Rather than drown you in charts, know that many look similar and therefor we can trade the miners as a group right now, however I will still try to add to the best in the group. How do I know which will be the best? I don’t, that is just being honest, but I will judge by the charts, or in the case of a news driven stock like EQX (Equinox Gold), the fundamentals and how they are changing in my favor. In short, when we get a strong move in a group it often hardly matters which stock we buy!
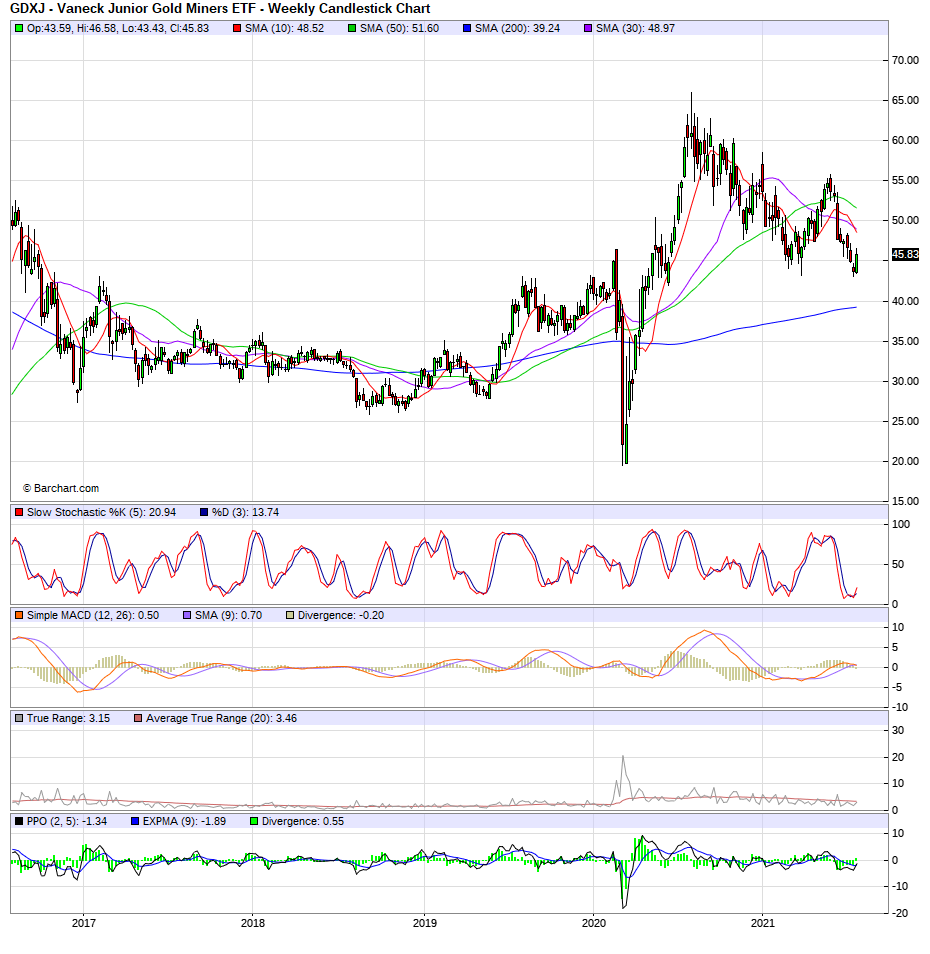
Just a few charts to keep in the back of your mind over the weekend. If one gets overwhelmed by how many stocks look like good buys, one can always look to a popular etf. This can hurt out upside, but also eliminates lots of company specific risk, like unexpected secondary offerings which dilute shareholders. I will try to add to GDXJ and maybe some of my newest buys as well, since I am not yet up to full-risk positions in stocks like EQX (Equinox Gold) and HL (Hecla Mining). I look forward to the new MONTHLY charts that will print on Monday, but the weekly charts for the mining sector continue to suggest they go higher for several weeks at least.
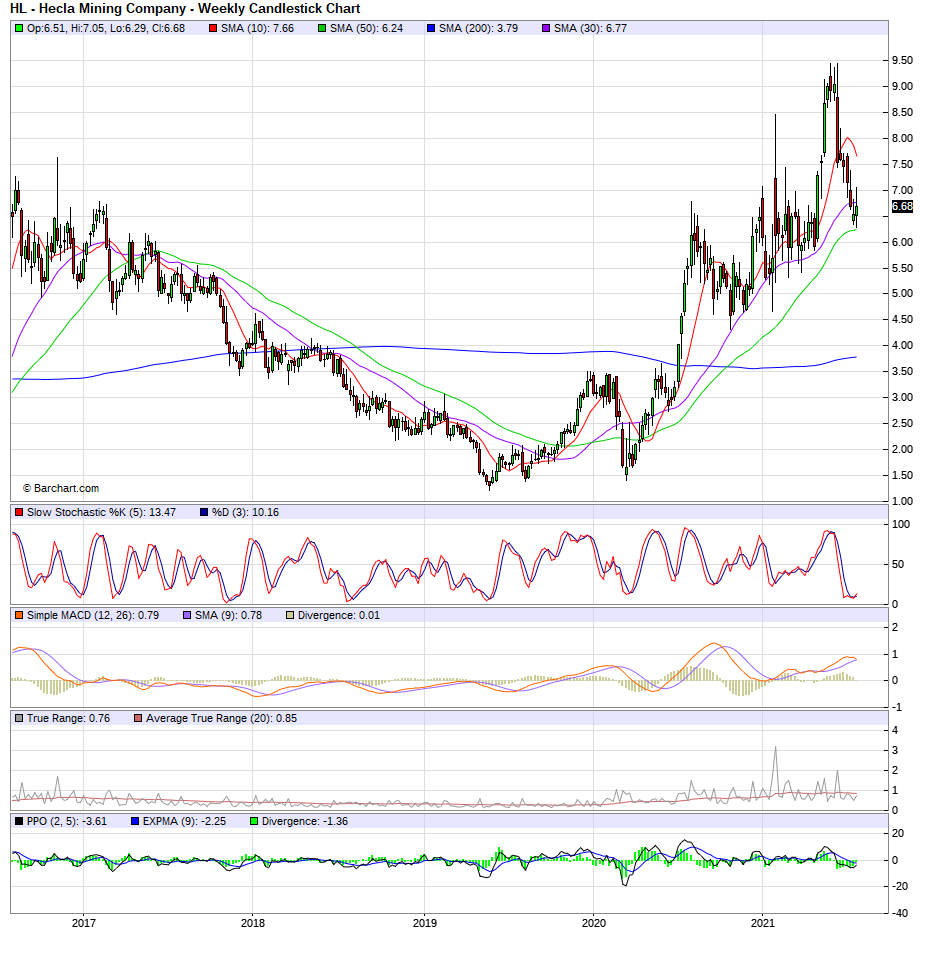
I added to HL (Hecla Mining) today, still looking to increase position up to full-risk. Here is the WEEKLY chart, nice and simple, oversold and at support.
And the DAILY chart looks similar as far as sitting on support (200 day MA), though the stochastics are no longer oversold. In a situation like this, I’m often asked which is more important, the daily not being oversold or the weekly being oversold? I will always defer to the longer term charts as they have more history, more action that has created the longer term chart, however, I will respect the fact that the daily has already moved out of oversold and could be due to turn lower for a few days. I’m not predicting it goes lower, but when looking to buy or add to my position, I take this fact into account and try to buy with limit orders only, and maybe below the current market price. Basically, I am more patient with my buy orders when the time frames don’t match up perfectly. Here is the HL DAILY…

Let’s look at GDXJ’s WEEKLY chart again, I will likely add to this one next week…

MUX was weaker than most miners today, but has been stronger than most lately, so the daily chart had me buying comfortably as I was adding to a winning position, and the stock sits on it’s 200 day moving average (not shown here, as this is a weekly chart). Using the very short term 30 minute bar charts of intraday action, allowed me to get nice fills near the day’s low prices, not long before the stock rebounded and climbed into the close of trading. More importantly, the WEEKLY stochastics are very oversold like most stocks in the group. Stop levels have been updated, members can check the revised numbers, and should review the daily account screenshots for pertinent information like average costs per share, unrealized gains and losses, etc.
Too many miners look similar, so that we don’t need to go through them all, but let’s check on EQX (Equinox Gold) via it’s WEEKLY chart, again quite similar to others in the group, so why did I pick this stock to talk about? For one, it has been pushed much lower than most of the group, being it had unfavorable news in the form of blockades on it’s Mexican property, which temporarily shut down the mine (it was re-opened this week, so this issue should be getting behind us soon). Also, EQX was a sector leader in the earlier stage of the bull market in metals and miners, a result of great production numbers, and increasing reserves. In short, Equinox was firing on all cylinders before the blockade, which hit at the same time as the sector pullback resulting from the FOMC news they might tighten rates sooner than the market anticipated. I mostly ignore the FOMC, but the market does react to their lies and double-talk, so I take that into account. In any case, EQX was one of the best and still is, so I bet the market re-discovers this in the next leg up for the precious metals bull market. I don’t want to limit the upside, but a double on this one would not surprise me at all, nor would it shock me to see it occur quickly once the group move starts. It might be happening now, but if not, I expect a move higher sooner rather than later. Here is the WEEKLY chart of Equinox…

That’s enough for this afternoon, you get the picture. If I uncover anything worth noting over the weekend, I will try to make a post here, but members can get all the details and account information, changes to stop levels and portfolio in the tabs above. The news and analysis are good to know, but the numbers and risk-control are what matter most. Keep it simple and let’s see what next week offers.

