Ratio chart, GDX vs the SPY
June 30, 2021
I like to take a step back and examine ratio charts on occasion. They can give us a broad sense of what to expect with one group of stocks vs another. Let’s take a look at the GDX big-cap miner etf vs. the S&P 500 etf (SPY). Here is a weekly chart, suggesting that for at least the next 6-10 weeks, GDX should outperform the SPY etf on a relative basis.
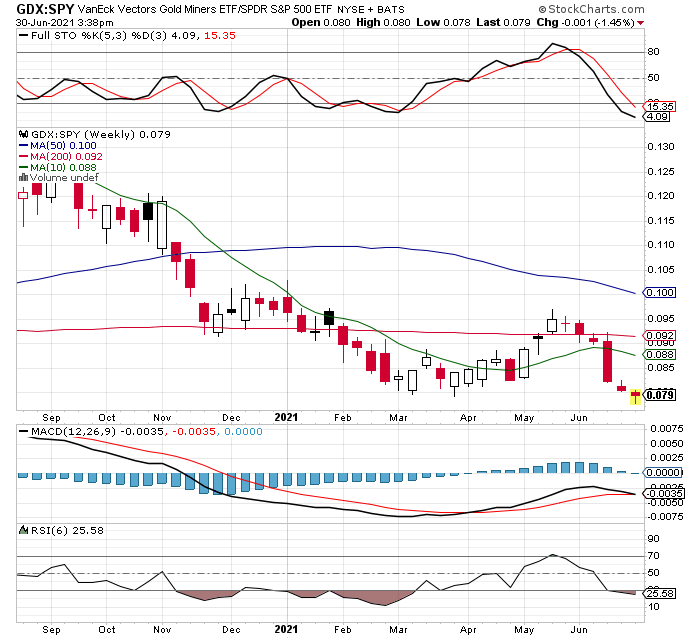
Of course, nothing is guaranteed, but I like to have charts like this on my side. It might not play out like this, but it looks as if the GDX is going to do better than the SPY, and the only thing I don’t like is the MACD is turning negative. So what does that mean and how to I factor it into my trading? I temper my expectations when some indicators are in conflict with others, so while I think GDX will do better overall for the next couple months, I also realize the outperformance might be tempered somewhat, since the MACD is just starting to probe the downside. Note the RSI is also into oversold territory now as well, so Im thinking the GDX won’t likely go down much more than the S&P500 in the near term, and the GDX might go up much more than the SPY. If I wanted to trim some holdings after the FOMC announcement recently that crushed the metals and miners, as many people are looking to do, I would still be waiting for a setup like we see in the chart above. There is usually a better time to exit than in panic mode caused by news events, and now we are getting that window of opportunity to sell something soon, if that was out intention (it’s not mine, but many are now afraid the fundamentals have changed so want to sell some). I don’t think the fundamentals have changed at all, I also don’t think the story from the FOMC is changing at all, other than to manage expectations, pushing on this side for a moment, then pushing on the other side a little, in order to try and sail straight!