Gold to Silver ratio GLD:SLV
October 9, 2019
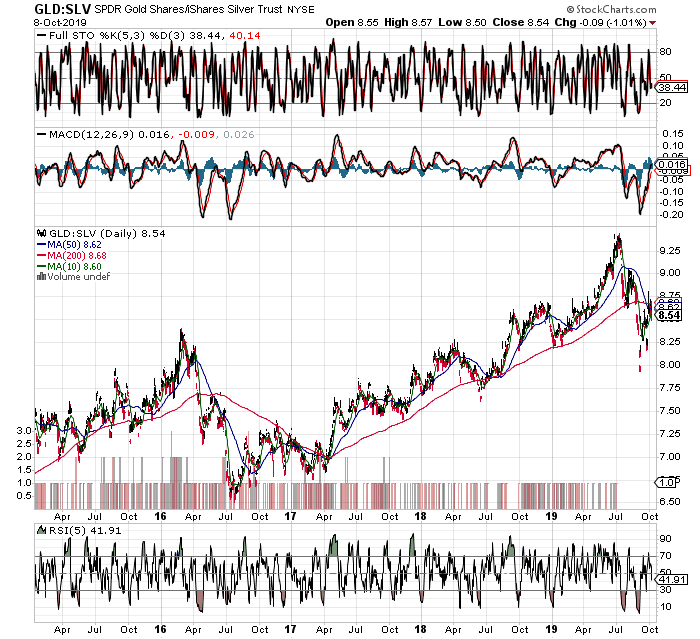
While waiting for this correction play out, I pulled up the GLD:SLV ratio going back to the 2016 bull rally, mostly because I am seeing signs that this pullback either might not go too deep, or last too long. We can see that after the initial move lower in the ratio (pushing miners higher), we still had another drop, which let the miners make another big leg up. Importantly, the second drop in the ratio occurred just after the “death cross” in the moving averages, which is exactly where we stand right now, complete with the rebound higher to kiss the 200 MA. If this played out again, we would see around 3 months higher in another strong upleg for miners. I am not sure where that would put us cycle-wise, especially since Jan to March is the strongest time of the year for silver, I suppose it might imply we could extend the move through March 2020 which would make the move that much larger, but that is just a guess. One last note, if we are indeed in a longer term bull market resumption, that ratio might trend lower for much longer than occurred in 2016. In any case, the worst to happen if we see similar action to 2016 would be a roughly doubling of the gains already made in the most recent run we have enjoyed.
In short, the risk now seems in being out of metals and miners waiting for a deeper pullback to buy. If one is a bull, it might be best to start or add other positions in here, as lots of individual miners are performing very well, and gold doesn’t seem to want to stay below $1500 very long. Regarding the more volatile silver market, the metal has already corrected 50% of it’s gains, landed in an obvious support zone, and bounced with force the last few days, even outpacing gold to turn the GLD:SLV ration lower once again. We also see the miners starting to outperform the metals again, indicating a low is near, or is already behind us.