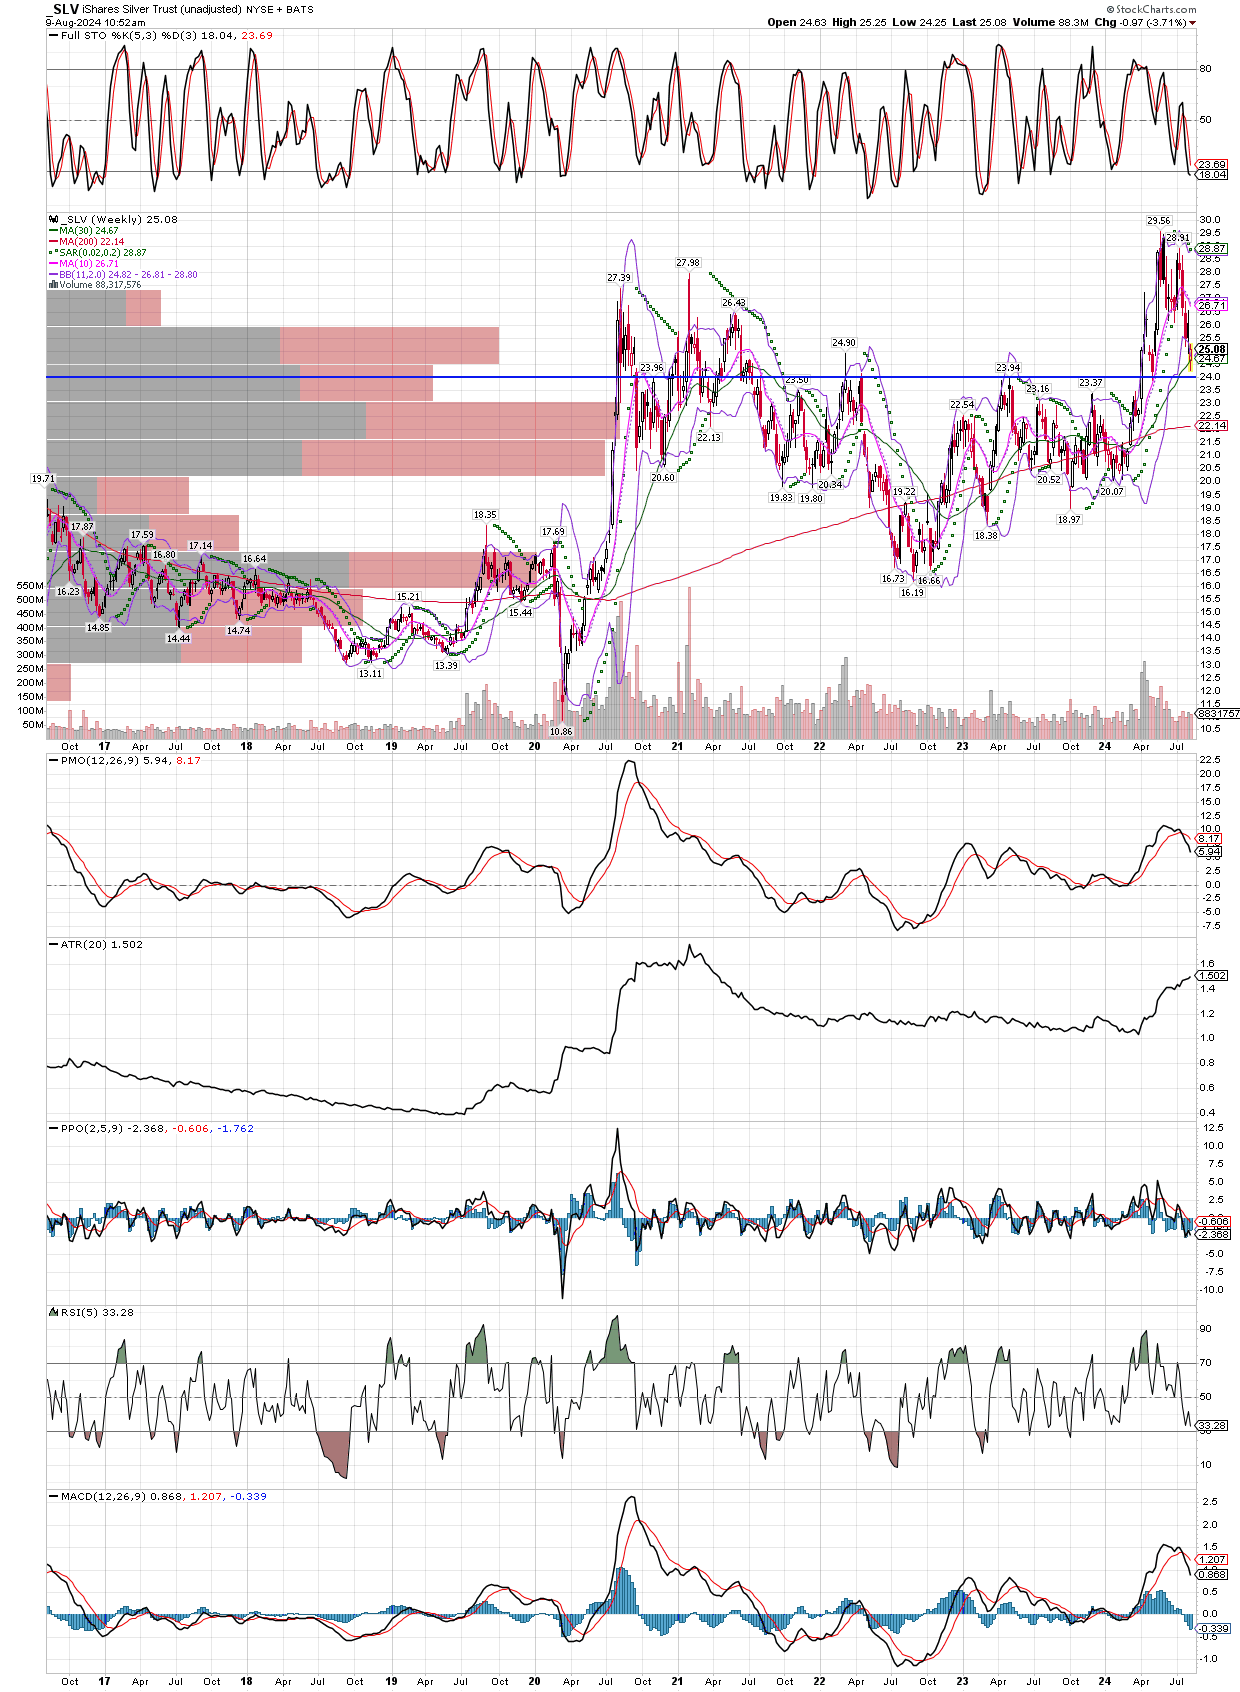
Another Look At Silver Weekly Chart
August 9, 2024
Stepping back to get the bigger picture, this SLV chart goes back 8 years, the horizontal trend line is my doing. While I don’t trade in or out because of trend lines, mostly because I feel they are more loose areas than lines in the sand, I still find them useful to identify areas where something might find support or resistance. Seeing SLV oversold on the weekly stochastics, combined with coming into a range of possible support going back many years (it was past resistance), helps one pull the trigger.