SLV Monthly Chart Looks Like It’s Breaking Out To The Upside
March 17, 2024
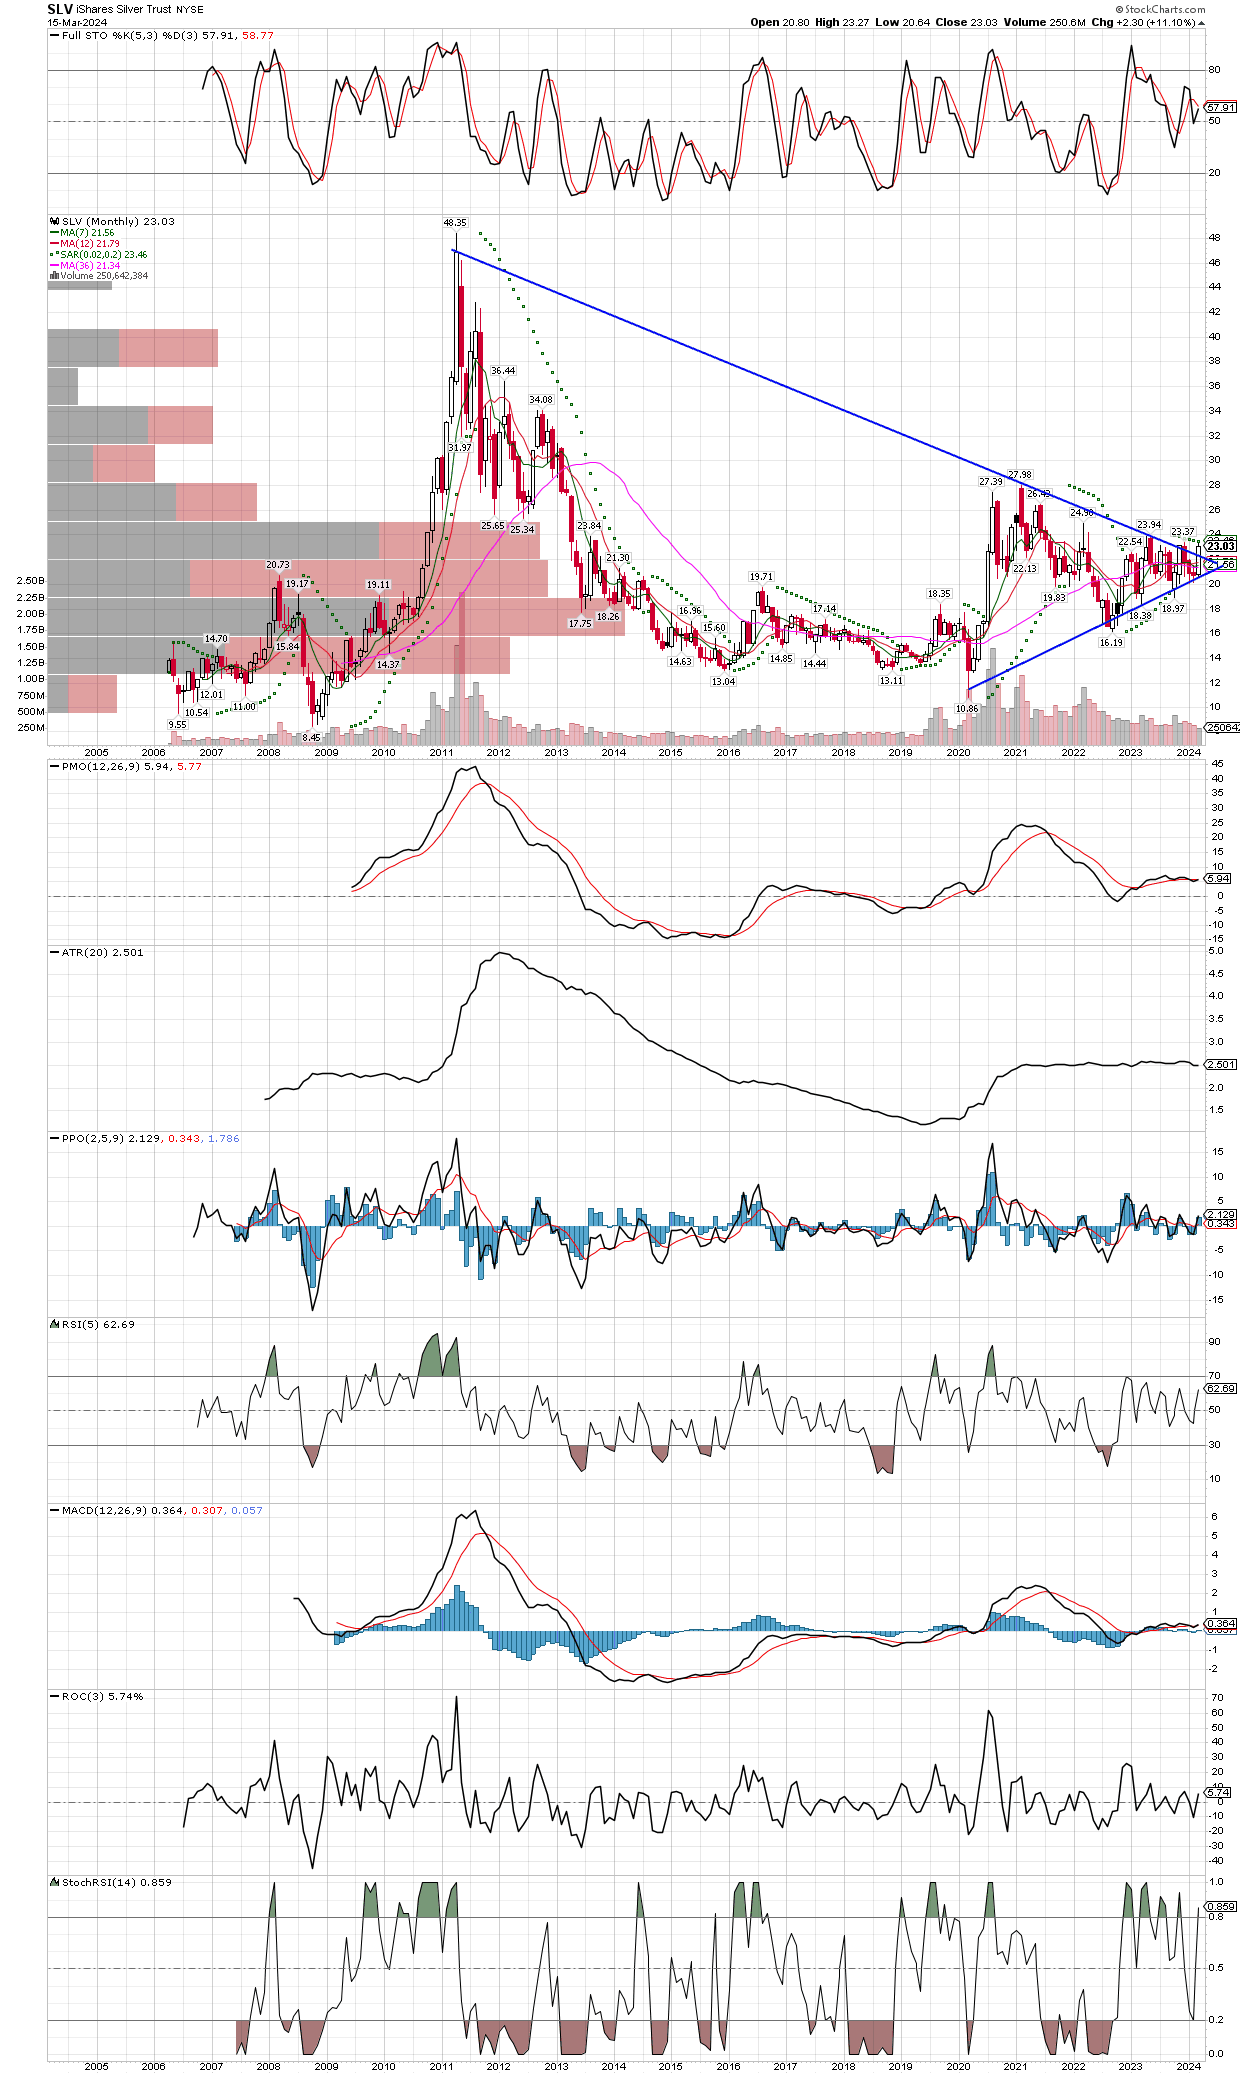
While I realize trend lines are subjective, as the person drawing them determines the contact points. In other words, does one just use the absolute high or low of the wick, and do they allow for a trend line to have been penetrated, as long as it came back into range and continued to stay in the range? For this reason charting and trend lines can’t be exact, however they can be used to get the general areas and trend directions correct, so are of great use overall. Regardless of how you draw the lines on the chart of SLV, it’s clearly in an uptrend since the 2020 lows, and it’s making a solid attempt to move higher with that solid white bar for this month (March) which is more impressive being the month is only half over. Then the PPO has just put in a positive bar, and like the GDX chart I posted yesterday, this move up is contrary to the down sloping stochastics, always a sign of overwhelming strength as it’s shaking off the tendency to go in the direction it “should” be going. Something bigger is happening, even it it’s not yet apparent in the news, and both SLV and GDX want to go higher over the next couple months at least. I added to some of my miners, keeping in mind they usually bite me before they work out, so didn’t buy heavily. Still, I added to BTG with it’s 6.2% dividend, some HL, SVM, and even started positions in a few developers and explorers like WRLGF, AAGFF, and AGXPF. My plan remains the same, and I will not be going overboard on the juniors at this stage in the new bull, but later on I might shift profits on my mid-caps into the more risky juniors. I also plan to add to EQX, ORLA, JAGGF, maybe also AG and HL again, if a pullback materializes.