Added to SILJ and CDE
July 19, 2022
Below I posted the SILJ daily chart, and the CDE weekly chart going back 5 years, both with their clear downtrend lines from recent highs. One could wait until after the trend line is broken to the upside before buying, but with such drastically oversold technicals, I would rather add to positions here while the stochastics are oversold on the 30 minute bar chart intraday.
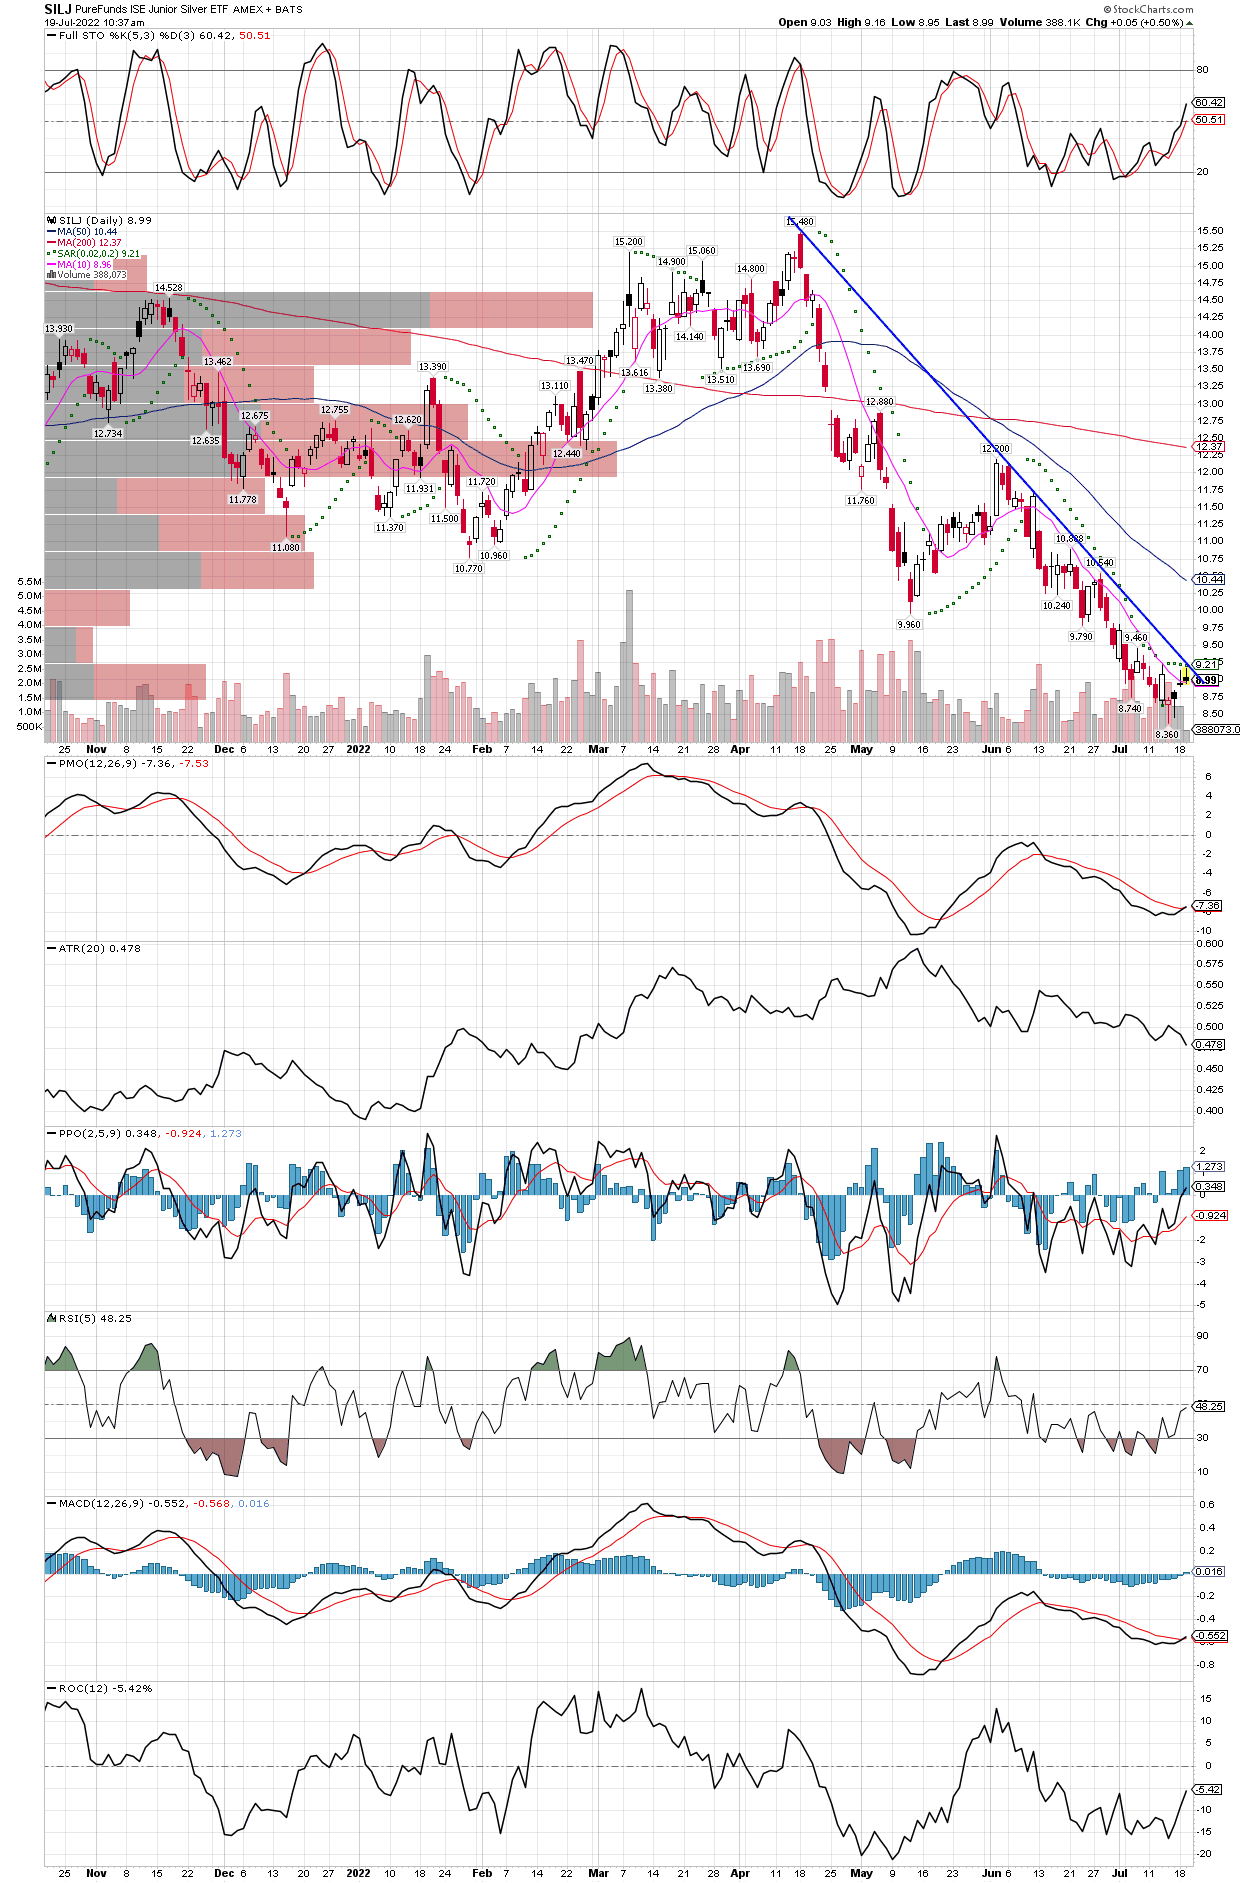
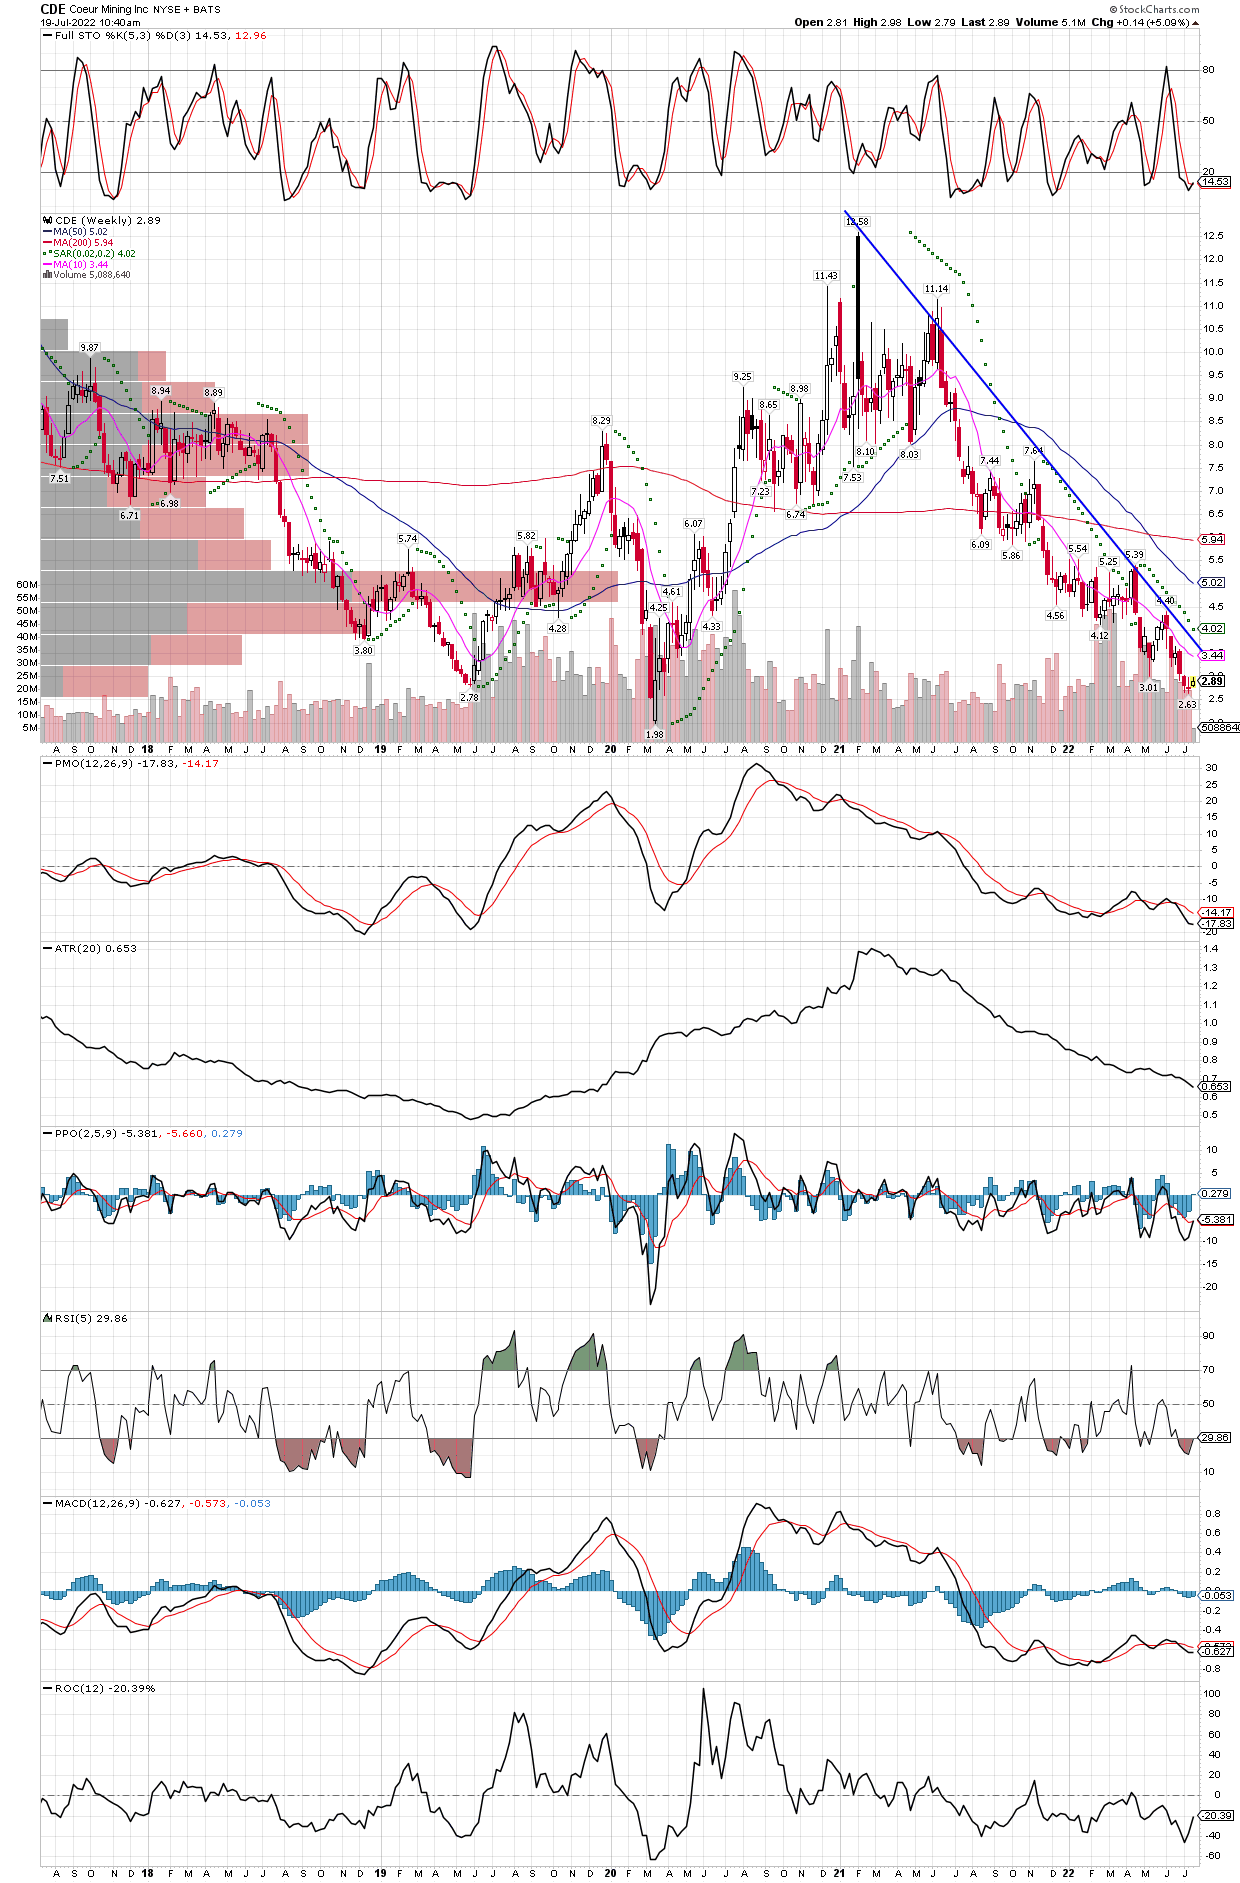
A break above these trend lines, combined with technical indicators coming out of oversold and new daily and intermediate cycles , all suggest a bottom is near.