Recap for Friday Aug. 6, 2021
August 7, 2021
Today brought more weakness to the mining sector, a big enough drop to allow me to bring up my holdings in Hecla Mining (HL) and Equinox Gold (EQX) to full-risk positions, as well as add to McEwen Mining (MUX). I had limit orders in all day bidding for more GDXJ and SILJ, but those did not get filled. Since I still don’t see many people, if any talking about buying into miners, I will probably try again next week but will explain below how I will handle the opening on Monday, I won’t go running to buy right out of the gate.
What allowed me to step in with some larger orders was not only the price being knocked down sufficiently to levels where things like gaps closing occurred, along with 50% fibonacci retracements on various individual stocks, but also we started to see miners hold up better than the metals. Miners usually move around double what the metal does, so when we se gold down 2.5% and silver down close to 4%, we normally expect to see gold miners down 5% and silver miners down 8%, but that was nowhere near what happened. Instead, we saw GDX down 3%, and SILJ really stood out, dropping only 1.93%! Until today, miners have really underperformed the metals, but when the trend changes, it will likely start with miners showing relative strength versus the metals like we saw Friday. We are not out of the woods yet, but the daily stochastics are now reaching oversold as well, something I pointed out yesterday, and after another poor day for the sector.
Lets take a look at the weekly GDX and GDXJ charts with their fibonacci retracement levels, since the etfs are more indicative of a group’s strength or weakness than an individual miner. While I examine the charts of the various individual stocks I am trading or investing in, I always want to first know where the group stands and how it’s performing, as most stocks in that sector will trade similarly. First is GDX…
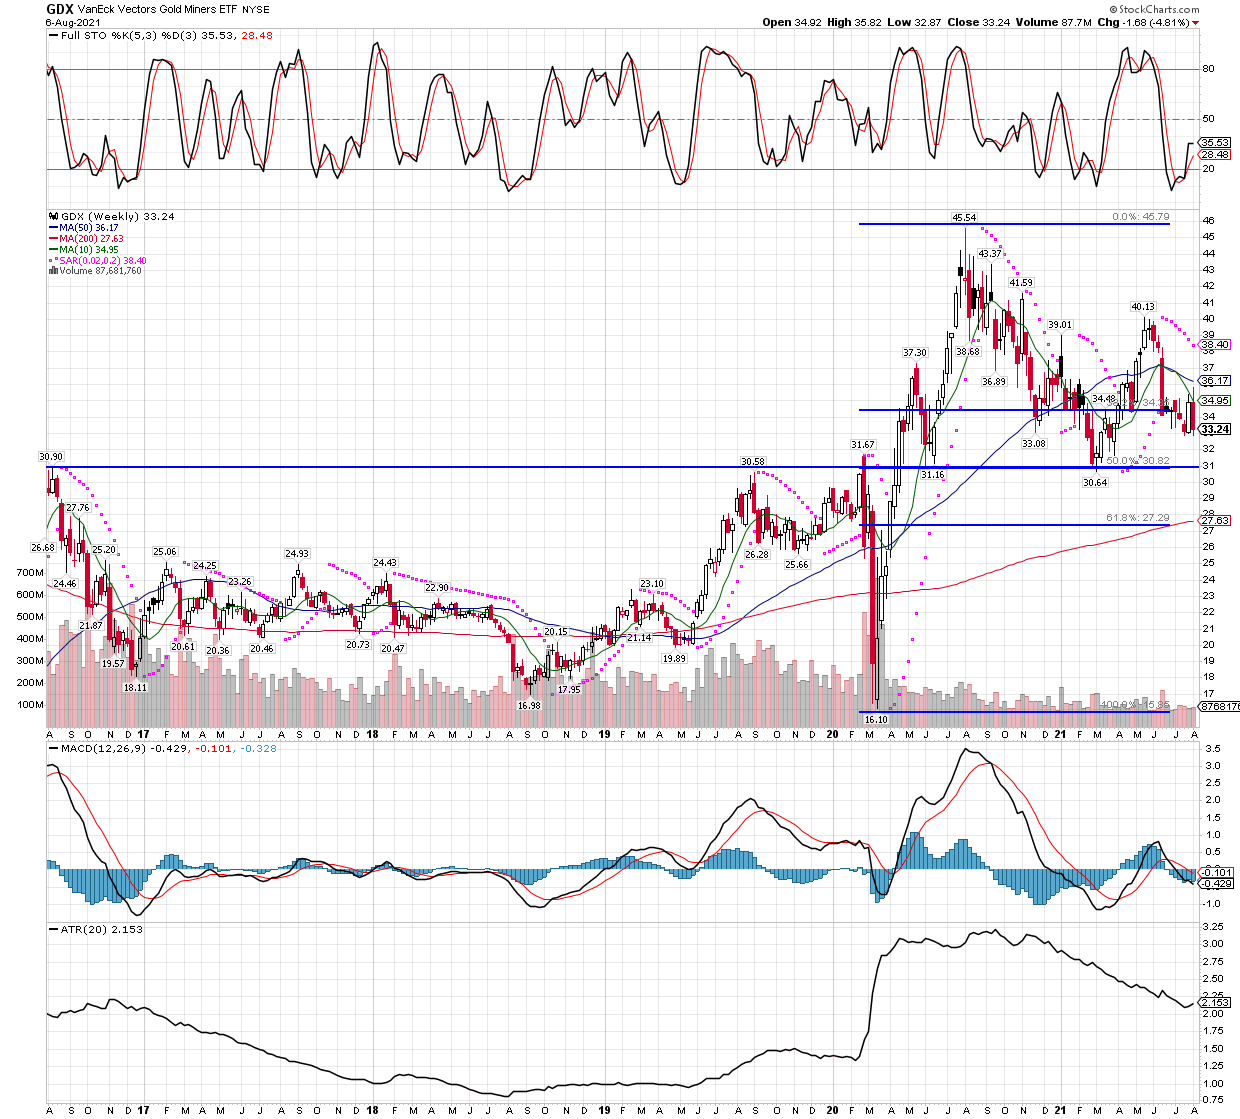
The WEEKLY chart fibonacci is drawn from the depths of the March 2020 low, all the way to the August 2020 high. It’s hard to believe it, but we have now been in a downtrend for an entire year since that high in August! I would note that is a typical time for a sideways to lower consolidation after a big bull run. For whatever reason, miners seem to run higher sharply for 6 months or so, then go sideways or lower for a whole year, before they mount another sharp rally. In any case, this fibonacci chart suggests GDX could still drop to the $31 for a full 50% retracement, a couple dollars lower from Friday’s close. Also note the horizontal trendline at $31, too, it seems that we might get to that level but also that it should hold, or mount a rally from there. Now let’s see what the GDXJ WEEKLY chart has to say on the matter…
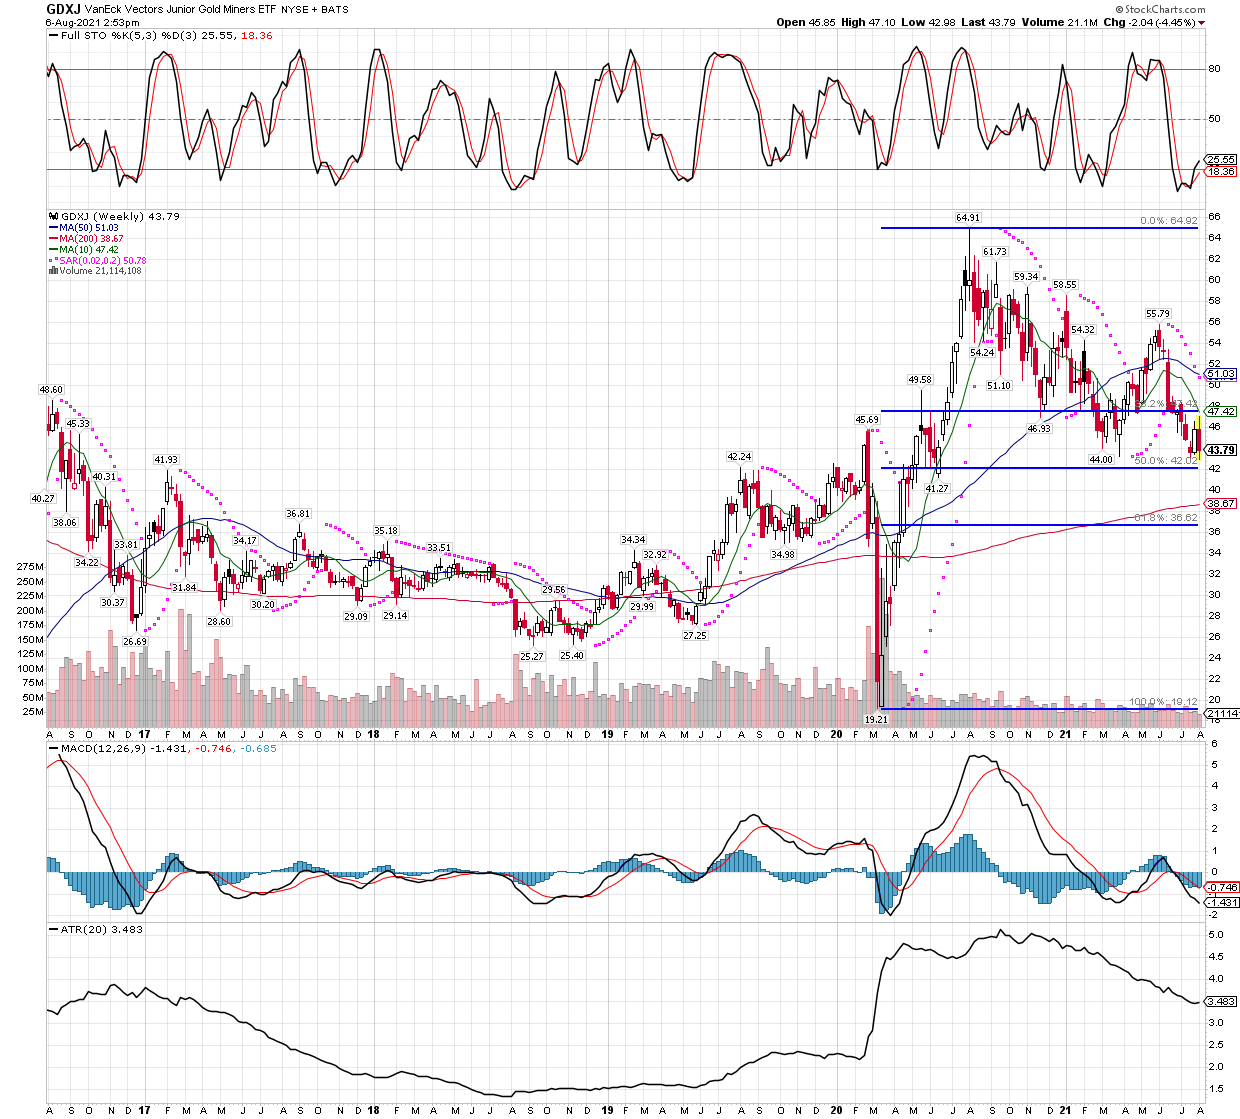
GDXJ confirms what GDX suggests, that they could drop a bit more if they are to complete a full 50% retracement. However, GDXJ also got closer to closing that gap during trading as it dropped to $42.98, only a dollar away from it’s 50% level, before closing at $43.79, leaving it about $1.80 from its 50% level. Both charts tell me that while we are getting very close to bottoming, we might not be there yet and we might have to take a little more pain. For sure, it’s not worth trying to get out here to try and evade any additional downside, because once miners do decide to turn in earnest, they will make up these few last dollars of downside so fast that we are more likely to miss the opportunity than to save from any additional losses. In short, it’s time to be buying or sitting tight, nothing else.
As far as how I will handle trading early next week, as in Monday morning. Because of how my holdings closed on the intraday 30 minute bar charts, with stochastics just barely coming out of overbought, my hunch is we could see some weakness, or at least a cap on any upside or gap higher, for a couple hours after trading opens. So I am still looking to buy/add to positions, but as mentioned in the opening, I am NOT going to do any panic buying on Monday. I will wait for the market to work off the overbought technicals, then assess where my positions sit and decide how much to buy and at what limit prices. This tactic on timing into positions has really helped give and edge, and saved a lot of money over time, even if it’s just 10 or 20 cents per share, it truly adds up over time. We also take the same edge when exiting, so put another 20 cents per share into your account. On many trades, this alone is the difference between making a profit or loss, but even on a $1 gainer per share, an extra 15 cents saved in AND out, is 30 cents to the bottom line. When talking a $1 profit per share, an extra 30 cents is 30% extra! It’s wise to pay attention to detail in this business. I might have an update on the game plan before trading starts on Monday, depending on how the futures markets action is shaping up Sunday night and before the open on Monday. I think we are nearing turn in the markets and the precious metals sector, we just can’t know what minute it will start, but it’s close I believe.